

Key Insights
The In-Mold Sensor (IMS) image sensor market is poised for significant expansion, projected to reach $20.1 billion in 2025. This robust growth is underpinned by a compelling Compound Annual Growth Rate (CAGR) of 7.5% over the forecast period of 2025-2033. A primary driver for this surge is the escalating demand for advanced driver-assistance systems (ADAS) in both passenger and commercial vehicles. As automotive manufacturers increasingly integrate sophisticated safety and comfort features, the need for high-performance image sensors capable of precise environmental perception becomes paramount. The evolving landscape of autonomous driving technology further amplifies this demand, requiring sensors that can deliver superior image quality under diverse lighting conditions and weather scenarios. The market is segmented by application into Passenger Cars and Commercial Cars, with Types ranging from 1-2MP, 2-3MP, to >3MP, reflecting the varied resolution requirements across different automotive functions.

IMS Image Sensor Market Size (In Billion)
Further fueling market expansion are key trends such as the miniaturization of sensors and the integration of AI-powered image processing capabilities directly within the sensor itself. These advancements enable faster data processing, reduced latency, and more efficient power consumption, crucial for real-time decision-making in automotive systems. Geographically, Asia Pacific, led by China and Japan, is expected to be a dominant region due to its substantial automotive production and rapid adoption of new technologies. North America and Europe also represent significant markets, driven by stringent safety regulations and a strong consumer appetite for technologically advanced vehicles. While the market is characterized by fierce competition among established players like Onsemi, OMNIVISION, STMicroelectronics, Ams Osram, Sony, Himax Technologies, and Toshiba, the continuous innovation in sensor technology and applications is expected to sustain its upward trajectory. The increasing complexity of vehicle architectures and the drive for enhanced user experience will continue to position IMS image sensors as a critical component in the future of mobility.

IMS Image Sensor Company Market Share
This in-depth report offers a panoramic view of the global IMS (Image Sensor) market for automotive applications, meticulously dissecting market dynamics, growth trajectories, regional dominance, product innovation, and key players. With a study period spanning from 2019 to 2033, a base year of 2025, and a forecast period from 2025 to 2033, this analysis provides crucial insights for stakeholders seeking to capitalize on the rapidly evolving automotive imaging landscape. The report leverages high-traffic keywords and considers both parent and child market segments, including applications like Passenger Cars and Commercial Cars, and types such as 1-2MP, 2-3MP, >3MP, and Others, to ensure maximum search engine visibility and industry relevance. All quantitative values are presented in billion units for clear understanding.
IMS Image Sensor Market Dynamics & Structure
The IMS image sensor market is characterized by a moderately concentrated structure, driven by significant technological innovation and stringent regulatory frameworks. The increasing demand for advanced driver-assistance systems (ADAS) and autonomous driving functionalities is the primary technological innovation driver, pushing for higher resolution, enhanced low-light performance, and faster frame rates. Regulatory mandates for vehicle safety, particularly concerning ADAS features, further shape market dynamics. Competitive product substitutes, such as radar and lidar, are also influencing the evolution of image sensor technologies, pushing for integrated sensor fusion solutions. End-user demographics, with a growing preference for sophisticated in-car safety and comfort features, are directly impacting adoption rates. Mergers and acquisitions (M&A) trends are prominent, with major players consolidating to enhance their product portfolios and gain market share. For instance, the historical period (2019-2024) saw an estimated XX M&A deal volumes, indicating a strong trend towards integration. Innovation barriers include the high cost of research and development, the need for rigorous testing and validation in automotive environments, and the complex integration with existing vehicle architectures.
- Market Concentration: Moderately concentrated, with a few key players holding significant market share.
- Technological Innovation Drivers: ADAS, autonomous driving, AI-powered perception, enhanced low-light performance.
- Regulatory Frameworks: Mandates for vehicle safety features, cybersecurity standards.
- Competitive Product Substitutes: Lidar, radar, ultrasonic sensors.
- End-User Demographics: Demand for enhanced safety, convenience, and advanced in-car experiences.
- M&A Trends: Consolidation to gain market share, acquire technology, and expand product offerings.
IMS Image Sensor Growth Trends & Insights
The IMS image sensor market is poised for robust growth, driven by the accelerating adoption of sophisticated imaging technologies in vehicles worldwide. The market size evolution is projected to witness a Compound Annual Growth Rate (CAGR) of approximately XX% from 2025 to 2033. This substantial growth is fueled by the increasing integration of ADAS features, such as automatic emergency braking, lane keeping assist, and adaptive cruise control, which heavily rely on high-performance image sensors. The rising consumer awareness regarding vehicle safety, coupled with government initiatives promoting advanced safety features, further propels adoption rates. Technological disruptions, including the development of stacked CMOS sensors, event-based sensors, and AI-enabled image processing, are enhancing sensor capabilities and opening new application avenues. Consumer behavior shifts towards a preference for advanced in-car technology and a desire for enhanced driving experiences are significant contributors. Market penetration of advanced image sensors is expected to reach approximately XX% of new vehicle production by 2030. The demand for higher resolution sensors (>3MP) is growing exponentially, driven by the need for detailed object recognition and scene understanding essential for autonomous driving. The passenger car segment, in particular, is a major volume driver due to its widespread adoption of ADAS features. The market's trajectory is also influenced by the increasing complexity of vehicle designs and the need for compact, power-efficient sensor solutions.
Dominant Regions, Countries, or Segments in IMS Image Sensor
The Passenger Car segment, within the Application category, is a dominant force driving growth in the global IMS image sensor market. This dominance is attributed to several interconnected factors, including high production volumes, a strong consumer demand for advanced safety and comfort features, and increasingly stringent safety regulations being implemented across major automotive markets. The increasing penetration of ADAS technologies, ranging from basic parking assist systems to sophisticated semi-autonomous driving capabilities, directly translates into a higher demand for image sensors. Countries like China, the United States, and major European nations are at the forefront of this trend, with their respective automotive industries heavily investing in and adopting advanced imaging solutions.
- Dominant Segment: Passenger Car (Application).
- Key Drivers for Dominance:
- High global production volumes of passenger vehicles.
- Strong consumer demand for safety and convenience features (ADAS).
- Governmental regulations and safety mandates promoting advanced driver assistance.
- Technological advancements in ADAS and infotainment systems requiring sophisticated imaging.
- Increasing adoption of higher resolution (>3MP) sensors for enhanced perception.
- Market Share within Passenger Cars: The >3MP sensor type is expected to capture a significant market share, driven by the needs of advanced ADAS and autonomous driving. Estimated market share for >3MP in Passenger Cars is projected to be around XX% by 2025, growing to XX% by 2033.
- Regional Dominance: Asia-Pacific, particularly China, is a leading region due to its massive automotive manufacturing base and rapid adoption of new vehicle technologies. North America and Europe also exhibit strong growth due to established automotive markets and proactive regulatory environments.
- Growth Potential: The passenger car segment offers substantial growth potential, with continuous innovation in ADAS features and the eventual widespread adoption of Level 4 and Level 5 autonomous driving systems.
IMS Image Sensor Product Landscape
The IMS image sensor product landscape is witnessing remarkable innovation, focusing on enhanced resolution, superior low-light performance, and integrated functionalities. Products are increasingly designed with stacked CMOS architectures for faster data transfer and reduced power consumption. Advanced features like in-pixel electronic rolling shutter (ERS) and high dynamic range (HDR) imaging are becoming standard, crucial for capturing clear images in challenging lighting conditions, from bright sunlight to dark nights. The trend towards miniaturization and increased thermal management efficiency is also prominent, enabling seamless integration into compact automotive components. Unique selling propositions revolve around improved object detection accuracy, enhanced lane departure warning capabilities, and superior performance in adverse weather conditions. Technological advancements are also leading to sensors with built-in AI accelerators for edge processing, reducing latency and freeing up computational resources.
Key Drivers, Barriers & Challenges in IMS Image Sensor
Key Drivers: The IMS image sensor market is propelled by several key drivers. The escalating demand for Advanced Driver-Assistance Systems (ADAS) and the ongoing transition towards autonomous driving are paramount, requiring sophisticated visual perception capabilities. Stringent automotive safety regulations globally, mandating features like automatic emergency braking and lane keeping assist, directly boost image sensor adoption. Technological advancements in sensor technology, including higher resolutions, improved low-light sensitivity, and HDR capabilities, are enabling new applications and enhancing performance. Consumer preference for enhanced vehicle safety and a more comfortable driving experience also plays a significant role.
Barriers & Challenges: Despite robust growth, the market faces significant barriers and challenges. The high cost of research and development for cutting-edge sensor technologies and their integration into automotive systems remains a considerable hurdle. Rigorous automotive-grade validation and certification processes demand substantial time and investment. Supply chain disruptions, particularly for specialized semiconductor components, can lead to production delays and increased costs. Intense competition among established players and emerging technologies necessitates continuous innovation and price optimization. Evolving cybersecurity threats also pose a challenge, requiring robust security measures within image sensing systems.
Emerging Opportunities in IMS Image Sensor
Emerging opportunities in the IMS image sensor sector are primarily driven by the burgeoning demand for in-cabin monitoring systems, aimed at enhancing driver alertness and passenger safety. The expansion of vehicle connectivity and the integration of smart features are creating new avenues for image sensors in applications like driver identification and gesture control. Furthermore, the development of specialized sensors for advanced sensor fusion architectures, combining data from multiple sensor types to create a more comprehensive environmental understanding, presents a significant growth area. The increasing adoption of image sensors in commercial vehicle fleets for safety, security, and operational efficiency also represents an untapped market with substantial potential.
Growth Accelerators in the IMS Image Sensor Industry
Several catalysts are accelerating the growth of the IMS image sensor industry. Continued breakthroughs in semiconductor manufacturing processes are enabling the production of smaller, more powerful, and cost-effective sensors. Strategic partnerships between sensor manufacturers and automotive OEMs are crucial for co-developing tailored solutions and ensuring seamless integration. The expansion of the autonomous driving ecosystem, including advancements in AI algorithms and vehicle-to-everything (V2X) communication, will further necessitate higher-performing image sensors. Market expansion into emerging economies with growing automotive production and increasing adoption of advanced safety features will also contribute significantly to long-term growth.
Key Players Shaping the IMS Image Sensor Market
- Onsemi
- OMNIVISION
- STMicroelectronics
- Ams Osram
- Sony
- Himax Technologies
- Toshiba
Notable Milestones in IMS Image Sensor Sector
- 2019: Introduction of automotive-grade 8MP image sensors for enhanced ADAS capabilities.
- 2020: Significant advancements in stacked CMOS sensor technology, enabling faster readout speeds.
- 2021: Increased focus on AI-powered image processing chips integrated with image sensors.
- 2022: Development of advanced in-cabin monitoring systems utilizing high-resolution image sensors.
- 2023: Enhanced low-light performance breakthroughs, critical for nighttime ADAS functionality.
- 2024: Growing interest in event-based sensors for real-time motion detection in automotive applications.
In-Depth IMS Image Sensor Market Outlook
The IMS image sensor market outlook is exceptionally strong, driven by the unstoppable march towards safer and more autonomous vehicles. Growth accelerators such as continuous technological innovation, strategic collaborations, and expanding market penetration in both developed and emerging automotive economies will continue to fuel demand. The increasing complexity of automotive perception systems and the growing integration of AI at the edge will create sustained opportunities for advanced image sensor solutions. Stakeholders can anticipate a dynamic market landscape characterized by rapid product evolution and significant strategic investments in the coming years.
IMS Image Sensor Segmentation
-
1. Application
- 1.1. Passenger Car
- 1.2. Commercial Car
-
2. Types
- 2.1. 1-2MP
- 2.2. 2-3MP
- 2.3. >3MP
- 2.4. Others
IMS Image Sensor Segmentation By Geography
-
1. North America
- 1.1. United States
- 1.2. Canada
- 1.3. Mexico
-
2. South America
- 2.1. Brazil
- 2.2. Argentina
- 2.3. Rest of South America
-
3. Europe
- 3.1. United Kingdom
- 3.2. Germany
- 3.3. France
- 3.4. Italy
- 3.5. Spain
- 3.6. Russia
- 3.7. Benelux
- 3.8. Nordics
- 3.9. Rest of Europe
-
4. Middle East & Africa
- 4.1. Turkey
- 4.2. Israel
- 4.3. GCC
- 4.4. North Africa
- 4.5. South Africa
- 4.6. Rest of Middle East & Africa
-
5. Asia Pacific
- 5.1. China
- 5.2. India
- 5.3. Japan
- 5.4. South Korea
- 5.5. ASEAN
- 5.6. Oceania
- 5.7. Rest of Asia Pacific
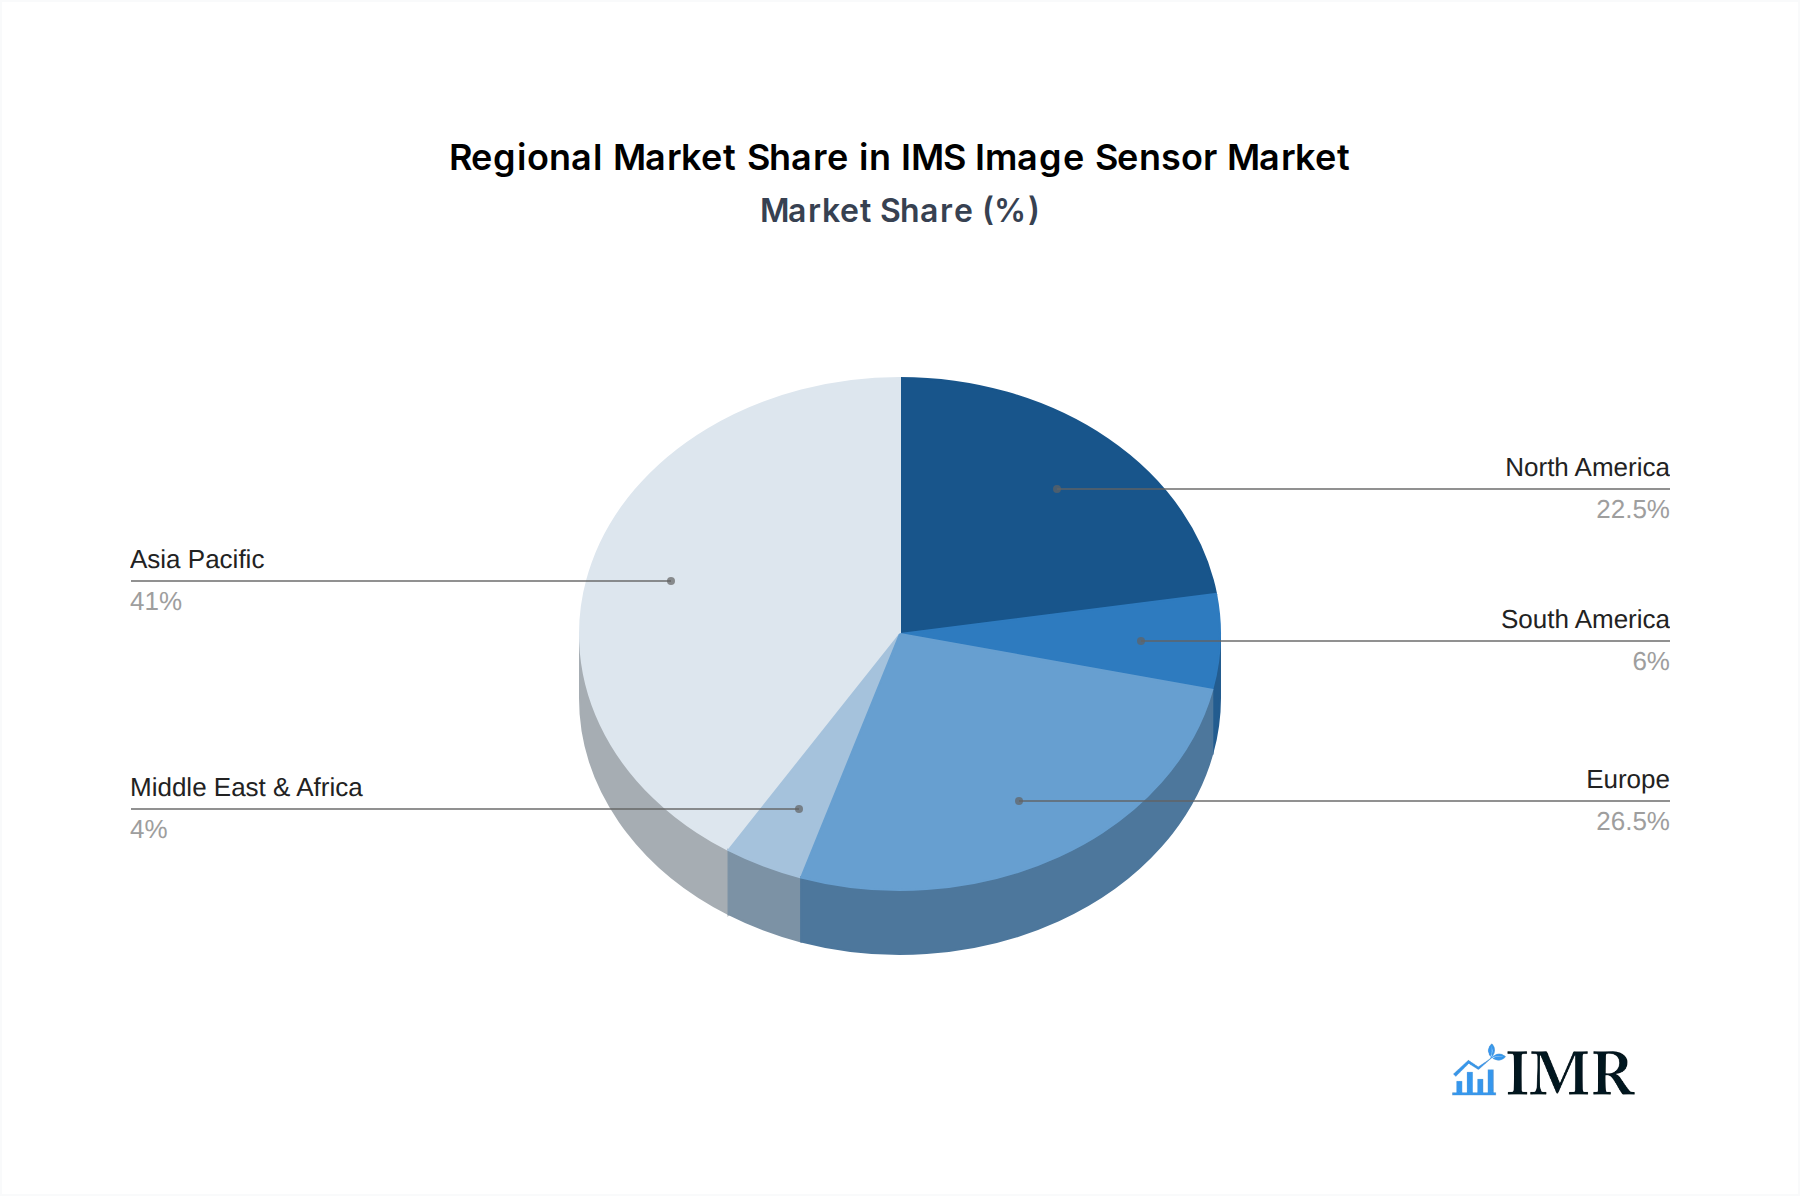
IMS Image Sensor Regional Market Share
Geographic Coverage of IMS Image Sensor
IMS Image Sensor REPORT HIGHLIGHTS
| Aspects | Details |
|---|---|
| Study Period | 2020-2034 |
| Base Year | 2025 |
| Estimated Year | 2026 |
| Forecast Period | 2026-2034 |
| Historical Period | 2020-2025 |
| Growth Rate | CAGR of 9.17% from 2020-2034 |
| Segmentation |
|
Table of Contents
- 1. Introduction
- 1.1. Research Scope
- 1.2. Market Segmentation
- 1.3. Research Objective
- 1.4. Definitions and Assumptions
- 2. Executive Summary
- 2.1. Market Snapshot
- 3. Market Dynamics
- 3.1. Market Drivers
- 3.2. Market Restrains
- 3.3. Market Trends
- 3.4. Market Opportunities
- 4. Market Factor Analysis
- 4.1. Porters Five Forces
- 4.1.1. Bargaining Power of Suppliers
- 4.1.2. Bargaining Power of Buyers
- 4.1.3. Threat of New Entrants
- 4.1.4. Threat of Substitutes
- 4.1.5. Competitive Rivalry
- 4.2. PESTEL analysis
- 4.3. BCG Analysis
- 4.3.1. Stars (High Growth, High Market Share)
- 4.3.2. Cash Cows (Low Growth, High Market Share)
- 4.3.3. Question Mark (High Growth, Low Market Share)
- 4.3.4. Dogs (Low Growth, Low Market Share)
- 4.4. Ansoff Matrix Analysis
- 4.5. Supply Chain Analysis
- 4.6. Regulatory Landscape
- 4.7. Current Market Potential and Opportunity Assessment (TAM–SAM–SOM Framework)
- 4.8. IMR Analyst Note
- 4.1. Porters Five Forces
- 5. Market Analysis, Insights and Forecast 2021-2033
- 5.1. Market Analysis, Insights and Forecast - by Application
- 5.1.1. Passenger Car
- 5.1.2. Commercial Car
- 5.2. Market Analysis, Insights and Forecast - by Types
- 5.2.1. 1-2MP
- 5.2.2. 2-3MP
- 5.2.3. >3MP
- 5.2.4. Others
- 5.3. Market Analysis, Insights and Forecast - by Region
- 5.3.1. North America
- 5.3.2. South America
- 5.3.3. Europe
- 5.3.4. Middle East & Africa
- 5.3.5. Asia Pacific
- 5.1. Market Analysis, Insights and Forecast - by Application
- 6. Global IMS Image Sensor Analysis, Insights and Forecast, 2021-2033
- 6.1. Market Analysis, Insights and Forecast - by Application
- 6.1.1. Passenger Car
- 6.1.2. Commercial Car
- 6.2. Market Analysis, Insights and Forecast - by Types
- 6.2.1. 1-2MP
- 6.2.2. 2-3MP
- 6.2.3. >3MP
- 6.2.4. Others
- 6.1. Market Analysis, Insights and Forecast - by Application
- 7. North America IMS Image Sensor Analysis, Insights and Forecast, 2020-2032
- 7.1. Market Analysis, Insights and Forecast - by Application
- 7.1.1. Passenger Car
- 7.1.2. Commercial Car
- 7.2. Market Analysis, Insights and Forecast - by Types
- 7.2.1. 1-2MP
- 7.2.2. 2-3MP
- 7.2.3. >3MP
- 7.2.4. Others
- 7.1. Market Analysis, Insights and Forecast - by Application
- 8. South America IMS Image Sensor Analysis, Insights and Forecast, 2020-2032
- 8.1. Market Analysis, Insights and Forecast - by Application
- 8.1.1. Passenger Car
- 8.1.2. Commercial Car
- 8.2. Market Analysis, Insights and Forecast - by Types
- 8.2.1. 1-2MP
- 8.2.2. 2-3MP
- 8.2.3. >3MP
- 8.2.4. Others
- 8.1. Market Analysis, Insights and Forecast - by Application
- 9. Europe IMS Image Sensor Analysis, Insights and Forecast, 2020-2032
- 9.1. Market Analysis, Insights and Forecast - by Application
- 9.1.1. Passenger Car
- 9.1.2. Commercial Car
- 9.2. Market Analysis, Insights and Forecast - by Types
- 9.2.1. 1-2MP
- 9.2.2. 2-3MP
- 9.2.3. >3MP
- 9.2.4. Others
- 9.1. Market Analysis, Insights and Forecast - by Application
- 10. Middle East & Africa IMS Image Sensor Analysis, Insights and Forecast, 2020-2032
- 10.1. Market Analysis, Insights and Forecast - by Application
- 10.1.1. Passenger Car
- 10.1.2. Commercial Car
- 10.2. Market Analysis, Insights and Forecast - by Types
- 10.2.1. 1-2MP
- 10.2.2. 2-3MP
- 10.2.3. >3MP
- 10.2.4. Others
- 10.1. Market Analysis, Insights and Forecast - by Application
- 11. Asia Pacific IMS Image Sensor Analysis, Insights and Forecast, 2020-2032
- 11.1. Market Analysis, Insights and Forecast - by Application
- 11.1.1. Passenger Car
- 11.1.2. Commercial Car
- 11.2. Market Analysis, Insights and Forecast - by Types
- 11.2.1. 1-2MP
- 11.2.2. 2-3MP
- 11.2.3. >3MP
- 11.2.4. Others
- 11.1. Market Analysis, Insights and Forecast - by Application
- 12. Competitive Analysis
- 12.1. Company Profiles
- 12.1.1 Onsemi
- 12.1.1.1. Company Overview
- 12.1.1.2. Products
- 12.1.1.3. Company Financials
- 12.1.1.4. SWOT Analysis
- 12.1.2 OMNIVISION
- 12.1.2.1. Company Overview
- 12.1.2.2. Products
- 12.1.2.3. Company Financials
- 12.1.2.4. SWOT Analysis
- 12.1.3 STMicroelectronics
- 12.1.3.1. Company Overview
- 12.1.3.2. Products
- 12.1.3.3. Company Financials
- 12.1.3.4. SWOT Analysis
- 12.1.4 Ams Osram
- 12.1.4.1. Company Overview
- 12.1.4.2. Products
- 12.1.4.3. Company Financials
- 12.1.4.4. SWOT Analysis
- 12.1.5 Sony
- 12.1.5.1. Company Overview
- 12.1.5.2. Products
- 12.1.5.3. Company Financials
- 12.1.5.4. SWOT Analysis
- 12.1.6 Himax Technologies
- 12.1.6.1. Company Overview
- 12.1.6.2. Products
- 12.1.6.3. Company Financials
- 12.1.6.4. SWOT Analysis
- 12.1.7 Toshiba
- 12.1.7.1. Company Overview
- 12.1.7.2. Products
- 12.1.7.3. Company Financials
- 12.1.7.4. SWOT Analysis
- 12.1.1 Onsemi
- 12.2. Market Entropy
- 12.2.1 Company's Key Areas Served
- 12.2.2 Recent Developments
- 12.3. Company Market Share Analysis 2025
- 12.3.1 Top 5 Companies Market Share Analysis
- 12.3.2 Top 3 Companies Market Share Analysis
- 12.4. List of Potential Customers
- 13. Research Methodology
List of Figures
- Figure 1: Global IMS Image Sensor Revenue Breakdown (undefined, %) by Region 2025 & 2033
- Figure 2: Global IMS Image Sensor Volume Breakdown (K, %) by Region 2025 & 2033
- Figure 3: North America IMS Image Sensor Revenue (undefined), by Application 2025 & 2033
- Figure 4: North America IMS Image Sensor Volume (K), by Application 2025 & 2033
- Figure 5: North America IMS Image Sensor Revenue Share (%), by Application 2025 & 2033
- Figure 6: North America IMS Image Sensor Volume Share (%), by Application 2025 & 2033
- Figure 7: North America IMS Image Sensor Revenue (undefined), by Types 2025 & 2033
- Figure 8: North America IMS Image Sensor Volume (K), by Types 2025 & 2033
- Figure 9: North America IMS Image Sensor Revenue Share (%), by Types 2025 & 2033
- Figure 10: North America IMS Image Sensor Volume Share (%), by Types 2025 & 2033
- Figure 11: North America IMS Image Sensor Revenue (undefined), by Country 2025 & 2033
- Figure 12: North America IMS Image Sensor Volume (K), by Country 2025 & 2033
- Figure 13: North America IMS Image Sensor Revenue Share (%), by Country 2025 & 2033
- Figure 14: North America IMS Image Sensor Volume Share (%), by Country 2025 & 2033
- Figure 15: South America IMS Image Sensor Revenue (undefined), by Application 2025 & 2033
- Figure 16: South America IMS Image Sensor Volume (K), by Application 2025 & 2033
- Figure 17: South America IMS Image Sensor Revenue Share (%), by Application 2025 & 2033
- Figure 18: South America IMS Image Sensor Volume Share (%), by Application 2025 & 2033
- Figure 19: South America IMS Image Sensor Revenue (undefined), by Types 2025 & 2033
- Figure 20: South America IMS Image Sensor Volume (K), by Types 2025 & 2033
- Figure 21: South America IMS Image Sensor Revenue Share (%), by Types 2025 & 2033
- Figure 22: South America IMS Image Sensor Volume Share (%), by Types 2025 & 2033
- Figure 23: South America IMS Image Sensor Revenue (undefined), by Country 2025 & 2033
- Figure 24: South America IMS Image Sensor Volume (K), by Country 2025 & 2033
- Figure 25: South America IMS Image Sensor Revenue Share (%), by Country 2025 & 2033
- Figure 26: South America IMS Image Sensor Volume Share (%), by Country 2025 & 2033
- Figure 27: Europe IMS Image Sensor Revenue (undefined), by Application 2025 & 2033
- Figure 28: Europe IMS Image Sensor Volume (K), by Application 2025 & 2033
- Figure 29: Europe IMS Image Sensor Revenue Share (%), by Application 2025 & 2033
- Figure 30: Europe IMS Image Sensor Volume Share (%), by Application 2025 & 2033
- Figure 31: Europe IMS Image Sensor Revenue (undefined), by Types 2025 & 2033
- Figure 32: Europe IMS Image Sensor Volume (K), by Types 2025 & 2033
- Figure 33: Europe IMS Image Sensor Revenue Share (%), by Types 2025 & 2033
- Figure 34: Europe IMS Image Sensor Volume Share (%), by Types 2025 & 2033
- Figure 35: Europe IMS Image Sensor Revenue (undefined), by Country 2025 & 2033
- Figure 36: Europe IMS Image Sensor Volume (K), by Country 2025 & 2033
- Figure 37: Europe IMS Image Sensor Revenue Share (%), by Country 2025 & 2033
- Figure 38: Europe IMS Image Sensor Volume Share (%), by Country 2025 & 2033
- Figure 39: Middle East & Africa IMS Image Sensor Revenue (undefined), by Application 2025 & 2033
- Figure 40: Middle East & Africa IMS Image Sensor Volume (K), by Application 2025 & 2033
- Figure 41: Middle East & Africa IMS Image Sensor Revenue Share (%), by Application 2025 & 2033
- Figure 42: Middle East & Africa IMS Image Sensor Volume Share (%), by Application 2025 & 2033
- Figure 43: Middle East & Africa IMS Image Sensor Revenue (undefined), by Types 2025 & 2033
- Figure 44: Middle East & Africa IMS Image Sensor Volume (K), by Types 2025 & 2033
- Figure 45: Middle East & Africa IMS Image Sensor Revenue Share (%), by Types 2025 & 2033
- Figure 46: Middle East & Africa IMS Image Sensor Volume Share (%), by Types 2025 & 2033
- Figure 47: Middle East & Africa IMS Image Sensor Revenue (undefined), by Country 2025 & 2033
- Figure 48: Middle East & Africa IMS Image Sensor Volume (K), by Country 2025 & 2033
- Figure 49: Middle East & Africa IMS Image Sensor Revenue Share (%), by Country 2025 & 2033
- Figure 50: Middle East & Africa IMS Image Sensor Volume Share (%), by Country 2025 & 2033
- Figure 51: Asia Pacific IMS Image Sensor Revenue (undefined), by Application 2025 & 2033
- Figure 52: Asia Pacific IMS Image Sensor Volume (K), by Application 2025 & 2033
- Figure 53: Asia Pacific IMS Image Sensor Revenue Share (%), by Application 2025 & 2033
- Figure 54: Asia Pacific IMS Image Sensor Volume Share (%), by Application 2025 & 2033
- Figure 55: Asia Pacific IMS Image Sensor Revenue (undefined), by Types 2025 & 2033
- Figure 56: Asia Pacific IMS Image Sensor Volume (K), by Types 2025 & 2033
- Figure 57: Asia Pacific IMS Image Sensor Revenue Share (%), by Types 2025 & 2033
- Figure 58: Asia Pacific IMS Image Sensor Volume Share (%), by Types 2025 & 2033
- Figure 59: Asia Pacific IMS Image Sensor Revenue (undefined), by Country 2025 & 2033
- Figure 60: Asia Pacific IMS Image Sensor Volume (K), by Country 2025 & 2033
- Figure 61: Asia Pacific IMS Image Sensor Revenue Share (%), by Country 2025 & 2033
- Figure 62: Asia Pacific IMS Image Sensor Volume Share (%), by Country 2025 & 2033
List of Tables
- Table 1: Global IMS Image Sensor Revenue undefined Forecast, by Application 2020 & 2033
- Table 2: Global IMS Image Sensor Volume K Forecast, by Application 2020 & 2033
- Table 3: Global IMS Image Sensor Revenue undefined Forecast, by Types 2020 & 2033
- Table 4: Global IMS Image Sensor Volume K Forecast, by Types 2020 & 2033
- Table 5: Global IMS Image Sensor Revenue undefined Forecast, by Region 2020 & 2033
- Table 6: Global IMS Image Sensor Volume K Forecast, by Region 2020 & 2033
- Table 7: Global IMS Image Sensor Revenue undefined Forecast, by Application 2020 & 2033
- Table 8: Global IMS Image Sensor Volume K Forecast, by Application 2020 & 2033
- Table 9: Global IMS Image Sensor Revenue undefined Forecast, by Types 2020 & 2033
- Table 10: Global IMS Image Sensor Volume K Forecast, by Types 2020 & 2033
- Table 11: Global IMS Image Sensor Revenue undefined Forecast, by Country 2020 & 2033
- Table 12: Global IMS Image Sensor Volume K Forecast, by Country 2020 & 2033
- Table 13: United States IMS Image Sensor Revenue (undefined) Forecast, by Application 2020 & 2033
- Table 14: United States IMS Image Sensor Volume (K) Forecast, by Application 2020 & 2033
- Table 15: Canada IMS Image Sensor Revenue (undefined) Forecast, by Application 2020 & 2033
- Table 16: Canada IMS Image Sensor Volume (K) Forecast, by Application 2020 & 2033
- Table 17: Mexico IMS Image Sensor Revenue (undefined) Forecast, by Application 2020 & 2033
- Table 18: Mexico IMS Image Sensor Volume (K) Forecast, by Application 2020 & 2033
- Table 19: Global IMS Image Sensor Revenue undefined Forecast, by Application 2020 & 2033
- Table 20: Global IMS Image Sensor Volume K Forecast, by Application 2020 & 2033
- Table 21: Global IMS Image Sensor Revenue undefined Forecast, by Types 2020 & 2033
- Table 22: Global IMS Image Sensor Volume K Forecast, by Types 2020 & 2033
- Table 23: Global IMS Image Sensor Revenue undefined Forecast, by Country 2020 & 2033
- Table 24: Global IMS Image Sensor Volume K Forecast, by Country 2020 & 2033
- Table 25: Brazil IMS Image Sensor Revenue (undefined) Forecast, by Application 2020 & 2033
- Table 26: Brazil IMS Image Sensor Volume (K) Forecast, by Application 2020 & 2033
- Table 27: Argentina IMS Image Sensor Revenue (undefined) Forecast, by Application 2020 & 2033
- Table 28: Argentina IMS Image Sensor Volume (K) Forecast, by Application 2020 & 2033
- Table 29: Rest of South America IMS Image Sensor Revenue (undefined) Forecast, by Application 2020 & 2033
- Table 30: Rest of South America IMS Image Sensor Volume (K) Forecast, by Application 2020 & 2033
- Table 31: Global IMS Image Sensor Revenue undefined Forecast, by Application 2020 & 2033
- Table 32: Global IMS Image Sensor Volume K Forecast, by Application 2020 & 2033
- Table 33: Global IMS Image Sensor Revenue undefined Forecast, by Types 2020 & 2033
- Table 34: Global IMS Image Sensor Volume K Forecast, by Types 2020 & 2033
- Table 35: Global IMS Image Sensor Revenue undefined Forecast, by Country 2020 & 2033
- Table 36: Global IMS Image Sensor Volume K Forecast, by Country 2020 & 2033
- Table 37: United Kingdom IMS Image Sensor Revenue (undefined) Forecast, by Application 2020 & 2033
- Table 38: United Kingdom IMS Image Sensor Volume (K) Forecast, by Application 2020 & 2033
- Table 39: Germany IMS Image Sensor Revenue (undefined) Forecast, by Application 2020 & 2033
- Table 40: Germany IMS Image Sensor Volume (K) Forecast, by Application 2020 & 2033
- Table 41: France IMS Image Sensor Revenue (undefined) Forecast, by Application 2020 & 2033
- Table 42: France IMS Image Sensor Volume (K) Forecast, by Application 2020 & 2033
- Table 43: Italy IMS Image Sensor Revenue (undefined) Forecast, by Application 2020 & 2033
- Table 44: Italy IMS Image Sensor Volume (K) Forecast, by Application 2020 & 2033
- Table 45: Spain IMS Image Sensor Revenue (undefined) Forecast, by Application 2020 & 2033
- Table 46: Spain IMS Image Sensor Volume (K) Forecast, by Application 2020 & 2033
- Table 47: Russia IMS Image Sensor Revenue (undefined) Forecast, by Application 2020 & 2033
- Table 48: Russia IMS Image Sensor Volume (K) Forecast, by Application 2020 & 2033
- Table 49: Benelux IMS Image Sensor Revenue (undefined) Forecast, by Application 2020 & 2033
- Table 50: Benelux IMS Image Sensor Volume (K) Forecast, by Application 2020 & 2033
- Table 51: Nordics IMS Image Sensor Revenue (undefined) Forecast, by Application 2020 & 2033
- Table 52: Nordics IMS Image Sensor Volume (K) Forecast, by Application 2020 & 2033
- Table 53: Rest of Europe IMS Image Sensor Revenue (undefined) Forecast, by Application 2020 & 2033
- Table 54: Rest of Europe IMS Image Sensor Volume (K) Forecast, by Application 2020 & 2033
- Table 55: Global IMS Image Sensor Revenue undefined Forecast, by Application 2020 & 2033
- Table 56: Global IMS Image Sensor Volume K Forecast, by Application 2020 & 2033
- Table 57: Global IMS Image Sensor Revenue undefined Forecast, by Types 2020 & 2033
- Table 58: Global IMS Image Sensor Volume K Forecast, by Types 2020 & 2033
- Table 59: Global IMS Image Sensor Revenue undefined Forecast, by Country 2020 & 2033
- Table 60: Global IMS Image Sensor Volume K Forecast, by Country 2020 & 2033
- Table 61: Turkey IMS Image Sensor Revenue (undefined) Forecast, by Application 2020 & 2033
- Table 62: Turkey IMS Image Sensor Volume (K) Forecast, by Application 2020 & 2033
- Table 63: Israel IMS Image Sensor Revenue (undefined) Forecast, by Application 2020 & 2033
- Table 64: Israel IMS Image Sensor Volume (K) Forecast, by Application 2020 & 2033
- Table 65: GCC IMS Image Sensor Revenue (undefined) Forecast, by Application 2020 & 2033
- Table 66: GCC IMS Image Sensor Volume (K) Forecast, by Application 2020 & 2033
- Table 67: North Africa IMS Image Sensor Revenue (undefined) Forecast, by Application 2020 & 2033
- Table 68: North Africa IMS Image Sensor Volume (K) Forecast, by Application 2020 & 2033
- Table 69: South Africa IMS Image Sensor Revenue (undefined) Forecast, by Application 2020 & 2033
- Table 70: South Africa IMS Image Sensor Volume (K) Forecast, by Application 2020 & 2033
- Table 71: Rest of Middle East & Africa IMS Image Sensor Revenue (undefined) Forecast, by Application 2020 & 2033
- Table 72: Rest of Middle East & Africa IMS Image Sensor Volume (K) Forecast, by Application 2020 & 2033
- Table 73: Global IMS Image Sensor Revenue undefined Forecast, by Application 2020 & 2033
- Table 74: Global IMS Image Sensor Volume K Forecast, by Application 2020 & 2033
- Table 75: Global IMS Image Sensor Revenue undefined Forecast, by Types 2020 & 2033
- Table 76: Global IMS Image Sensor Volume K Forecast, by Types 2020 & 2033
- Table 77: Global IMS Image Sensor Revenue undefined Forecast, by Country 2020 & 2033
- Table 78: Global IMS Image Sensor Volume K Forecast, by Country 2020 & 2033
- Table 79: China IMS Image Sensor Revenue (undefined) Forecast, by Application 2020 & 2033
- Table 80: China IMS Image Sensor Volume (K) Forecast, by Application 2020 & 2033
- Table 81: India IMS Image Sensor Revenue (undefined) Forecast, by Application 2020 & 2033
- Table 82: India IMS Image Sensor Volume (K) Forecast, by Application 2020 & 2033
- Table 83: Japan IMS Image Sensor Revenue (undefined) Forecast, by Application 2020 & 2033
- Table 84: Japan IMS Image Sensor Volume (K) Forecast, by Application 2020 & 2033
- Table 85: South Korea IMS Image Sensor Revenue (undefined) Forecast, by Application 2020 & 2033
- Table 86: South Korea IMS Image Sensor Volume (K) Forecast, by Application 2020 & 2033
- Table 87: ASEAN IMS Image Sensor Revenue (undefined) Forecast, by Application 2020 & 2033
- Table 88: ASEAN IMS Image Sensor Volume (K) Forecast, by Application 2020 & 2033
- Table 89: Oceania IMS Image Sensor Revenue (undefined) Forecast, by Application 2020 & 2033
- Table 90: Oceania IMS Image Sensor Volume (K) Forecast, by Application 2020 & 2033
- Table 91: Rest of Asia Pacific IMS Image Sensor Revenue (undefined) Forecast, by Application 2020 & 2033
- Table 92: Rest of Asia Pacific IMS Image Sensor Volume (K) Forecast, by Application 2020 & 2033
Frequently Asked Questions
1. What is the projected Compound Annual Growth Rate (CAGR) of the IMS Image Sensor?
The projected CAGR is approximately 9.17%.
2. Which companies are prominent players in the IMS Image Sensor?
Key companies in the market include Onsemi, OMNIVISION, STMicroelectronics, Ams Osram, Sony, Himax Technologies, Toshiba.
3. What are the main segments of the IMS Image Sensor?
The market segments include Application, Types.
4. Can you provide details about the market size?
The market size is estimated to be USD XXX N/A as of 2022.
5. What are some drivers contributing to market growth?
N/A
6. What are the notable trends driving market growth?
N/A
7. Are there any restraints impacting market growth?
N/A
8. Can you provide examples of recent developments in the market?
N/A
9. What pricing options are available for accessing the report?
Pricing options include single-user, multi-user, and enterprise licenses priced at USD 4350.00, USD 6525.00, and USD 8700.00 respectively.
10. Is the market size provided in terms of value or volume?
The market size is provided in terms of value, measured in N/A and volume, measured in K.
11. Are there any specific market keywords associated with the report?
Yes, the market keyword associated with the report is "IMS Image Sensor," which aids in identifying and referencing the specific market segment covered.
12. How do I determine which pricing option suits my needs best?
The pricing options vary based on user requirements and access needs. Individual users may opt for single-user licenses, while businesses requiring broader access may choose multi-user or enterprise licenses for cost-effective access to the report.
13. Are there any additional resources or data provided in the IMS Image Sensor report?
While the report offers comprehensive insights, it's advisable to review the specific contents or supplementary materials provided to ascertain if additional resources or data are available.
14. How can I stay updated on further developments or reports in the IMS Image Sensor?
To stay informed about further developments, trends, and reports in the IMS Image Sensor, consider subscribing to industry newsletters, following relevant companies and organizations, or regularly checking reputable industry news sources and publications.
Methodology
Step 1 - Identification of Relevant Samples Size from Population Database


Step 2 - Approaches for Defining Global Market Size (Value, Volume* & Price*)

Note*: In applicable scenarios
Step 3 - Data Sources
Primary Research
- Web Analytics
- Survey Reports
- Research Institute
- Latest Research Reports
- Opinion Leaders
Secondary Research
- Annual Reports
- White Paper
- Latest Press Release
- Industry Association
- Paid Database
- Investor Presentations

Step 4 - Data Triangulation
Involves using different sources of information in order to increase the validity of a study
These sources are likely to be stakeholders in a program - participants, other researchers, program staff, other community members, and so on.
Then we put all data in single framework & apply various statistical tools to find out the dynamic on the market.
During the analysis stage, feedback from the stakeholder groups would be compared to determine areas of agreement as well as areas of divergence