

Key Insights
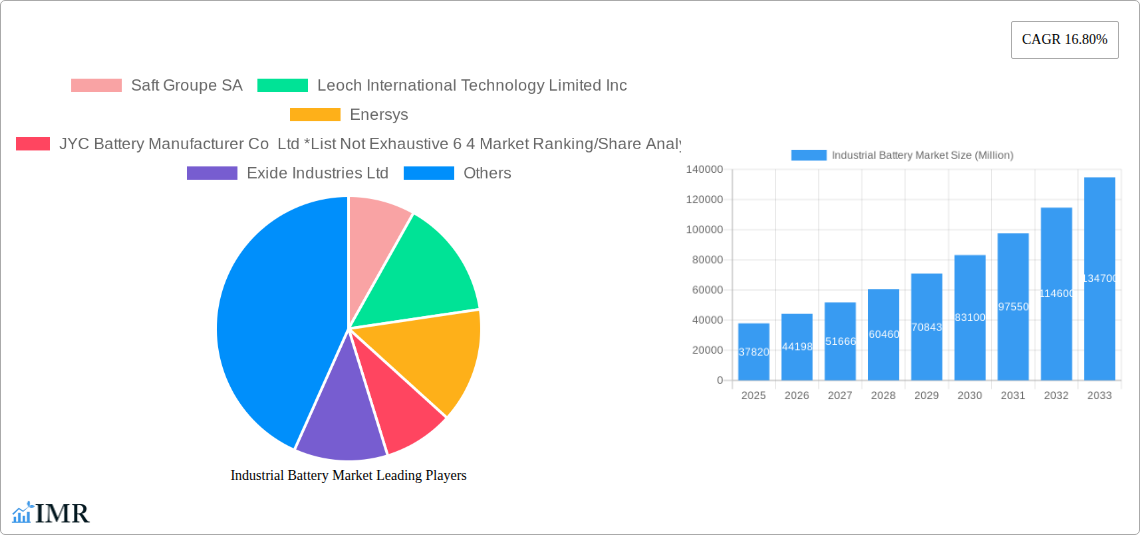
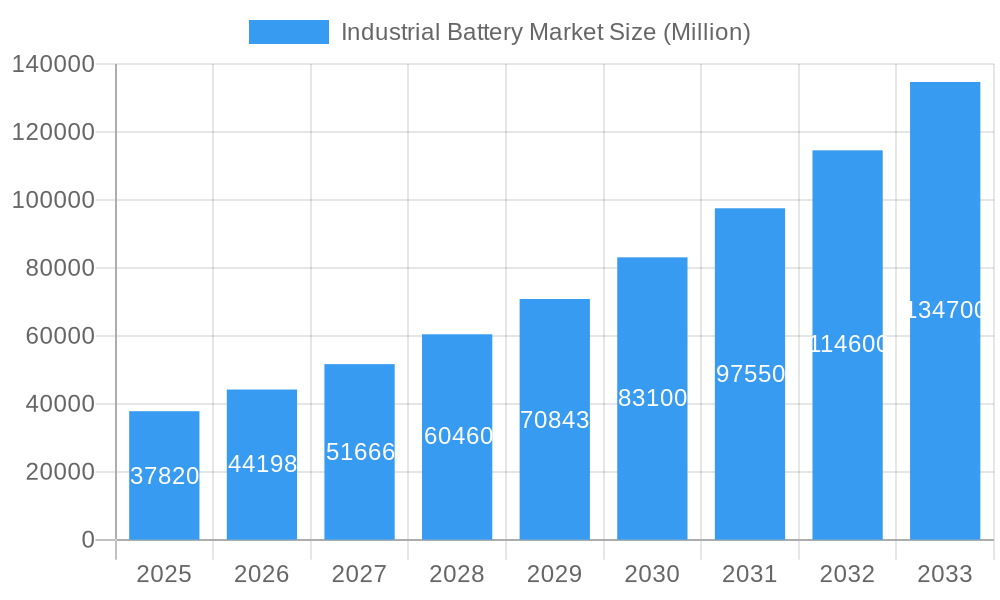
The industrial battery market, valued at $37.82 billion in 2025, is experiencing robust growth, projected to expand at a Compound Annual Growth Rate (CAGR) of 16.80% from 2025 to 2033. This significant expansion is driven by several key factors. The increasing adoption of automation and electrification across various sectors, particularly in manufacturing, power generation (including energy storage systems and uninterruptible power supplies), and the oil and gas industry, fuels demand for reliable and efficient energy storage solutions. Furthermore, the burgeoning renewable energy sector, coupled with growing concerns about carbon emissions, is accelerating the transition towards cleaner energy sources, which heavily rely on advanced industrial batteries. Technological advancements, such as improved lithium-ion battery technology offering higher energy density and longer lifespans, are further bolstering market growth. While the initial cost of implementing these advanced technologies remains a constraint, the long-term cost savings and improved operational efficiency are overcoming this barrier. The market is segmented by end-user industry (power, oil & gas, manufacturing, telecom, others), battery technology (lithium-ion, lead-acid, others), and application (forklifts, telecom, UPS, others). Geographical growth is widespread, with North America and Asia-Pacific expected to lead due to significant industrial activity and supportive government policies promoting clean energy adoption.
Industrial Battery Market Market Size (In Billion)
The competitive landscape is characterized by a mix of established players and emerging companies. Major players like Saft Groupe SA, Leoch International, Enersys, Exide Industries, and GS Yuasa Corporation are leveraging their extensive experience and established distribution networks to maintain market share. However, the market is also witnessing the emergence of innovative companies offering specialized battery solutions and services catering to niche applications. The future growth trajectory will depend heavily on the continued technological advancements in battery technology, the pace of electrification across various industrial sectors, and the ongoing development of robust charging infrastructure to support the wider adoption of electric vehicles and energy storage systems. The market is poised for substantial growth, presenting considerable opportunities for players who can effectively cater to the evolving needs of various industrial sectors.
Industrial Battery Market Company Market Share
This comprehensive report provides a detailed analysis of the Industrial Battery Market, encompassing market dynamics, growth trends, regional dominance, product landscape, key players, and future outlook. The study period covers 2019-2033, with 2025 as the base and estimated year. This report is crucial for industry professionals, investors, and strategic decision-makers seeking a thorough understanding of this rapidly evolving market.
Industrial Battery Market Dynamics & Structure
The industrial battery market is characterized by moderate concentration, with key players like Saft Groupe SA, Leoch International Technology Limited Inc, Enersys, and Exide Industries Ltd holding significant market share. The market size in 2025 is estimated at xx Million units. Technological innovation, particularly in lithium-ion battery technology, is a key driver, while regulatory frameworks concerning battery disposal and environmental impact play a significant role. Lead-acid batteries still dominate the market but are facing increasing competition from lithium-ion due to their superior energy density and lifespan. The market exhibits significant M&A activity, with an estimated xx number of deals in the last 5 years.
- Market Concentration: Moderately concentrated, with top 10 players holding xx% market share in 2025.
- Technological Innovation: Lithium-ion batteries driving growth, while lead-acid batteries maintain a substantial presence. Innovation barriers include high initial investment costs for lithium-ion production and recycling infrastructure limitations.
- Regulatory Framework: Stringent environmental regulations and safety standards impacting battery manufacturing and disposal.
- Competitive Product Substitutes: Fuel cells and other energy storage technologies emerging as potential competitors.
- End-User Demographics: Power sector (including ESS and UPS), oil & gas, manufacturing, and telecom are major end-user segments.
- M&A Trends: xx M&A deals recorded between 2020 and 2024, indicating consolidation within the market.
Industrial Battery Market Growth Trends & Insights
The industrial battery market is experiencing robust growth, driven by increasing demand from various end-user industries. The market size is projected to reach xx Million units by 2033, exhibiting a CAGR of xx% during the forecast period (2025-2033). This growth is fueled by the rising adoption of renewable energy sources, the expanding electric vehicle market (indirectly impacting battery technology advancements), and the growing need for reliable backup power solutions. Technological advancements, like improved energy density and longer lifespans of lithium-ion batteries, are further stimulating market expansion. Consumer behavior is shifting towards more sustainable and efficient energy solutions, leading to increased demand for advanced industrial batteries. Market penetration of lithium-ion batteries is projected to reach xx% by 2033, significantly impacting the overall market dynamics.
Dominant Regions, Countries, or Segments in Industrial Battery Market
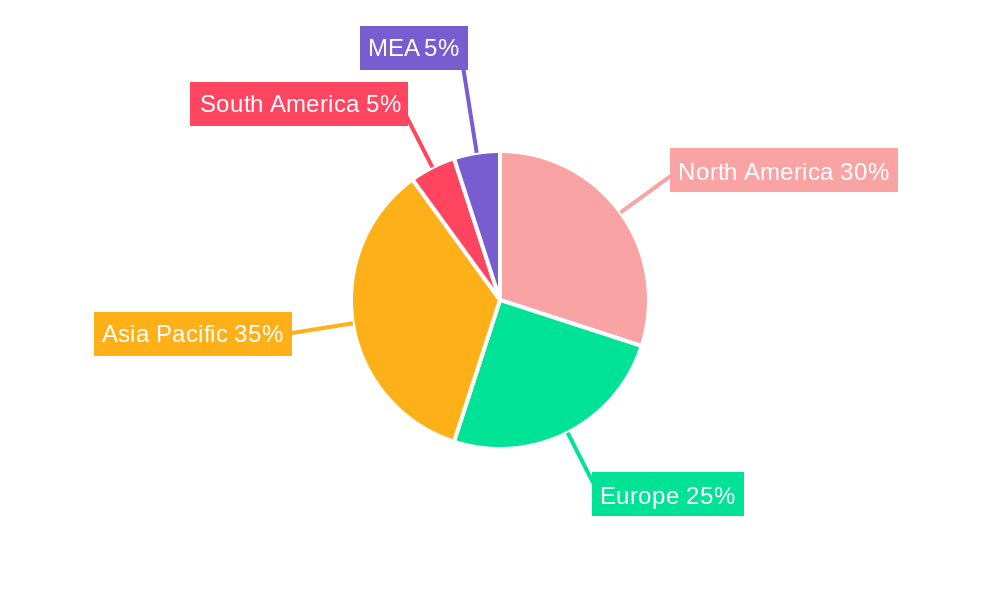
The North American and European regions are currently leading the industrial battery market, driven by stringent environmental regulations, robust industrial sectors, and strong government support for renewable energy initiatives. Within these regions, specific countries like the USA, Germany, and China exhibit high growth potential owing to favorable economic policies and expanding infrastructure. The Power Sector (including ESS and UPS) segment holds the largest market share, followed by the Manufacturing and Oil & Gas sectors.
- Leading Region: North America and Europe
- Key Countries: USA, Germany, China, Japan.
- Dominant Segment (End-User): Power Sector (incl. ESS, UPS, etc.) exhibiting xx% market share in 2025, followed by the Manufacturing and Oil & Gas sectors.
- Dominant Segment (Technology): Lead-acid batteries currently dominate with xx% market share, but lithium-ion batteries are experiencing the fastest growth.
Industrial Battery Market Product Landscape
The industrial battery market features a diverse product landscape encompassing lead-acid, lithium-ion, and other technologies. Lithium-ion batteries offer superior energy density and cycle life, making them increasingly popular for applications requiring high performance. Lead-acid batteries retain a significant market share due to their lower cost and established infrastructure. Continuous innovations focus on improving battery life, safety features, and reducing environmental impact. Unique selling propositions include enhanced performance characteristics, improved safety features, and customized solutions tailored to specific industrial needs.
Key Drivers, Barriers & Challenges in Industrial Battery Market
Key Drivers:
- Rising demand for renewable energy storage solutions.
- Growth of the electric vehicle market.
- Increasing adoption of automation and robotics in manufacturing.
- Stringent environmental regulations promoting cleaner energy alternatives.
Key Challenges:
- High initial investment costs for advanced battery technologies.
- Concerns regarding battery safety and lifespan.
- Lack of robust recycling infrastructure for spent batteries.
- Intense competition among existing and emerging players, potentially impacting profitability. Competition is expected to reduce profit margins by an estimated xx% by 2033.
Emerging Opportunities in Industrial Battery Market
- Untapped markets in developing economies with growing industrialization.
- Growing demand for grid-scale energy storage systems.
- Expansion of the electric vehicle and hybrid vehicle markets.
- Development of innovative battery technologies with improved performance and sustainability.
Growth Accelerators in the Industrial Battery Market Industry
Technological breakthroughs in battery chemistry and design are significant growth catalysts, particularly the development of solid-state batteries and improved energy density. Strategic partnerships between battery manufacturers, energy providers, and technology companies are accelerating market expansion and driving innovation. Government incentives and supportive policies in key regions are fostering market growth.
Key Players Shaping the Industrial Battery Market Market
- Saft Groupe SA
- Leoch International Technology Limited Inc
- Enersys
- JYC Battery Manufacturer Co Ltd
- Exide Industries Ltd
- East Penn Manufacturing Company Inc
- GS Yuasa Corporation
- C&D Technologies Pvt Ltd
- Amar Raja batteries Ltd
- Panasonic Corporation
Notable Milestones in Industrial Battery Market Sector
- January 2023: ONGC Tripura Power Company and APDCL signed a USD 245 million agreement for a 250MW/500MWh BESS project in Assam.
- October 2022: EnerSys expanded its presence in the Middle Tennessee Territory by granting exclusive sales and service rights for its motive power products.
In-Depth Industrial Battery Market Market Outlook
The industrial battery market holds substantial future potential, driven by ongoing technological advancements, increasing demand from diverse industries, and supportive government policies. Strategic partnerships and investments in research and development will shape the future landscape. The market is expected to witness continued growth, with significant opportunities for innovation and expansion in both established and emerging markets. Focus on sustainability and circular economy principles will be crucial for long-term success in this sector.
Industrial Battery Market Segmentation
-
1. Technology
- 1.1. Lithium-ion Battery
- 1.2. Lead-acid Battery
- 1.3. Other Te
-
2. Application
- 2.1. Forklift
- 2.2. Telecom
- 2.3. UPS
- 2.4. Other Applications
-
3. End-User Industry
- 3.1. Power Sector (incl. ESS, UPS, etc.)
- 3.2. Oil & Gas Sector
- 3.3. Manufacturing Sector
- 3.4. Telecom
- 3.5. Other End-User Industries
Industrial Battery Market Segmentation By Geography
-
1. North America
- 1.1. United States
- 1.2. Canada
- 1.3. Rest of North America
-
2. Europe
- 2.1. Germany
- 2.2. France
- 2.3. United Kingdom
- 2.4. Italy
- 2.5. Spain
- 2.6. Nordic Countries
- 2.7. Turkey
- 2.8. Russia
- 2.9. Rest of Europe
-
3. Asia Pacific
- 3.1. China
- 3.2. Japan
- 3.3. India
- 3.4. Australia
- 3.5. Malaysis
- 3.6. Indonesia
- 3.7. Thailand
- 3.8. Vietnam
- 3.9. Rest of Asia Pacific
-
4. South America
- 4.1. Brazil
- 4.2. Argentina
- 4.3. Chile
- 4.4. Colombia
- 4.5. Rest of South America
-
5. Middle East and Africa
- 5.1. United Arab Emirates
- 5.2. Saudi Arabia
- 5.3. Qatar
- 5.4. South Africa
- 5.5. Nigeria
- 5.6. Egypt
- 5.7. Rest of Middle East and Africa
Industrial Battery Market Regional Market Share
Geographic Coverage of Industrial Battery Market
Industrial Battery Market REPORT HIGHLIGHTS
| Aspects | Details |
|---|---|
| Study Period | 2020-2034 |
| Base Year | 2025 |
| Estimated Year | 2026 |
| Forecast Period | 2026-2034 |
| Historical Period | 2020-2025 |
| Growth Rate | CAGR of 16.80% from 2020-2034 |
| Segmentation |
|
Table of Contents
- 1. Introduction
- 1.1. Research Scope
- 1.2. Market Segmentation
- 1.3. Research Objective
- 1.4. Definitions and Assumptions
- 2. Executive Summary
- 2.1. Market Snapshot
- 3. Market Dynamics
- 3.1. Market Drivers
- 3.2. Market Restrains
- 3.3. Market Trends
- 3.4. Market Opportunities
- 4. Market Factor Analysis
- 4.1. Porters Five Forces
- 4.1.1. Bargaining Power of Suppliers
- 4.1.2. Bargaining Power of Buyers
- 4.1.3. Threat of New Entrants
- 4.1.4. Threat of Substitutes
- 4.1.5. Competitive Rivalry
- 4.2. PESTEL analysis
- 4.3. BCG Analysis
- 4.3.1. Stars (High Growth, High Market Share)
- 4.3.2. Cash Cows (Low Growth, High Market Share)
- 4.3.3. Question Mark (High Growth, Low Market Share)
- 4.3.4. Dogs (Low Growth, Low Market Share)
- 4.4. Ansoff Matrix Analysis
- 4.5. Supply Chain Analysis
- 4.6. Regulatory Landscape
- 4.7. Current Market Potential and Opportunity Assessment (TAM–SAM–SOM Framework)
- 4.8. IMR Analyst Note
- 4.1. Porters Five Forces
- 5. Market Analysis, Insights and Forecast 2021-2033
- 5.1. Market Analysis, Insights and Forecast - by Technology
- 5.1.1. Lithium-ion Battery
- 5.1.2. Lead-acid Battery
- 5.1.3. Other Te
- 5.2. Market Analysis, Insights and Forecast - by Application
- 5.2.1. Forklift
- 5.2.2. Telecom
- 5.2.3. UPS
- 5.2.4. Other Applications
- 5.3. Market Analysis, Insights and Forecast - by End-User Industry
- 5.3.1. Power Sector (incl. ESS, UPS, etc.)
- 5.3.2. Oil & Gas Sector
- 5.3.3. Manufacturing Sector
- 5.3.4. Telecom
- 5.3.5. Other End-User Industries
- 5.4. Market Analysis, Insights and Forecast - by Region
- 5.4.1. North America
- 5.4.2. Europe
- 5.4.3. Asia Pacific
- 5.4.4. South America
- 5.4.5. Middle East and Africa
- 5.1. Market Analysis, Insights and Forecast - by Technology
- 6. Global Industrial Battery Market Analysis, Insights and Forecast, 2021-2033
- 6.1. Market Analysis, Insights and Forecast - by Technology
- 6.1.1. Lithium-ion Battery
- 6.1.2. Lead-acid Battery
- 6.1.3. Other Te
- 6.2. Market Analysis, Insights and Forecast - by Application
- 6.2.1. Forklift
- 6.2.2. Telecom
- 6.2.3. UPS
- 6.2.4. Other Applications
- 6.3. Market Analysis, Insights and Forecast - by End-User Industry
- 6.3.1. Power Sector (incl. ESS, UPS, etc.)
- 6.3.2. Oil & Gas Sector
- 6.3.3. Manufacturing Sector
- 6.3.4. Telecom
- 6.3.5. Other End-User Industries
- 6.1. Market Analysis, Insights and Forecast - by Technology
- 7. North America Industrial Battery Market Analysis, Insights and Forecast, 2020-2032
- 7.1. Market Analysis, Insights and Forecast - by Technology
- 7.1.1. Lithium-ion Battery
- 7.1.2. Lead-acid Battery
- 7.1.3. Other Te
- 7.2. Market Analysis, Insights and Forecast - by Application
- 7.2.1. Forklift
- 7.2.2. Telecom
- 7.2.3. UPS
- 7.2.4. Other Applications
- 7.3. Market Analysis, Insights and Forecast - by End-User Industry
- 7.3.1. Power Sector (incl. ESS, UPS, etc.)
- 7.3.2. Oil & Gas Sector
- 7.3.3. Manufacturing Sector
- 7.3.4. Telecom
- 7.3.5. Other End-User Industries
- 7.1. Market Analysis, Insights and Forecast - by Technology
- 8. Europe Industrial Battery Market Analysis, Insights and Forecast, 2020-2032
- 8.1. Market Analysis, Insights and Forecast - by Technology
- 8.1.1. Lithium-ion Battery
- 8.1.2. Lead-acid Battery
- 8.1.3. Other Te
- 8.2. Market Analysis, Insights and Forecast - by Application
- 8.2.1. Forklift
- 8.2.2. Telecom
- 8.2.3. UPS
- 8.2.4. Other Applications
- 8.3. Market Analysis, Insights and Forecast - by End-User Industry
- 8.3.1. Power Sector (incl. ESS, UPS, etc.)
- 8.3.2. Oil & Gas Sector
- 8.3.3. Manufacturing Sector
- 8.3.4. Telecom
- 8.3.5. Other End-User Industries
- 8.1. Market Analysis, Insights and Forecast - by Technology
- 9. Asia Pacific Industrial Battery Market Analysis, Insights and Forecast, 2020-2032
- 9.1. Market Analysis, Insights and Forecast - by Technology
- 9.1.1. Lithium-ion Battery
- 9.1.2. Lead-acid Battery
- 9.1.3. Other Te
- 9.2. Market Analysis, Insights and Forecast - by Application
- 9.2.1. Forklift
- 9.2.2. Telecom
- 9.2.3. UPS
- 9.2.4. Other Applications
- 9.3. Market Analysis, Insights and Forecast - by End-User Industry
- 9.3.1. Power Sector (incl. ESS, UPS, etc.)
- 9.3.2. Oil & Gas Sector
- 9.3.3. Manufacturing Sector
- 9.3.4. Telecom
- 9.3.5. Other End-User Industries
- 9.1. Market Analysis, Insights and Forecast - by Technology
- 10. South America Industrial Battery Market Analysis, Insights and Forecast, 2020-2032
- 10.1. Market Analysis, Insights and Forecast - by Technology
- 10.1.1. Lithium-ion Battery
- 10.1.2. Lead-acid Battery
- 10.1.3. Other Te
- 10.2. Market Analysis, Insights and Forecast - by Application
- 10.2.1. Forklift
- 10.2.2. Telecom
- 10.2.3. UPS
- 10.2.4. Other Applications
- 10.3. Market Analysis, Insights and Forecast - by End-User Industry
- 10.3.1. Power Sector (incl. ESS, UPS, etc.)
- 10.3.2. Oil & Gas Sector
- 10.3.3. Manufacturing Sector
- 10.3.4. Telecom
- 10.3.5. Other End-User Industries
- 10.1. Market Analysis, Insights and Forecast - by Technology
- 11. Middle East and Africa Industrial Battery Market Analysis, Insights and Forecast, 2020-2032
- 11.1. Market Analysis, Insights and Forecast - by Technology
- 11.1.1. Lithium-ion Battery
- 11.1.2. Lead-acid Battery
- 11.1.3. Other Te
- 11.2. Market Analysis, Insights and Forecast - by Application
- 11.2.1. Forklift
- 11.2.2. Telecom
- 11.2.3. UPS
- 11.2.4. Other Applications
- 11.3. Market Analysis, Insights and Forecast - by End-User Industry
- 11.3.1. Power Sector (incl. ESS, UPS, etc.)
- 11.3.2. Oil & Gas Sector
- 11.3.3. Manufacturing Sector
- 11.3.4. Telecom
- 11.3.5. Other End-User Industries
- 11.1. Market Analysis, Insights and Forecast - by Technology
- 12. Competitive Analysis
- 12.1. Company Profiles
- 12.1.1 Saft Groupe SA
- 12.1.1.1. Company Overview
- 12.1.1.2. Products
- 12.1.1.3. Company Financials
- 12.1.1.4. SWOT Analysis
- 12.1.2 Leoch International Technology Limited Inc
- 12.1.2.1. Company Overview
- 12.1.2.2. Products
- 12.1.2.3. Company Financials
- 12.1.2.4. SWOT Analysis
- 12.1.3 Enersys
- 12.1.3.1. Company Overview
- 12.1.3.2. Products
- 12.1.3.3. Company Financials
- 12.1.3.4. SWOT Analysis
- 12.1.4 JYC Battery Manufacturer Co Ltd *List Not Exhaustive 6 4 Market Ranking/Share Analysi
- 12.1.4.1. Company Overview
- 12.1.4.2. Products
- 12.1.4.3. Company Financials
- 12.1.4.4. SWOT Analysis
- 12.1.5 Exide Industries Ltd
- 12.1.5.1. Company Overview
- 12.1.5.2. Products
- 12.1.5.3. Company Financials
- 12.1.5.4. SWOT Analysis
- 12.1.6 East Penn Manufacturing Company Inc
- 12.1.6.1. Company Overview
- 12.1.6.2. Products
- 12.1.6.3. Company Financials
- 12.1.6.4. SWOT Analysis
- 12.1.7 GS Yuasa Corporation
- 12.1.7.1. Company Overview
- 12.1.7.2. Products
- 12.1.7.3. Company Financials
- 12.1.7.4. SWOT Analysis
- 12.1.8 C&D Technologies Pvt Ltd
- 12.1.8.1. Company Overview
- 12.1.8.2. Products
- 12.1.8.3. Company Financials
- 12.1.8.4. SWOT Analysis
- 12.1.9 Amar Raja batteries Ltd
- 12.1.9.1. Company Overview
- 12.1.9.2. Products
- 12.1.9.3. Company Financials
- 12.1.9.4. SWOT Analysis
- 12.1.10 Panasonic Corporation
- 12.1.10.1. Company Overview
- 12.1.10.2. Products
- 12.1.10.3. Company Financials
- 12.1.10.4. SWOT Analysis
- 12.1.1 Saft Groupe SA
- 12.2. Market Entropy
- 12.2.1 Company's Key Areas Served
- 12.2.2 Recent Developments
- 12.3. Company Market Share Analysis 2025
- 12.3.1 Top 5 Companies Market Share Analysis
- 12.3.2 Top 3 Companies Market Share Analysis
- 12.4. List of Potential Customers
- 13. Research Methodology
List of Figures
- Figure 1: Global Industrial Battery Market Revenue Breakdown (Million, %) by Region 2025 & 2033
- Figure 2: Global Industrial Battery Market Volume Breakdown (K Unit, %) by Region 2025 & 2033
- Figure 3: North America Industrial Battery Market Revenue (Million), by Technology 2025 & 2033
- Figure 4: North America Industrial Battery Market Volume (K Unit), by Technology 2025 & 2033
- Figure 5: North America Industrial Battery Market Revenue Share (%), by Technology 2025 & 2033
- Figure 6: North America Industrial Battery Market Volume Share (%), by Technology 2025 & 2033
- Figure 7: North America Industrial Battery Market Revenue (Million), by Application 2025 & 2033
- Figure 8: North America Industrial Battery Market Volume (K Unit), by Application 2025 & 2033
- Figure 9: North America Industrial Battery Market Revenue Share (%), by Application 2025 & 2033
- Figure 10: North America Industrial Battery Market Volume Share (%), by Application 2025 & 2033
- Figure 11: North America Industrial Battery Market Revenue (Million), by End-User Industry 2025 & 2033
- Figure 12: North America Industrial Battery Market Volume (K Unit), by End-User Industry 2025 & 2033
- Figure 13: North America Industrial Battery Market Revenue Share (%), by End-User Industry 2025 & 2033
- Figure 14: North America Industrial Battery Market Volume Share (%), by End-User Industry 2025 & 2033
- Figure 15: North America Industrial Battery Market Revenue (Million), by Country 2025 & 2033
- Figure 16: North America Industrial Battery Market Volume (K Unit), by Country 2025 & 2033
- Figure 17: North America Industrial Battery Market Revenue Share (%), by Country 2025 & 2033
- Figure 18: North America Industrial Battery Market Volume Share (%), by Country 2025 & 2033
- Figure 19: Europe Industrial Battery Market Revenue (Million), by Technology 2025 & 2033
- Figure 20: Europe Industrial Battery Market Volume (K Unit), by Technology 2025 & 2033
- Figure 21: Europe Industrial Battery Market Revenue Share (%), by Technology 2025 & 2033
- Figure 22: Europe Industrial Battery Market Volume Share (%), by Technology 2025 & 2033
- Figure 23: Europe Industrial Battery Market Revenue (Million), by Application 2025 & 2033
- Figure 24: Europe Industrial Battery Market Volume (K Unit), by Application 2025 & 2033
- Figure 25: Europe Industrial Battery Market Revenue Share (%), by Application 2025 & 2033
- Figure 26: Europe Industrial Battery Market Volume Share (%), by Application 2025 & 2033
- Figure 27: Europe Industrial Battery Market Revenue (Million), by End-User Industry 2025 & 2033
- Figure 28: Europe Industrial Battery Market Volume (K Unit), by End-User Industry 2025 & 2033
- Figure 29: Europe Industrial Battery Market Revenue Share (%), by End-User Industry 2025 & 2033
- Figure 30: Europe Industrial Battery Market Volume Share (%), by End-User Industry 2025 & 2033
- Figure 31: Europe Industrial Battery Market Revenue (Million), by Country 2025 & 2033
- Figure 32: Europe Industrial Battery Market Volume (K Unit), by Country 2025 & 2033
- Figure 33: Europe Industrial Battery Market Revenue Share (%), by Country 2025 & 2033
- Figure 34: Europe Industrial Battery Market Volume Share (%), by Country 2025 & 2033
- Figure 35: Asia Pacific Industrial Battery Market Revenue (Million), by Technology 2025 & 2033
- Figure 36: Asia Pacific Industrial Battery Market Volume (K Unit), by Technology 2025 & 2033
- Figure 37: Asia Pacific Industrial Battery Market Revenue Share (%), by Technology 2025 & 2033
- Figure 38: Asia Pacific Industrial Battery Market Volume Share (%), by Technology 2025 & 2033
- Figure 39: Asia Pacific Industrial Battery Market Revenue (Million), by Application 2025 & 2033
- Figure 40: Asia Pacific Industrial Battery Market Volume (K Unit), by Application 2025 & 2033
- Figure 41: Asia Pacific Industrial Battery Market Revenue Share (%), by Application 2025 & 2033
- Figure 42: Asia Pacific Industrial Battery Market Volume Share (%), by Application 2025 & 2033
- Figure 43: Asia Pacific Industrial Battery Market Revenue (Million), by End-User Industry 2025 & 2033
- Figure 44: Asia Pacific Industrial Battery Market Volume (K Unit), by End-User Industry 2025 & 2033
- Figure 45: Asia Pacific Industrial Battery Market Revenue Share (%), by End-User Industry 2025 & 2033
- Figure 46: Asia Pacific Industrial Battery Market Volume Share (%), by End-User Industry 2025 & 2033
- Figure 47: Asia Pacific Industrial Battery Market Revenue (Million), by Country 2025 & 2033
- Figure 48: Asia Pacific Industrial Battery Market Volume (K Unit), by Country 2025 & 2033
- Figure 49: Asia Pacific Industrial Battery Market Revenue Share (%), by Country 2025 & 2033
- Figure 50: Asia Pacific Industrial Battery Market Volume Share (%), by Country 2025 & 2033
- Figure 51: South America Industrial Battery Market Revenue (Million), by Technology 2025 & 2033
- Figure 52: South America Industrial Battery Market Volume (K Unit), by Technology 2025 & 2033
- Figure 53: South America Industrial Battery Market Revenue Share (%), by Technology 2025 & 2033
- Figure 54: South America Industrial Battery Market Volume Share (%), by Technology 2025 & 2033
- Figure 55: South America Industrial Battery Market Revenue (Million), by Application 2025 & 2033
- Figure 56: South America Industrial Battery Market Volume (K Unit), by Application 2025 & 2033
- Figure 57: South America Industrial Battery Market Revenue Share (%), by Application 2025 & 2033
- Figure 58: South America Industrial Battery Market Volume Share (%), by Application 2025 & 2033
- Figure 59: South America Industrial Battery Market Revenue (Million), by End-User Industry 2025 & 2033
- Figure 60: South America Industrial Battery Market Volume (K Unit), by End-User Industry 2025 & 2033
- Figure 61: South America Industrial Battery Market Revenue Share (%), by End-User Industry 2025 & 2033
- Figure 62: South America Industrial Battery Market Volume Share (%), by End-User Industry 2025 & 2033
- Figure 63: South America Industrial Battery Market Revenue (Million), by Country 2025 & 2033
- Figure 64: South America Industrial Battery Market Volume (K Unit), by Country 2025 & 2033
- Figure 65: South America Industrial Battery Market Revenue Share (%), by Country 2025 & 2033
- Figure 66: South America Industrial Battery Market Volume Share (%), by Country 2025 & 2033
- Figure 67: Middle East and Africa Industrial Battery Market Revenue (Million), by Technology 2025 & 2033
- Figure 68: Middle East and Africa Industrial Battery Market Volume (K Unit), by Technology 2025 & 2033
- Figure 69: Middle East and Africa Industrial Battery Market Revenue Share (%), by Technology 2025 & 2033
- Figure 70: Middle East and Africa Industrial Battery Market Volume Share (%), by Technology 2025 & 2033
- Figure 71: Middle East and Africa Industrial Battery Market Revenue (Million), by Application 2025 & 2033
- Figure 72: Middle East and Africa Industrial Battery Market Volume (K Unit), by Application 2025 & 2033
- Figure 73: Middle East and Africa Industrial Battery Market Revenue Share (%), by Application 2025 & 2033
- Figure 74: Middle East and Africa Industrial Battery Market Volume Share (%), by Application 2025 & 2033
- Figure 75: Middle East and Africa Industrial Battery Market Revenue (Million), by End-User Industry 2025 & 2033
- Figure 76: Middle East and Africa Industrial Battery Market Volume (K Unit), by End-User Industry 2025 & 2033
- Figure 77: Middle East and Africa Industrial Battery Market Revenue Share (%), by End-User Industry 2025 & 2033
- Figure 78: Middle East and Africa Industrial Battery Market Volume Share (%), by End-User Industry 2025 & 2033
- Figure 79: Middle East and Africa Industrial Battery Market Revenue (Million), by Country 2025 & 2033
- Figure 80: Middle East and Africa Industrial Battery Market Volume (K Unit), by Country 2025 & 2033
- Figure 81: Middle East and Africa Industrial Battery Market Revenue Share (%), by Country 2025 & 2033
- Figure 82: Middle East and Africa Industrial Battery Market Volume Share (%), by Country 2025 & 2033
List of Tables
- Table 1: Global Industrial Battery Market Revenue Million Forecast, by Technology 2020 & 2033
- Table 2: Global Industrial Battery Market Volume K Unit Forecast, by Technology 2020 & 2033
- Table 3: Global Industrial Battery Market Revenue Million Forecast, by Application 2020 & 2033
- Table 4: Global Industrial Battery Market Volume K Unit Forecast, by Application 2020 & 2033
- Table 5: Global Industrial Battery Market Revenue Million Forecast, by End-User Industry 2020 & 2033
- Table 6: Global Industrial Battery Market Volume K Unit Forecast, by End-User Industry 2020 & 2033
- Table 7: Global Industrial Battery Market Revenue Million Forecast, by Region 2020 & 2033
- Table 8: Global Industrial Battery Market Volume K Unit Forecast, by Region 2020 & 2033
- Table 9: Global Industrial Battery Market Revenue Million Forecast, by Technology 2020 & 2033
- Table 10: Global Industrial Battery Market Volume K Unit Forecast, by Technology 2020 & 2033
- Table 11: Global Industrial Battery Market Revenue Million Forecast, by Application 2020 & 2033
- Table 12: Global Industrial Battery Market Volume K Unit Forecast, by Application 2020 & 2033
- Table 13: Global Industrial Battery Market Revenue Million Forecast, by End-User Industry 2020 & 2033
- Table 14: Global Industrial Battery Market Volume K Unit Forecast, by End-User Industry 2020 & 2033
- Table 15: Global Industrial Battery Market Revenue Million Forecast, by Country 2020 & 2033
- Table 16: Global Industrial Battery Market Volume K Unit Forecast, by Country 2020 & 2033
- Table 17: United States Industrial Battery Market Revenue (Million) Forecast, by Application 2020 & 2033
- Table 18: United States Industrial Battery Market Volume (K Unit) Forecast, by Application 2020 & 2033
- Table 19: Canada Industrial Battery Market Revenue (Million) Forecast, by Application 2020 & 2033
- Table 20: Canada Industrial Battery Market Volume (K Unit) Forecast, by Application 2020 & 2033
- Table 21: Rest of North America Industrial Battery Market Revenue (Million) Forecast, by Application 2020 & 2033
- Table 22: Rest of North America Industrial Battery Market Volume (K Unit) Forecast, by Application 2020 & 2033
- Table 23: Global Industrial Battery Market Revenue Million Forecast, by Technology 2020 & 2033
- Table 24: Global Industrial Battery Market Volume K Unit Forecast, by Technology 2020 & 2033
- Table 25: Global Industrial Battery Market Revenue Million Forecast, by Application 2020 & 2033
- Table 26: Global Industrial Battery Market Volume K Unit Forecast, by Application 2020 & 2033
- Table 27: Global Industrial Battery Market Revenue Million Forecast, by End-User Industry 2020 & 2033
- Table 28: Global Industrial Battery Market Volume K Unit Forecast, by End-User Industry 2020 & 2033
- Table 29: Global Industrial Battery Market Revenue Million Forecast, by Country 2020 & 2033
- Table 30: Global Industrial Battery Market Volume K Unit Forecast, by Country 2020 & 2033
- Table 31: Germany Industrial Battery Market Revenue (Million) Forecast, by Application 2020 & 2033
- Table 32: Germany Industrial Battery Market Volume (K Unit) Forecast, by Application 2020 & 2033
- Table 33: France Industrial Battery Market Revenue (Million) Forecast, by Application 2020 & 2033
- Table 34: France Industrial Battery Market Volume (K Unit) Forecast, by Application 2020 & 2033
- Table 35: United Kingdom Industrial Battery Market Revenue (Million) Forecast, by Application 2020 & 2033
- Table 36: United Kingdom Industrial Battery Market Volume (K Unit) Forecast, by Application 2020 & 2033
- Table 37: Italy Industrial Battery Market Revenue (Million) Forecast, by Application 2020 & 2033
- Table 38: Italy Industrial Battery Market Volume (K Unit) Forecast, by Application 2020 & 2033
- Table 39: Spain Industrial Battery Market Revenue (Million) Forecast, by Application 2020 & 2033
- Table 40: Spain Industrial Battery Market Volume (K Unit) Forecast, by Application 2020 & 2033
- Table 41: Nordic Countries Industrial Battery Market Revenue (Million) Forecast, by Application 2020 & 2033
- Table 42: Nordic Countries Industrial Battery Market Volume (K Unit) Forecast, by Application 2020 & 2033
- Table 43: Turkey Industrial Battery Market Revenue (Million) Forecast, by Application 2020 & 2033
- Table 44: Turkey Industrial Battery Market Volume (K Unit) Forecast, by Application 2020 & 2033
- Table 45: Russia Industrial Battery Market Revenue (Million) Forecast, by Application 2020 & 2033
- Table 46: Russia Industrial Battery Market Volume (K Unit) Forecast, by Application 2020 & 2033
- Table 47: Rest of Europe Industrial Battery Market Revenue (Million) Forecast, by Application 2020 & 2033
- Table 48: Rest of Europe Industrial Battery Market Volume (K Unit) Forecast, by Application 2020 & 2033
- Table 49: Global Industrial Battery Market Revenue Million Forecast, by Technology 2020 & 2033
- Table 50: Global Industrial Battery Market Volume K Unit Forecast, by Technology 2020 & 2033
- Table 51: Global Industrial Battery Market Revenue Million Forecast, by Application 2020 & 2033
- Table 52: Global Industrial Battery Market Volume K Unit Forecast, by Application 2020 & 2033
- Table 53: Global Industrial Battery Market Revenue Million Forecast, by End-User Industry 2020 & 2033
- Table 54: Global Industrial Battery Market Volume K Unit Forecast, by End-User Industry 2020 & 2033
- Table 55: Global Industrial Battery Market Revenue Million Forecast, by Country 2020 & 2033
- Table 56: Global Industrial Battery Market Volume K Unit Forecast, by Country 2020 & 2033
- Table 57: China Industrial Battery Market Revenue (Million) Forecast, by Application 2020 & 2033
- Table 58: China Industrial Battery Market Volume (K Unit) Forecast, by Application 2020 & 2033
- Table 59: Japan Industrial Battery Market Revenue (Million) Forecast, by Application 2020 & 2033
- Table 60: Japan Industrial Battery Market Volume (K Unit) Forecast, by Application 2020 & 2033
- Table 61: India Industrial Battery Market Revenue (Million) Forecast, by Application 2020 & 2033
- Table 62: India Industrial Battery Market Volume (K Unit) Forecast, by Application 2020 & 2033
- Table 63: Australia Industrial Battery Market Revenue (Million) Forecast, by Application 2020 & 2033
- Table 64: Australia Industrial Battery Market Volume (K Unit) Forecast, by Application 2020 & 2033
- Table 65: Malaysis Industrial Battery Market Revenue (Million) Forecast, by Application 2020 & 2033
- Table 66: Malaysis Industrial Battery Market Volume (K Unit) Forecast, by Application 2020 & 2033
- Table 67: Indonesia Industrial Battery Market Revenue (Million) Forecast, by Application 2020 & 2033
- Table 68: Indonesia Industrial Battery Market Volume (K Unit) Forecast, by Application 2020 & 2033
- Table 69: Thailand Industrial Battery Market Revenue (Million) Forecast, by Application 2020 & 2033
- Table 70: Thailand Industrial Battery Market Volume (K Unit) Forecast, by Application 2020 & 2033
- Table 71: Vietnam Industrial Battery Market Revenue (Million) Forecast, by Application 2020 & 2033
- Table 72: Vietnam Industrial Battery Market Volume (K Unit) Forecast, by Application 2020 & 2033
- Table 73: Rest of Asia Pacific Industrial Battery Market Revenue (Million) Forecast, by Application 2020 & 2033
- Table 74: Rest of Asia Pacific Industrial Battery Market Volume (K Unit) Forecast, by Application 2020 & 2033
- Table 75: Global Industrial Battery Market Revenue Million Forecast, by Technology 2020 & 2033
- Table 76: Global Industrial Battery Market Volume K Unit Forecast, by Technology 2020 & 2033
- Table 77: Global Industrial Battery Market Revenue Million Forecast, by Application 2020 & 2033
- Table 78: Global Industrial Battery Market Volume K Unit Forecast, by Application 2020 & 2033
- Table 79: Global Industrial Battery Market Revenue Million Forecast, by End-User Industry 2020 & 2033
- Table 80: Global Industrial Battery Market Volume K Unit Forecast, by End-User Industry 2020 & 2033
- Table 81: Global Industrial Battery Market Revenue Million Forecast, by Country 2020 & 2033
- Table 82: Global Industrial Battery Market Volume K Unit Forecast, by Country 2020 & 2033
- Table 83: Brazil Industrial Battery Market Revenue (Million) Forecast, by Application 2020 & 2033
- Table 84: Brazil Industrial Battery Market Volume (K Unit) Forecast, by Application 2020 & 2033
- Table 85: Argentina Industrial Battery Market Revenue (Million) Forecast, by Application 2020 & 2033
- Table 86: Argentina Industrial Battery Market Volume (K Unit) Forecast, by Application 2020 & 2033
- Table 87: Chile Industrial Battery Market Revenue (Million) Forecast, by Application 2020 & 2033
- Table 88: Chile Industrial Battery Market Volume (K Unit) Forecast, by Application 2020 & 2033
- Table 89: Colombia Industrial Battery Market Revenue (Million) Forecast, by Application 2020 & 2033
- Table 90: Colombia Industrial Battery Market Volume (K Unit) Forecast, by Application 2020 & 2033
- Table 91: Rest of South America Industrial Battery Market Revenue (Million) Forecast, by Application 2020 & 2033
- Table 92: Rest of South America Industrial Battery Market Volume (K Unit) Forecast, by Application 2020 & 2033
- Table 93: Global Industrial Battery Market Revenue Million Forecast, by Technology 2020 & 2033
- Table 94: Global Industrial Battery Market Volume K Unit Forecast, by Technology 2020 & 2033
- Table 95: Global Industrial Battery Market Revenue Million Forecast, by Application 2020 & 2033
- Table 96: Global Industrial Battery Market Volume K Unit Forecast, by Application 2020 & 2033
- Table 97: Global Industrial Battery Market Revenue Million Forecast, by End-User Industry 2020 & 2033
- Table 98: Global Industrial Battery Market Volume K Unit Forecast, by End-User Industry 2020 & 2033
- Table 99: Global Industrial Battery Market Revenue Million Forecast, by Country 2020 & 2033
- Table 100: Global Industrial Battery Market Volume K Unit Forecast, by Country 2020 & 2033
- Table 101: United Arab Emirates Industrial Battery Market Revenue (Million) Forecast, by Application 2020 & 2033
- Table 102: United Arab Emirates Industrial Battery Market Volume (K Unit) Forecast, by Application 2020 & 2033
- Table 103: Saudi Arabia Industrial Battery Market Revenue (Million) Forecast, by Application 2020 & 2033
- Table 104: Saudi Arabia Industrial Battery Market Volume (K Unit) Forecast, by Application 2020 & 2033
- Table 105: Qatar Industrial Battery Market Revenue (Million) Forecast, by Application 2020 & 2033
- Table 106: Qatar Industrial Battery Market Volume (K Unit) Forecast, by Application 2020 & 2033
- Table 107: South Africa Industrial Battery Market Revenue (Million) Forecast, by Application 2020 & 2033
- Table 108: South Africa Industrial Battery Market Volume (K Unit) Forecast, by Application 2020 & 2033
- Table 109: Nigeria Industrial Battery Market Revenue (Million) Forecast, by Application 2020 & 2033
- Table 110: Nigeria Industrial Battery Market Volume (K Unit) Forecast, by Application 2020 & 2033
- Table 111: Egypt Industrial Battery Market Revenue (Million) Forecast, by Application 2020 & 2033
- Table 112: Egypt Industrial Battery Market Volume (K Unit) Forecast, by Application 2020 & 2033
- Table 113: Rest of Middle East and Africa Industrial Battery Market Revenue (Million) Forecast, by Application 2020 & 2033
- Table 114: Rest of Middle East and Africa Industrial Battery Market Volume (K Unit) Forecast, by Application 2020 & 2033
Frequently Asked Questions
1. What is the projected Compound Annual Growth Rate (CAGR) of the Industrial Battery Market?
The projected CAGR is approximately 16.80%.
2. Which companies are prominent players in the Industrial Battery Market?
Key companies in the market include Saft Groupe SA, Leoch International Technology Limited Inc, Enersys, JYC Battery Manufacturer Co Ltd *List Not Exhaustive 6 4 Market Ranking/Share Analysi, Exide Industries Ltd, East Penn Manufacturing Company Inc, GS Yuasa Corporation, C&D Technologies Pvt Ltd, Amar Raja batteries Ltd, Panasonic Corporation.
3. What are the main segments of the Industrial Battery Market?
The market segments include Technology, Application, End-User Industry.
4. Can you provide details about the market size?
The market size is estimated to be USD 37.82 Million as of 2022.
5. What are some drivers contributing to market growth?
4.; Declining Lithium-ion Battery Prices4.; Rising Renewable Energy Integration Worldwide.
6. What are the notable trends driving market growth?
Forklift Application Expected to Dominate the Market.
7. Are there any restraints impacting market growth?
4.; Uncertainty in Raw Material Prices.
8. Can you provide examples of recent developments in the market?
January 2023: Oil & Natural Gas Corporation (ONGC) subsidiary, ONGC Tripura Power Company, signed an agreement with Assam Power Distribution Company Limited (APDCL) for a large-scale battery storage project in Assam. The project is worth USD 245 million, and both companies will form a joint venture (JV) to develop a battery energy storage system (BESS) project with up to 250MW rated power output and 500MWh capacity.
9. What pricing options are available for accessing the report?
Pricing options include single-user, multi-user, and enterprise licenses priced at USD 4750, USD 5250, and USD 8750 respectively.
10. Is the market size provided in terms of value or volume?
The market size is provided in terms of value, measured in Million and volume, measured in K Unit.
11. Are there any specific market keywords associated with the report?
Yes, the market keyword associated with the report is "Industrial Battery Market," which aids in identifying and referencing the specific market segment covered.
12. How do I determine which pricing option suits my needs best?
The pricing options vary based on user requirements and access needs. Individual users may opt for single-user licenses, while businesses requiring broader access may choose multi-user or enterprise licenses for cost-effective access to the report.
13. Are there any additional resources or data provided in the Industrial Battery Market report?
While the report offers comprehensive insights, it's advisable to review the specific contents or supplementary materials provided to ascertain if additional resources or data are available.
14. How can I stay updated on further developments or reports in the Industrial Battery Market?
To stay informed about further developments, trends, and reports in the Industrial Battery Market, consider subscribing to industry newsletters, following relevant companies and organizations, or regularly checking reputable industry news sources and publications.
Methodology
Step 1 - Identification of Relevant Samples Size from Population Database


Step 2 - Approaches for Defining Global Market Size (Value, Volume* & Price*)

Note*: In applicable scenarios
Step 3 - Data Sources
Primary Research
- Web Analytics
- Survey Reports
- Research Institute
- Latest Research Reports
- Opinion Leaders
Secondary Research
- Annual Reports
- White Paper
- Latest Press Release
- Industry Association
- Paid Database
- Investor Presentations

Step 4 - Data Triangulation
Involves using different sources of information in order to increase the validity of a study
These sources are likely to be stakeholders in a program - participants, other researchers, program staff, other community members, and so on.
Then we put all data in single framework & apply various statistical tools to find out the dynamic on the market.
During the analysis stage, feedback from the stakeholder groups would be compared to determine areas of agreement as well as areas of divergence