

Key Insights
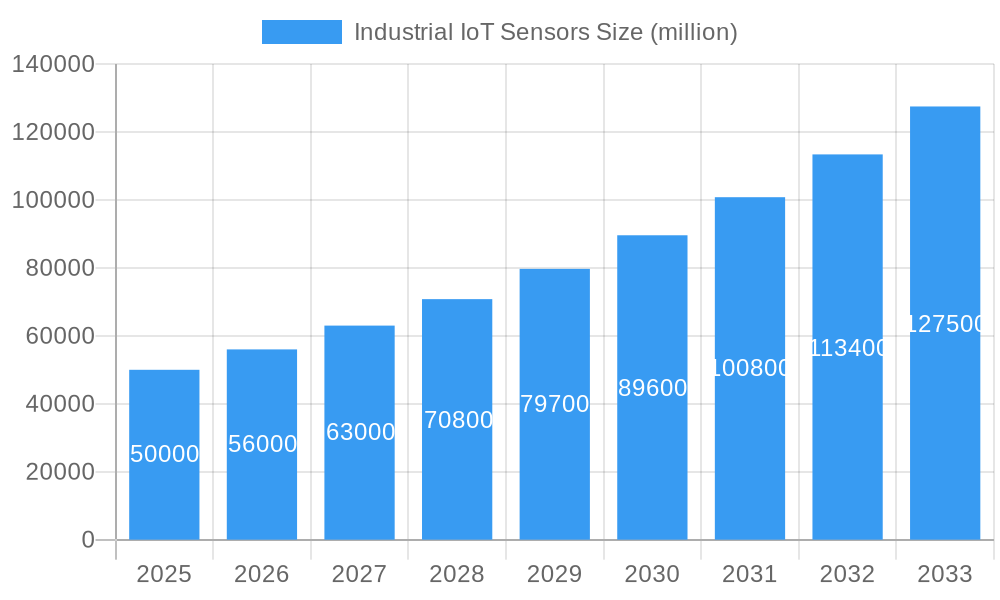
The Industrial Internet of Things (IIoT) sensor market is experiencing robust growth, driven by the increasing adoption of smart manufacturing, predictive maintenance, and automation across various industrial sectors. The market, estimated at $50 billion in 2025, is projected to maintain a Compound Annual Growth Rate (CAGR) of 12% from 2025 to 2033, reaching approximately $150 billion by 2033. This expansion is fueled by several key factors: the declining cost of sensors, advancements in sensor technology leading to improved accuracy and reliability, and the rising need for real-time data analysis to optimize operational efficiency and reduce downtime. Major industry players like Bosch, Honeywell, and Texas Instruments are heavily invested in developing innovative sensor solutions, further stimulating market growth. Significant regional variations exist, with North America and Europe currently holding the largest market share due to advanced infrastructure and early adoption of IIoT technologies. However, rapidly developing economies in Asia-Pacific are expected to witness significant growth in the coming years, driven by increasing industrialization and government initiatives promoting digital transformation. Challenges remain, including concerns around data security, interoperability issues between different sensor systems, and the need for robust communication networks to support the influx of data generated by IIoT sensors.
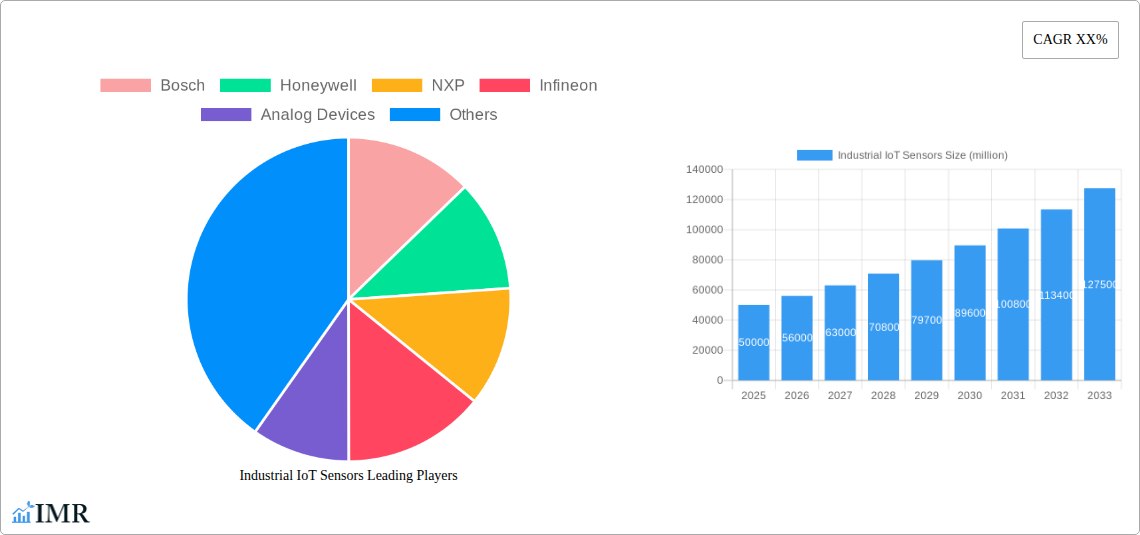
Industrial IoT Sensors Market Size (In Billion)
Despite these challenges, the long-term outlook for the IIoT sensor market remains positive. The continuous integration of advanced technologies such as artificial intelligence (AI) and machine learning (ML) into sensor systems will enhance data processing capabilities and unlock new possibilities for predictive analytics and automation. This will further expand the applications of IIoT sensors across diverse industries, including manufacturing, energy, transportation, and healthcare. The market segmentation is broad, encompassing various sensor types (temperature, pressure, flow, etc.) tailored to specific industrial applications. The competitive landscape is marked by a mix of established players and emerging companies vying for market share through innovation and strategic partnerships. The continued focus on developing energy-efficient and cost-effective solutions will be crucial for driving wider adoption and unlocking the full potential of the IIoT sensor market.
Industrial IoT Sensors Company Market Share
Industrial IoT Sensors Market Report: 2019-2033
This comprehensive report provides an in-depth analysis of the Industrial IoT (IIoT) Sensors market, encompassing market dynamics, growth trends, regional dominance, product landscape, key players, and future outlook. The study period covers 2019-2033, with a base year of 2025 and a forecast period of 2025-2033. The report offers crucial insights for industry professionals, investors, and stakeholders seeking to navigate this rapidly evolving market. The parent market is Industrial Automation and the child market is Industrial Sensors. The total market size in 2025 is estimated at xx million units.
Industrial IoT Sensors Market Dynamics & Structure
The Industrial IoT Sensors market is characterized by moderate concentration, with several major players holding significant market share. Technological innovation, driven by advancements in sensor technology, data analytics, and connectivity, is a key growth driver. Regulatory frameworks, particularly those related to data privacy and security, significantly influence market development. Competitive substitutes, such as traditional sensor technologies, exert pressure, while end-user demographics (manufacturing, energy, automotive, etc.) shape demand patterns. The historical period (2019-2024) witnessed a steady increase in M&A activity, with an estimated xx number of deals.
- Market Concentration: Moderately concentrated, with top 5 players holding approximately xx% market share in 2025.
- Technological Innovation: Significant advancements in miniaturization, power efficiency, and sensor integration.
- Regulatory Landscape: Stringent data privacy regulations and cybersecurity standards impacting market strategies.
- Competitive Substitutes: Pressure from established sensor technologies; however, IIoT sensors offer superior data analytics capabilities.
- M&A Activity: xx number of mergers and acquisitions between 2019 and 2024, indicating a trend of consolidation.
- Innovation Barriers: High R&D costs and complexity in integrating diverse sensor technologies.
Industrial IoT Sensors Growth Trends & Insights
The IIoT Sensors market exhibited robust growth between 2019 and 2024, expanding at a CAGR of xx%. This growth is fueled by the increasing adoption of Industry 4.0 technologies across various industries. The market is expected to continue its upward trajectory, reaching xx million units by 2033, with a projected CAGR of xx% during the forecast period (2025-2033). This expansion is driven by factors such as increasing automation, data-driven decision making, and rising demand for predictive maintenance. The market penetration rate in key industries like manufacturing is expected to increase from xx% in 2025 to xx% by 2033. Technological disruptions, particularly the rise of AI and machine learning, are further accelerating adoption rates. Consumer behavior shifts towards smart and connected devices are also contributing to market growth.
Dominant Regions, Countries, or Segments in Industrial IoT Sensors
North America currently holds the largest market share in the IIoT Sensors market, driven by strong industrial automation adoption and technological advancements. However, the Asia-Pacific region is projected to experience the fastest growth during the forecast period, propelled by rapid industrialization and expanding infrastructure development in countries like China and India. Within segments, the manufacturing sector remains the dominant end-user, accounting for approximately xx% of total market share in 2025.
- North America: Strong technological base, high adoption rates, and substantial investments in automation.
- Asia-Pacific: Rapid industrialization, growing infrastructure, and cost-effective manufacturing capabilities.
- Europe: Focus on sustainable industrial practices and smart manufacturing initiatives.
- Manufacturing Sector: Highest demand for IIoT sensors due to the need for increased efficiency and predictive maintenance.
- Energy Sector: Significant growth potential due to smart grids and renewable energy adoption.
Industrial IoT Sensors Product Landscape
The IIoT sensors market showcases a wide range of products, including temperature sensors, pressure sensors, flow sensors, accelerometers, and proximity sensors. Recent innovations emphasize miniaturization, wireless connectivity (e.g., Bluetooth, LoRaWAN), enhanced power efficiency, and improved data processing capabilities. These advancements enable seamless integration into existing industrial infrastructure and facilitate real-time data acquisition and analysis. Unique selling propositions often focus on improved accuracy, reliability, and ease of implementation.
Key Drivers, Barriers & Challenges in Industrial IoT Sensors
Key Drivers:
- Increased automation and digitization in industrial settings.
- Growing demand for predictive maintenance and real-time monitoring.
- Rise of Industry 4.0 and smart manufacturing initiatives.
- Advancements in sensor technology, data analytics, and connectivity.
Challenges & Restraints:
- High initial investment costs for implementation.
- Concerns about data security and privacy.
- Interoperability issues between different sensor systems.
- Complexity in data integration and analysis.
- Supply chain disruptions potentially impacting production and availability.
Emerging Opportunities in Industrial IoT Sensors
Emerging opportunities lie in the adoption of IIoT sensors in new and untapped markets, including smart agriculture, smart cities, and the healthcare sector. Innovative applications, such as condition-based maintenance and real-time asset tracking, present significant growth potential. Furthermore, evolving consumer preferences towards energy efficiency and environmental sustainability are driving demand for sensors that monitor and optimize energy consumption.
Growth Accelerators in the Industrial IoT Sensors Industry
Technological breakthroughs in areas such as AI-powered analytics, edge computing, and 5G connectivity will significantly accelerate market growth. Strategic partnerships between sensor manufacturers, software providers, and system integrators will also play a crucial role. Expanding market penetration in emerging economies and development of industry-specific solutions will further fuel market expansion.
Key Players Shaping the Industrial IoT Sensors Market
- Bosch
- Honeywell
- NXP
- Infineon
- Analog Devices
- Panasonic
- InvenSense
- TI
- Silicon Laboratories
- ABB
- STMicroelectronics
- TE Connectivity
- Huagong Tech
- Sensirion
- Zhonghang Electronic Measuring Instruments
- Vishay
- Hanwei Electronics
- Semtech
- Omron
Notable Milestones in Industrial IoT Sensors Sector
- 2020: Launch of a new generation of low-power, long-range IIoT sensors by several key players.
- 2021: Significant increase in partnerships between sensor manufacturers and cloud service providers.
- 2022: Introduction of AI-powered predictive maintenance solutions leveraging IIoT sensor data.
- 2023: Several major mergers and acquisitions consolidating the market landscape.
- 2024: Government initiatives promoting the adoption of IIoT in key industries.
In-Depth Industrial IoT Sensors Market Outlook
The IIoT Sensors market is poised for sustained growth in the coming years, driven by ongoing technological advancements and increasing adoption across various industries. Strategic opportunities exist for companies focusing on developing innovative sensor technologies, providing advanced data analytics solutions, and establishing robust cybersecurity measures. The market's future potential hinges on the successful integration of IIoT sensors into broader industrial ecosystems and the continued expansion of Industry 4.0 initiatives globally.
Industrial IoT Sensors Segmentation
-
1. Application
- 1.1. Energy & Power
- 1.2. Oil & Gas
- 1.3. Mining
- 1.4. Chemical
- 1.5. Manufacturing
- 1.6. Others
-
2. Types
- 2.1. Pressure Sensor
- 2.2. Environmental Sensor
- 2.3. Optical Sensor
- 2.4. Chemical Sensor
- 2.5. Motion Sensor
- 2.6. Others
Industrial IoT Sensors Segmentation By Geography
-
1. North America
- 1.1. United States
- 1.2. Canada
- 1.3. Mexico
-
2. South America
- 2.1. Brazil
- 2.2. Argentina
- 2.3. Rest of South America
-
3. Europe
- 3.1. United Kingdom
- 3.2. Germany
- 3.3. France
- 3.4. Italy
- 3.5. Spain
- 3.6. Russia
- 3.7. Benelux
- 3.8. Nordics
- 3.9. Rest of Europe
-
4. Middle East & Africa
- 4.1. Turkey
- 4.2. Israel
- 4.3. GCC
- 4.4. North Africa
- 4.5. South Africa
- 4.6. Rest of Middle East & Africa
-
5. Asia Pacific
- 5.1. China
- 5.2. India
- 5.3. Japan
- 5.4. South Korea
- 5.5. ASEAN
- 5.6. Oceania
- 5.7. Rest of Asia Pacific

Industrial IoT Sensors Regional Market Share
Geographic Coverage of Industrial IoT Sensors
Industrial IoT Sensors REPORT HIGHLIGHTS
| Aspects | Details |
|---|---|
| Study Period | 2020-2034 |
| Base Year | 2025 |
| Estimated Year | 2026 |
| Forecast Period | 2026-2034 |
| Historical Period | 2020-2025 |
| Growth Rate | CAGR of 27.9% from 2020-2034 |
| Segmentation |
|
Table of Contents
- 1. Introduction
- 1.1. Research Scope
- 1.2. Market Segmentation
- 1.3. Research Objective
- 1.4. Definitions and Assumptions
- 2. Executive Summary
- 2.1. Market Snapshot
- 3. Market Dynamics
- 3.1. Market Drivers
- 3.2. Market Restrains
- 3.3. Market Trends
- 3.4. Market Opportunities
- 4. Market Factor Analysis
- 4.1. Porters Five Forces
- 4.1.1. Bargaining Power of Suppliers
- 4.1.2. Bargaining Power of Buyers
- 4.1.3. Threat of New Entrants
- 4.1.4. Threat of Substitutes
- 4.1.5. Competitive Rivalry
- 4.2. PESTEL analysis
- 4.3. BCG Analysis
- 4.3.1. Stars (High Growth, High Market Share)
- 4.3.2. Cash Cows (Low Growth, High Market Share)
- 4.3.3. Question Mark (High Growth, Low Market Share)
- 4.3.4. Dogs (Low Growth, Low Market Share)
- 4.4. Ansoff Matrix Analysis
- 4.5. Supply Chain Analysis
- 4.6. Regulatory Landscape
- 4.7. Current Market Potential and Opportunity Assessment (TAM–SAM–SOM Framework)
- 4.8. IMR Analyst Note
- 4.1. Porters Five Forces
- 5. Market Analysis, Insights and Forecast 2021-2033
- 5.1. Market Analysis, Insights and Forecast - by Application
- 5.1.1. Energy & Power
- 5.1.2. Oil & Gas
- 5.1.3. Mining
- 5.1.4. Chemical
- 5.1.5. Manufacturing
- 5.1.6. Others
- 5.2. Market Analysis, Insights and Forecast - by Types
- 5.2.1. Pressure Sensor
- 5.2.2. Environmental Sensor
- 5.2.3. Optical Sensor
- 5.2.4. Chemical Sensor
- 5.2.5. Motion Sensor
- 5.2.6. Others
- 5.3. Market Analysis, Insights and Forecast - by Region
- 5.3.1. North America
- 5.3.2. South America
- 5.3.3. Europe
- 5.3.4. Middle East & Africa
- 5.3.5. Asia Pacific
- 5.1. Market Analysis, Insights and Forecast - by Application
- 6. Global Industrial IoT Sensors Analysis, Insights and Forecast, 2021-2033
- 6.1. Market Analysis, Insights and Forecast - by Application
- 6.1.1. Energy & Power
- 6.1.2. Oil & Gas
- 6.1.3. Mining
- 6.1.4. Chemical
- 6.1.5. Manufacturing
- 6.1.6. Others
- 6.2. Market Analysis, Insights and Forecast - by Types
- 6.2.1. Pressure Sensor
- 6.2.2. Environmental Sensor
- 6.2.3. Optical Sensor
- 6.2.4. Chemical Sensor
- 6.2.5. Motion Sensor
- 6.2.6. Others
- 6.1. Market Analysis, Insights and Forecast - by Application
- 7. North America Industrial IoT Sensors Analysis, Insights and Forecast, 2020-2032
- 7.1. Market Analysis, Insights and Forecast - by Application
- 7.1.1. Energy & Power
- 7.1.2. Oil & Gas
- 7.1.3. Mining
- 7.1.4. Chemical
- 7.1.5. Manufacturing
- 7.1.6. Others
- 7.2. Market Analysis, Insights and Forecast - by Types
- 7.2.1. Pressure Sensor
- 7.2.2. Environmental Sensor
- 7.2.3. Optical Sensor
- 7.2.4. Chemical Sensor
- 7.2.5. Motion Sensor
- 7.2.6. Others
- 7.1. Market Analysis, Insights and Forecast - by Application
- 8. South America Industrial IoT Sensors Analysis, Insights and Forecast, 2020-2032
- 8.1. Market Analysis, Insights and Forecast - by Application
- 8.1.1. Energy & Power
- 8.1.2. Oil & Gas
- 8.1.3. Mining
- 8.1.4. Chemical
- 8.1.5. Manufacturing
- 8.1.6. Others
- 8.2. Market Analysis, Insights and Forecast - by Types
- 8.2.1. Pressure Sensor
- 8.2.2. Environmental Sensor
- 8.2.3. Optical Sensor
- 8.2.4. Chemical Sensor
- 8.2.5. Motion Sensor
- 8.2.6. Others
- 8.1. Market Analysis, Insights and Forecast - by Application
- 9. Europe Industrial IoT Sensors Analysis, Insights and Forecast, 2020-2032
- 9.1. Market Analysis, Insights and Forecast - by Application
- 9.1.1. Energy & Power
- 9.1.2. Oil & Gas
- 9.1.3. Mining
- 9.1.4. Chemical
- 9.1.5. Manufacturing
- 9.1.6. Others
- 9.2. Market Analysis, Insights and Forecast - by Types
- 9.2.1. Pressure Sensor
- 9.2.2. Environmental Sensor
- 9.2.3. Optical Sensor
- 9.2.4. Chemical Sensor
- 9.2.5. Motion Sensor
- 9.2.6. Others
- 9.1. Market Analysis, Insights and Forecast - by Application
- 10. Middle East & Africa Industrial IoT Sensors Analysis, Insights and Forecast, 2020-2032
- 10.1. Market Analysis, Insights and Forecast - by Application
- 10.1.1. Energy & Power
- 10.1.2. Oil & Gas
- 10.1.3. Mining
- 10.1.4. Chemical
- 10.1.5. Manufacturing
- 10.1.6. Others
- 10.2. Market Analysis, Insights and Forecast - by Types
- 10.2.1. Pressure Sensor
- 10.2.2. Environmental Sensor
- 10.2.3. Optical Sensor
- 10.2.4. Chemical Sensor
- 10.2.5. Motion Sensor
- 10.2.6. Others
- 10.1. Market Analysis, Insights and Forecast - by Application
- 11. Asia Pacific Industrial IoT Sensors Analysis, Insights and Forecast, 2020-2032
- 11.1. Market Analysis, Insights and Forecast - by Application
- 11.1.1. Energy & Power
- 11.1.2. Oil & Gas
- 11.1.3. Mining
- 11.1.4. Chemical
- 11.1.5. Manufacturing
- 11.1.6. Others
- 11.2. Market Analysis, Insights and Forecast - by Types
- 11.2.1. Pressure Sensor
- 11.2.2. Environmental Sensor
- 11.2.3. Optical Sensor
- 11.2.4. Chemical Sensor
- 11.2.5. Motion Sensor
- 11.2.6. Others
- 11.1. Market Analysis, Insights and Forecast - by Application
- 12. Competitive Analysis
- 12.1. Company Profiles
- 12.1.1 Bosch
- 12.1.1.1. Company Overview
- 12.1.1.2. Products
- 12.1.1.3. Company Financials
- 12.1.1.4. SWOT Analysis
- 12.1.2 Honeywell
- 12.1.2.1. Company Overview
- 12.1.2.2. Products
- 12.1.2.3. Company Financials
- 12.1.2.4. SWOT Analysis
- 12.1.3 NXP
- 12.1.3.1. Company Overview
- 12.1.3.2. Products
- 12.1.3.3. Company Financials
- 12.1.3.4. SWOT Analysis
- 12.1.4 Infineon
- 12.1.4.1. Company Overview
- 12.1.4.2. Products
- 12.1.4.3. Company Financials
- 12.1.4.4. SWOT Analysis
- 12.1.5 Analog Devices
- 12.1.5.1. Company Overview
- 12.1.5.2. Products
- 12.1.5.3. Company Financials
- 12.1.5.4. SWOT Analysis
- 12.1.6 Panasonic
- 12.1.6.1. Company Overview
- 12.1.6.2. Products
- 12.1.6.3. Company Financials
- 12.1.6.4. SWOT Analysis
- 12.1.7 InvenSense
- 12.1.7.1. Company Overview
- 12.1.7.2. Products
- 12.1.7.3. Company Financials
- 12.1.7.4. SWOT Analysis
- 12.1.8 TI
- 12.1.8.1. Company Overview
- 12.1.8.2. Products
- 12.1.8.3. Company Financials
- 12.1.8.4. SWOT Analysis
- 12.1.9 Silicon Laboratories
- 12.1.9.1. Company Overview
- 12.1.9.2. Products
- 12.1.9.3. Company Financials
- 12.1.9.4. SWOT Analysis
- 12.1.10 ABB
- 12.1.10.1. Company Overview
- 12.1.10.2. Products
- 12.1.10.3. Company Financials
- 12.1.10.4. SWOT Analysis
- 12.1.11 STMicroelectronics
- 12.1.11.1. Company Overview
- 12.1.11.2. Products
- 12.1.11.3. Company Financials
- 12.1.11.4. SWOT Analysis
- 12.1.12 TE Connectivity
- 12.1.12.1. Company Overview
- 12.1.12.2. Products
- 12.1.12.3. Company Financials
- 12.1.12.4. SWOT Analysis
- 12.1.13 Huagong Tech
- 12.1.13.1. Company Overview
- 12.1.13.2. Products
- 12.1.13.3. Company Financials
- 12.1.13.4. SWOT Analysis
- 12.1.14 Sensirion
- 12.1.14.1. Company Overview
- 12.1.14.2. Products
- 12.1.14.3. Company Financials
- 12.1.14.4. SWOT Analysis
- 12.1.15 Zhonghang Electronic Measuring Instruments
- 12.1.15.1. Company Overview
- 12.1.15.2. Products
- 12.1.15.3. Company Financials
- 12.1.15.4. SWOT Analysis
- 12.1.16 Vishay
- 12.1.16.1. Company Overview
- 12.1.16.2. Products
- 12.1.16.3. Company Financials
- 12.1.16.4. SWOT Analysis
- 12.1.17 Hanwei Electronics
- 12.1.17.1. Company Overview
- 12.1.17.2. Products
- 12.1.17.3. Company Financials
- 12.1.17.4. SWOT Analysis
- 12.1.18 Semtech
- 12.1.18.1. Company Overview
- 12.1.18.2. Products
- 12.1.18.3. Company Financials
- 12.1.18.4. SWOT Analysis
- 12.1.19 Omron
- 12.1.19.1. Company Overview
- 12.1.19.2. Products
- 12.1.19.3. Company Financials
- 12.1.19.4. SWOT Analysis
- 12.1.1 Bosch
- 12.2. Market Entropy
- 12.2.1 Company's Key Areas Served
- 12.2.2 Recent Developments
- 12.3. Company Market Share Analysis 2025
- 12.3.1 Top 5 Companies Market Share Analysis
- 12.3.2 Top 3 Companies Market Share Analysis
- 12.4. List of Potential Customers
- 13. Research Methodology
List of Figures
- Figure 1: Global Industrial IoT Sensors Revenue Breakdown (billion, %) by Region 2025 & 2033
- Figure 2: Global Industrial IoT Sensors Volume Breakdown (K, %) by Region 2025 & 2033
- Figure 3: North America Industrial IoT Sensors Revenue (billion), by Application 2025 & 2033
- Figure 4: North America Industrial IoT Sensors Volume (K), by Application 2025 & 2033
- Figure 5: North America Industrial IoT Sensors Revenue Share (%), by Application 2025 & 2033
- Figure 6: North America Industrial IoT Sensors Volume Share (%), by Application 2025 & 2033
- Figure 7: North America Industrial IoT Sensors Revenue (billion), by Types 2025 & 2033
- Figure 8: North America Industrial IoT Sensors Volume (K), by Types 2025 & 2033
- Figure 9: North America Industrial IoT Sensors Revenue Share (%), by Types 2025 & 2033
- Figure 10: North America Industrial IoT Sensors Volume Share (%), by Types 2025 & 2033
- Figure 11: North America Industrial IoT Sensors Revenue (billion), by Country 2025 & 2033
- Figure 12: North America Industrial IoT Sensors Volume (K), by Country 2025 & 2033
- Figure 13: North America Industrial IoT Sensors Revenue Share (%), by Country 2025 & 2033
- Figure 14: North America Industrial IoT Sensors Volume Share (%), by Country 2025 & 2033
- Figure 15: South America Industrial IoT Sensors Revenue (billion), by Application 2025 & 2033
- Figure 16: South America Industrial IoT Sensors Volume (K), by Application 2025 & 2033
- Figure 17: South America Industrial IoT Sensors Revenue Share (%), by Application 2025 & 2033
- Figure 18: South America Industrial IoT Sensors Volume Share (%), by Application 2025 & 2033
- Figure 19: South America Industrial IoT Sensors Revenue (billion), by Types 2025 & 2033
- Figure 20: South America Industrial IoT Sensors Volume (K), by Types 2025 & 2033
- Figure 21: South America Industrial IoT Sensors Revenue Share (%), by Types 2025 & 2033
- Figure 22: South America Industrial IoT Sensors Volume Share (%), by Types 2025 & 2033
- Figure 23: South America Industrial IoT Sensors Revenue (billion), by Country 2025 & 2033
- Figure 24: South America Industrial IoT Sensors Volume (K), by Country 2025 & 2033
- Figure 25: South America Industrial IoT Sensors Revenue Share (%), by Country 2025 & 2033
- Figure 26: South America Industrial IoT Sensors Volume Share (%), by Country 2025 & 2033
- Figure 27: Europe Industrial IoT Sensors Revenue (billion), by Application 2025 & 2033
- Figure 28: Europe Industrial IoT Sensors Volume (K), by Application 2025 & 2033
- Figure 29: Europe Industrial IoT Sensors Revenue Share (%), by Application 2025 & 2033
- Figure 30: Europe Industrial IoT Sensors Volume Share (%), by Application 2025 & 2033
- Figure 31: Europe Industrial IoT Sensors Revenue (billion), by Types 2025 & 2033
- Figure 32: Europe Industrial IoT Sensors Volume (K), by Types 2025 & 2033
- Figure 33: Europe Industrial IoT Sensors Revenue Share (%), by Types 2025 & 2033
- Figure 34: Europe Industrial IoT Sensors Volume Share (%), by Types 2025 & 2033
- Figure 35: Europe Industrial IoT Sensors Revenue (billion), by Country 2025 & 2033
- Figure 36: Europe Industrial IoT Sensors Volume (K), by Country 2025 & 2033
- Figure 37: Europe Industrial IoT Sensors Revenue Share (%), by Country 2025 & 2033
- Figure 38: Europe Industrial IoT Sensors Volume Share (%), by Country 2025 & 2033
- Figure 39: Middle East & Africa Industrial IoT Sensors Revenue (billion), by Application 2025 & 2033
- Figure 40: Middle East & Africa Industrial IoT Sensors Volume (K), by Application 2025 & 2033
- Figure 41: Middle East & Africa Industrial IoT Sensors Revenue Share (%), by Application 2025 & 2033
- Figure 42: Middle East & Africa Industrial IoT Sensors Volume Share (%), by Application 2025 & 2033
- Figure 43: Middle East & Africa Industrial IoT Sensors Revenue (billion), by Types 2025 & 2033
- Figure 44: Middle East & Africa Industrial IoT Sensors Volume (K), by Types 2025 & 2033
- Figure 45: Middle East & Africa Industrial IoT Sensors Revenue Share (%), by Types 2025 & 2033
- Figure 46: Middle East & Africa Industrial IoT Sensors Volume Share (%), by Types 2025 & 2033
- Figure 47: Middle East & Africa Industrial IoT Sensors Revenue (billion), by Country 2025 & 2033
- Figure 48: Middle East & Africa Industrial IoT Sensors Volume (K), by Country 2025 & 2033
- Figure 49: Middle East & Africa Industrial IoT Sensors Revenue Share (%), by Country 2025 & 2033
- Figure 50: Middle East & Africa Industrial IoT Sensors Volume Share (%), by Country 2025 & 2033
- Figure 51: Asia Pacific Industrial IoT Sensors Revenue (billion), by Application 2025 & 2033
- Figure 52: Asia Pacific Industrial IoT Sensors Volume (K), by Application 2025 & 2033
- Figure 53: Asia Pacific Industrial IoT Sensors Revenue Share (%), by Application 2025 & 2033
- Figure 54: Asia Pacific Industrial IoT Sensors Volume Share (%), by Application 2025 & 2033
- Figure 55: Asia Pacific Industrial IoT Sensors Revenue (billion), by Types 2025 & 2033
- Figure 56: Asia Pacific Industrial IoT Sensors Volume (K), by Types 2025 & 2033
- Figure 57: Asia Pacific Industrial IoT Sensors Revenue Share (%), by Types 2025 & 2033
- Figure 58: Asia Pacific Industrial IoT Sensors Volume Share (%), by Types 2025 & 2033
- Figure 59: Asia Pacific Industrial IoT Sensors Revenue (billion), by Country 2025 & 2033
- Figure 60: Asia Pacific Industrial IoT Sensors Volume (K), by Country 2025 & 2033
- Figure 61: Asia Pacific Industrial IoT Sensors Revenue Share (%), by Country 2025 & 2033
- Figure 62: Asia Pacific Industrial IoT Sensors Volume Share (%), by Country 2025 & 2033
List of Tables
- Table 1: Global Industrial IoT Sensors Revenue billion Forecast, by Application 2020 & 2033
- Table 2: Global Industrial IoT Sensors Volume K Forecast, by Application 2020 & 2033
- Table 3: Global Industrial IoT Sensors Revenue billion Forecast, by Types 2020 & 2033
- Table 4: Global Industrial IoT Sensors Volume K Forecast, by Types 2020 & 2033
- Table 5: Global Industrial IoT Sensors Revenue billion Forecast, by Region 2020 & 2033
- Table 6: Global Industrial IoT Sensors Volume K Forecast, by Region 2020 & 2033
- Table 7: Global Industrial IoT Sensors Revenue billion Forecast, by Application 2020 & 2033
- Table 8: Global Industrial IoT Sensors Volume K Forecast, by Application 2020 & 2033
- Table 9: Global Industrial IoT Sensors Revenue billion Forecast, by Types 2020 & 2033
- Table 10: Global Industrial IoT Sensors Volume K Forecast, by Types 2020 & 2033
- Table 11: Global Industrial IoT Sensors Revenue billion Forecast, by Country 2020 & 2033
- Table 12: Global Industrial IoT Sensors Volume K Forecast, by Country 2020 & 2033
- Table 13: United States Industrial IoT Sensors Revenue (billion) Forecast, by Application 2020 & 2033
- Table 14: United States Industrial IoT Sensors Volume (K) Forecast, by Application 2020 & 2033
- Table 15: Canada Industrial IoT Sensors Revenue (billion) Forecast, by Application 2020 & 2033
- Table 16: Canada Industrial IoT Sensors Volume (K) Forecast, by Application 2020 & 2033
- Table 17: Mexico Industrial IoT Sensors Revenue (billion) Forecast, by Application 2020 & 2033
- Table 18: Mexico Industrial IoT Sensors Volume (K) Forecast, by Application 2020 & 2033
- Table 19: Global Industrial IoT Sensors Revenue billion Forecast, by Application 2020 & 2033
- Table 20: Global Industrial IoT Sensors Volume K Forecast, by Application 2020 & 2033
- Table 21: Global Industrial IoT Sensors Revenue billion Forecast, by Types 2020 & 2033
- Table 22: Global Industrial IoT Sensors Volume K Forecast, by Types 2020 & 2033
- Table 23: Global Industrial IoT Sensors Revenue billion Forecast, by Country 2020 & 2033
- Table 24: Global Industrial IoT Sensors Volume K Forecast, by Country 2020 & 2033
- Table 25: Brazil Industrial IoT Sensors Revenue (billion) Forecast, by Application 2020 & 2033
- Table 26: Brazil Industrial IoT Sensors Volume (K) Forecast, by Application 2020 & 2033
- Table 27: Argentina Industrial IoT Sensors Revenue (billion) Forecast, by Application 2020 & 2033
- Table 28: Argentina Industrial IoT Sensors Volume (K) Forecast, by Application 2020 & 2033
- Table 29: Rest of South America Industrial IoT Sensors Revenue (billion) Forecast, by Application 2020 & 2033
- Table 30: Rest of South America Industrial IoT Sensors Volume (K) Forecast, by Application 2020 & 2033
- Table 31: Global Industrial IoT Sensors Revenue billion Forecast, by Application 2020 & 2033
- Table 32: Global Industrial IoT Sensors Volume K Forecast, by Application 2020 & 2033
- Table 33: Global Industrial IoT Sensors Revenue billion Forecast, by Types 2020 & 2033
- Table 34: Global Industrial IoT Sensors Volume K Forecast, by Types 2020 & 2033
- Table 35: Global Industrial IoT Sensors Revenue billion Forecast, by Country 2020 & 2033
- Table 36: Global Industrial IoT Sensors Volume K Forecast, by Country 2020 & 2033
- Table 37: United Kingdom Industrial IoT Sensors Revenue (billion) Forecast, by Application 2020 & 2033
- Table 38: United Kingdom Industrial IoT Sensors Volume (K) Forecast, by Application 2020 & 2033
- Table 39: Germany Industrial IoT Sensors Revenue (billion) Forecast, by Application 2020 & 2033
- Table 40: Germany Industrial IoT Sensors Volume (K) Forecast, by Application 2020 & 2033
- Table 41: France Industrial IoT Sensors Revenue (billion) Forecast, by Application 2020 & 2033
- Table 42: France Industrial IoT Sensors Volume (K) Forecast, by Application 2020 & 2033
- Table 43: Italy Industrial IoT Sensors Revenue (billion) Forecast, by Application 2020 & 2033
- Table 44: Italy Industrial IoT Sensors Volume (K) Forecast, by Application 2020 & 2033
- Table 45: Spain Industrial IoT Sensors Revenue (billion) Forecast, by Application 2020 & 2033
- Table 46: Spain Industrial IoT Sensors Volume (K) Forecast, by Application 2020 & 2033
- Table 47: Russia Industrial IoT Sensors Revenue (billion) Forecast, by Application 2020 & 2033
- Table 48: Russia Industrial IoT Sensors Volume (K) Forecast, by Application 2020 & 2033
- Table 49: Benelux Industrial IoT Sensors Revenue (billion) Forecast, by Application 2020 & 2033
- Table 50: Benelux Industrial IoT Sensors Volume (K) Forecast, by Application 2020 & 2033
- Table 51: Nordics Industrial IoT Sensors Revenue (billion) Forecast, by Application 2020 & 2033
- Table 52: Nordics Industrial IoT Sensors Volume (K) Forecast, by Application 2020 & 2033
- Table 53: Rest of Europe Industrial IoT Sensors Revenue (billion) Forecast, by Application 2020 & 2033
- Table 54: Rest of Europe Industrial IoT Sensors Volume (K) Forecast, by Application 2020 & 2033
- Table 55: Global Industrial IoT Sensors Revenue billion Forecast, by Application 2020 & 2033
- Table 56: Global Industrial IoT Sensors Volume K Forecast, by Application 2020 & 2033
- Table 57: Global Industrial IoT Sensors Revenue billion Forecast, by Types 2020 & 2033
- Table 58: Global Industrial IoT Sensors Volume K Forecast, by Types 2020 & 2033
- Table 59: Global Industrial IoT Sensors Revenue billion Forecast, by Country 2020 & 2033
- Table 60: Global Industrial IoT Sensors Volume K Forecast, by Country 2020 & 2033
- Table 61: Turkey Industrial IoT Sensors Revenue (billion) Forecast, by Application 2020 & 2033
- Table 62: Turkey Industrial IoT Sensors Volume (K) Forecast, by Application 2020 & 2033
- Table 63: Israel Industrial IoT Sensors Revenue (billion) Forecast, by Application 2020 & 2033
- Table 64: Israel Industrial IoT Sensors Volume (K) Forecast, by Application 2020 & 2033
- Table 65: GCC Industrial IoT Sensors Revenue (billion) Forecast, by Application 2020 & 2033
- Table 66: GCC Industrial IoT Sensors Volume (K) Forecast, by Application 2020 & 2033
- Table 67: North Africa Industrial IoT Sensors Revenue (billion) Forecast, by Application 2020 & 2033
- Table 68: North Africa Industrial IoT Sensors Volume (K) Forecast, by Application 2020 & 2033
- Table 69: South Africa Industrial IoT Sensors Revenue (billion) Forecast, by Application 2020 & 2033
- Table 70: South Africa Industrial IoT Sensors Volume (K) Forecast, by Application 2020 & 2033
- Table 71: Rest of Middle East & Africa Industrial IoT Sensors Revenue (billion) Forecast, by Application 2020 & 2033
- Table 72: Rest of Middle East & Africa Industrial IoT Sensors Volume (K) Forecast, by Application 2020 & 2033
- Table 73: Global Industrial IoT Sensors Revenue billion Forecast, by Application 2020 & 2033
- Table 74: Global Industrial IoT Sensors Volume K Forecast, by Application 2020 & 2033
- Table 75: Global Industrial IoT Sensors Revenue billion Forecast, by Types 2020 & 2033
- Table 76: Global Industrial IoT Sensors Volume K Forecast, by Types 2020 & 2033
- Table 77: Global Industrial IoT Sensors Revenue billion Forecast, by Country 2020 & 2033
- Table 78: Global Industrial IoT Sensors Volume K Forecast, by Country 2020 & 2033
- Table 79: China Industrial IoT Sensors Revenue (billion) Forecast, by Application 2020 & 2033
- Table 80: China Industrial IoT Sensors Volume (K) Forecast, by Application 2020 & 2033
- Table 81: India Industrial IoT Sensors Revenue (billion) Forecast, by Application 2020 & 2033
- Table 82: India Industrial IoT Sensors Volume (K) Forecast, by Application 2020 & 2033
- Table 83: Japan Industrial IoT Sensors Revenue (billion) Forecast, by Application 2020 & 2033
- Table 84: Japan Industrial IoT Sensors Volume (K) Forecast, by Application 2020 & 2033
- Table 85: South Korea Industrial IoT Sensors Revenue (billion) Forecast, by Application 2020 & 2033
- Table 86: South Korea Industrial IoT Sensors Volume (K) Forecast, by Application 2020 & 2033
- Table 87: ASEAN Industrial IoT Sensors Revenue (billion) Forecast, by Application 2020 & 2033
- Table 88: ASEAN Industrial IoT Sensors Volume (K) Forecast, by Application 2020 & 2033
- Table 89: Oceania Industrial IoT Sensors Revenue (billion) Forecast, by Application 2020 & 2033
- Table 90: Oceania Industrial IoT Sensors Volume (K) Forecast, by Application 2020 & 2033
- Table 91: Rest of Asia Pacific Industrial IoT Sensors Revenue (billion) Forecast, by Application 2020 & 2033
- Table 92: Rest of Asia Pacific Industrial IoT Sensors Volume (K) Forecast, by Application 2020 & 2033
Frequently Asked Questions
1. What is the projected Compound Annual Growth Rate (CAGR) of the Industrial IoT Sensors?
The projected CAGR is approximately 27.9%.
2. Which companies are prominent players in the Industrial IoT Sensors?
Key companies in the market include Bosch, Honeywell, NXP, Infineon, Analog Devices, Panasonic, InvenSense, TI, Silicon Laboratories, ABB, STMicroelectronics, TE Connectivity, Huagong Tech, Sensirion, Zhonghang Electronic Measuring Instruments, Vishay, Hanwei Electronics, Semtech, Omron.
3. What are the main segments of the Industrial IoT Sensors?
The market segments include Application, Types.
4. Can you provide details about the market size?
The market size is estimated to be USD 21.5 billion as of 2022.
5. What are some drivers contributing to market growth?
N/A
6. What are the notable trends driving market growth?
N/A
7. Are there any restraints impacting market growth?
N/A
8. Can you provide examples of recent developments in the market?
N/A
9. What pricing options are available for accessing the report?
Pricing options include single-user, multi-user, and enterprise licenses priced at USD 3350.00, USD 5025.00, and USD 6700.00 respectively.
10. Is the market size provided in terms of value or volume?
The market size is provided in terms of value, measured in billion and volume, measured in K.
11. Are there any specific market keywords associated with the report?
Yes, the market keyword associated with the report is "Industrial IoT Sensors," which aids in identifying and referencing the specific market segment covered.
12. How do I determine which pricing option suits my needs best?
The pricing options vary based on user requirements and access needs. Individual users may opt for single-user licenses, while businesses requiring broader access may choose multi-user or enterprise licenses for cost-effective access to the report.
13. Are there any additional resources or data provided in the Industrial IoT Sensors report?
While the report offers comprehensive insights, it's advisable to review the specific contents or supplementary materials provided to ascertain if additional resources or data are available.
14. How can I stay updated on further developments or reports in the Industrial IoT Sensors?
To stay informed about further developments, trends, and reports in the Industrial IoT Sensors, consider subscribing to industry newsletters, following relevant companies and organizations, or regularly checking reputable industry news sources and publications.
Methodology
Step 1 - Identification of Relevant Samples Size from Population Database


Step 2 - Approaches for Defining Global Market Size (Value, Volume* & Price*)

Note*: In applicable scenarios
Step 3 - Data Sources
Primary Research
- Web Analytics
- Survey Reports
- Research Institute
- Latest Research Reports
- Opinion Leaders
Secondary Research
- Annual Reports
- White Paper
- Latest Press Release
- Industry Association
- Paid Database
- Investor Presentations

Step 4 - Data Triangulation
Involves using different sources of information in order to increase the validity of a study
These sources are likely to be stakeholders in a program - participants, other researchers, program staff, other community members, and so on.
Then we put all data in single framework & apply various statistical tools to find out the dynamic on the market.
During the analysis stage, feedback from the stakeholder groups would be compared to determine areas of agreement as well as areas of divergence