

Key Insights
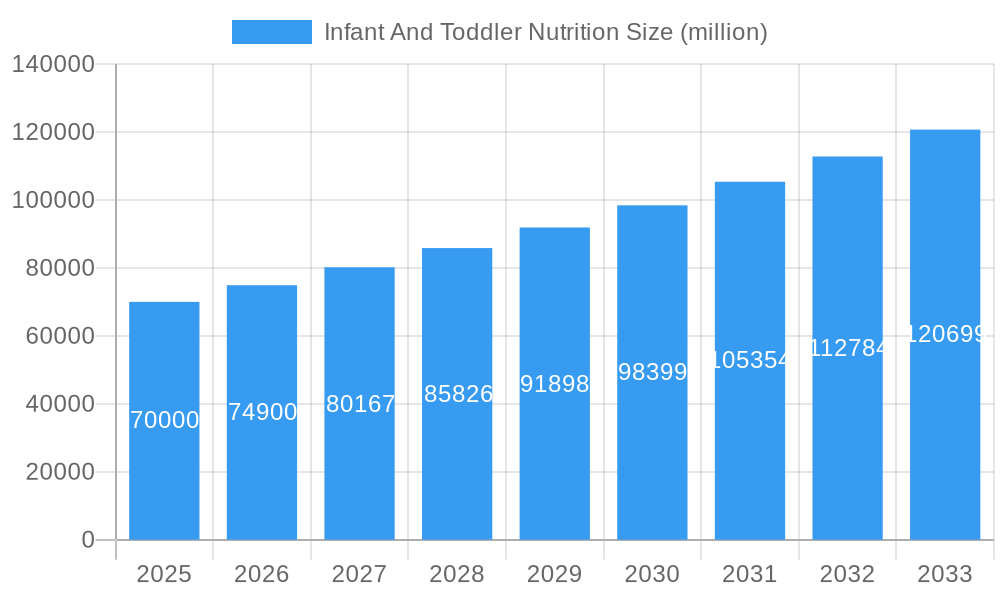
The infant and toddler nutrition market is a dynamic and rapidly growing sector, fueled by increasing awareness of the importance of early childhood nutrition and the rising disposable incomes in developing economies. The market, which we estimate to be valued at approximately $70 billion in 2025, is projected to experience a Compound Annual Growth Rate (CAGR) of 7% between 2025 and 2033. This robust growth is driven by several key factors, including the increasing prevalence of working mothers leading to a higher demand for convenient and nutritious products, the growing popularity of organic and specialized formulas catering to specific dietary needs and allergies, and a heightened focus on early brain development and cognitive function through optimized nutrition. Furthermore, advancements in research and technology are constantly improving formula compositions and offering a wider range of options for parents.
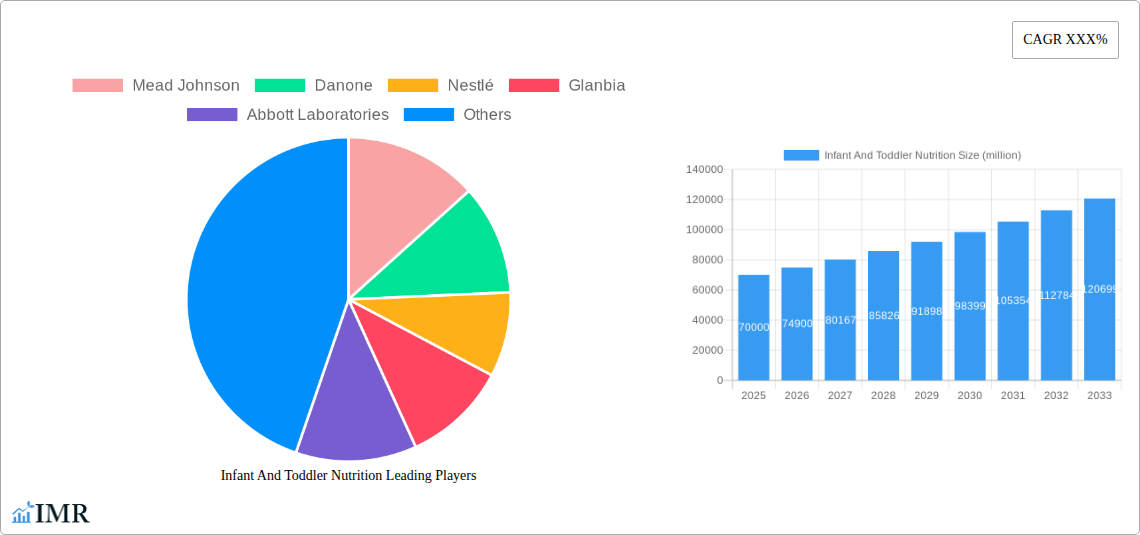
Infant And Toddler Nutrition Market Size (In Billion)
Major market players such as Nestlé, Danone, Abbott Laboratories, and Mead Johnson hold significant market share, driving innovation and competition. However, the market also sees the emergence of smaller brands focusing on niche segments like organic and specialized formulas, reflecting the growing consumer preference for natural and allergen-free products. Despite the positive outlook, challenges remain, including stringent regulations surrounding formula composition and safety, fluctuating raw material prices, and the potential impact of economic downturns on consumer spending. Future growth will depend on continuous innovation, effective marketing strategies targeting health-conscious parents, and a focus on sustainable sourcing and environmentally friendly packaging practices. The market is segmented based on product type (formula, baby food, etc.), distribution channel (online, offline), and geography. The Asia-Pacific region is expected to show the most significant growth due to increasing birth rates and rising disposable incomes.
Infant And Toddler Nutrition Company Market Share
Infant and Toddler Nutrition Market Report: 2019-2033
This comprehensive report provides an in-depth analysis of the infant and toddler nutrition market, offering invaluable insights for industry professionals, investors, and parents seeking to understand this dynamic sector. The study period spans from 2019 to 2033, with a base year of 2025 and a forecast period of 2025-2033. The report leverages extensive data and research to provide a clear picture of market trends, competitive landscapes, and future growth potential within the parent and child market. The market value is predicted to reach xx million by 2033.
Infant And Toddler Nutrition Market Dynamics & Structure
This section analyzes the market's competitive landscape, technological advancements, regulatory influences, and market dynamics. We delve into the interplay of factors shaping this multi-billion dollar industry, including market concentration, M&A activity, and evolving consumer preferences within the parent and child market segment.
Market Concentration: The market is moderately concentrated, with key players like Nestlé, Danone, and Abbott Laboratories holding significant market share. In 2025, these three companies are estimated to hold a combined xx% market share. However, smaller players and regional brands are gaining traction, driving competitive intensity.
Technological Innovation: Technological advancements are impacting formulation, packaging, and distribution, enhancing product safety and convenience. Key innovations include improved nutrient delivery systems, personalized nutrition solutions, and sustainable packaging options.
Regulatory Framework: Stringent regulations regarding product safety and labeling vary across regions, posing both challenges and opportunities for manufacturers. Compliance costs and differing standards impact market entry strategies.
Competitive Product Substitutes: Breast milk substitutes and homemade options present competitive pressures, influencing market growth. Consumer preferences and awareness campaigns play a crucial role in the market share of different product offerings.
End-User Demographics: Growing urban populations, increasing disposable incomes, and changing lifestyles are major drivers of market growth. These factors are significantly impacting the demand for convenient and high-quality infant and toddler nutrition products.
M&A Trends: The infant and toddler nutrition market witnesses frequent mergers and acquisitions. In the period 2019-2024, there were approximately xx M&A deals, primarily driven by market consolidation and expansion strategies. This trend is expected to continue, increasing concentration amongst major market players.
Infant And Toddler Nutrition Growth Trends & Insights
This section details the market's historical and projected growth trajectory. We analyze market size evolution, adoption rates, and factors impacting growth.
The infant and toddler nutrition market experienced substantial growth during the historical period (2019-2024), with a CAGR of xx%. This growth is attributed to increasing awareness of nutritional needs, rising disposable incomes, particularly in developing economies, and the increasing number of working mothers. Market penetration for specialized infant formulas (e.g., hypoallergenic) has seen significant growth, exceeding xx% in some developed nations. Technological disruptions, such as the introduction of personalized nutrition solutions, are poised to further drive market expansion. Consumer behavior is shifting toward premium products emphasizing organic ingredients, sustainable practices, and added health benefits. The projected CAGR for the forecast period (2025-2033) is expected to be xx%.
Dominant Regions, Countries, or Segments in Infant And Toddler Nutrition
This section pinpoints the regions and segments driving market growth, exploring the underlying factors contributing to their dominance.
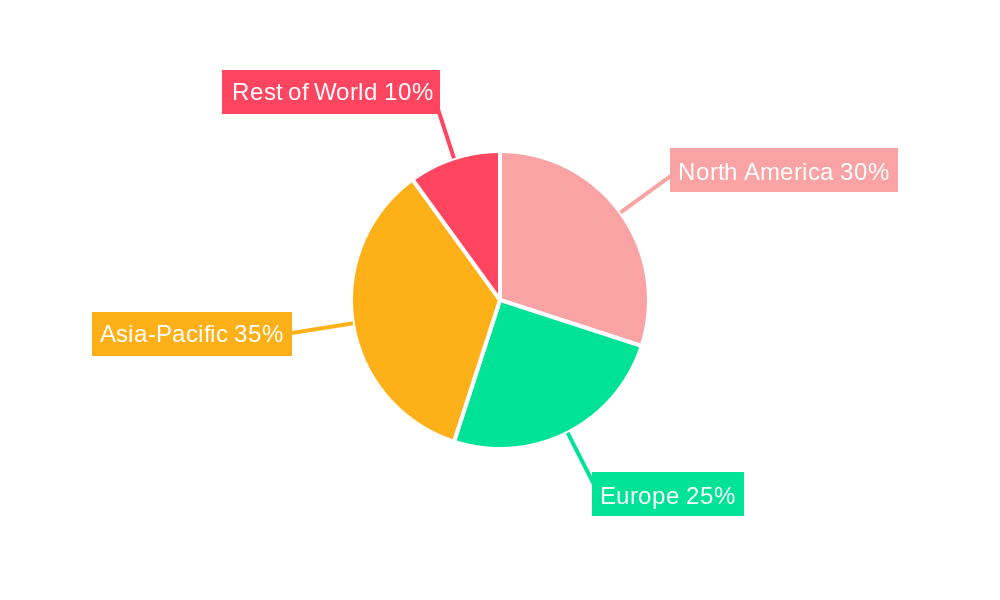
North America: The region continues to be a significant market, fueled by high disposable incomes, a strong focus on health and wellness, and rising awareness of the benefits of specialized nutrition. However, growth is expected to slow compared to other regions.
Asia-Pacific: This region displays the most rapid growth, driven by expanding populations, increasing urbanization, and rising middle-class incomes. China and India are major contributors to this regional growth, as increasing disposable incomes fuel the demand for premium products.
Europe: This market presents moderate growth potential, with a focus on organic and specialized products. Stringent regulations and mature market conditions pose challenges to rapid expansion.
Key Drivers:
- Rising disposable incomes in emerging economies.
- Increased awareness of infant and toddler nutritional requirements.
- Growing preference for convenient and ready-to-feed products.
- Government initiatives promoting child health and nutrition.
Infant And Toddler Nutrition Product Landscape
The product landscape encompasses a wide range of products catering to different nutritional needs and age groups. Innovations focus on enhanced nutrient bioavailability, improved taste and texture, and convenient packaging. For example, the introduction of organic and hypoallergenic formulas, alongside specialized products addressing specific dietary requirements, have broadened product offerings. These developments are driven by increasing consumer demands and stringent regulatory requirements. Performance metrics include product safety, nutrient content, and digestibility. Unique selling propositions center around organic certifications, clinically proven benefits, and sustainable practices.
Key Drivers, Barriers & Challenges in Infant And Toddler Nutrition
Key Drivers:
The increasing awareness about the importance of nutrition for optimal infant and toddler development is a primary driver. Government initiatives and public health campaigns promoting breastfeeding and proper nutrition contribute significantly. Furthermore, the expansion of the middle class in developing nations fuels market growth.
Key Challenges:
Stringent regulations and safety standards create compliance hurdles. Fluctuations in raw material prices pose significant challenges to manufacturers, potentially impacting product pricing. Supply chain disruptions, particularly for specialized ingredients, can lead to shortages and increased production costs.
Emerging Opportunities in Infant And Toddler Nutrition
Emerging opportunities lie in expanding into untapped markets in developing countries and the introduction of personalized nutrition solutions. The increasing demand for organic and sustainable products, catering to eco-conscious consumers, presents a significant growth opportunity.
Growth Accelerators in the Infant And Toddler Nutrition Industry
Strategic partnerships between manufacturers and healthcare providers will further accelerate market growth. Technological advancements in formulation and packaging will drive innovation and product differentiation. Expansion into emerging markets will unlock significant growth potential.
Key Players Shaping the Infant And Toddler Nutrition Market
- Mead Johnson
- Danone
- Nestlé
- Glanbia
- Abbott Laboratories
- Arla Foods
- Amara
- Baby Gourmet
- Beech-Nut
- Friso
- Healthy Sprouts Foods
- Hyproca Nutrition
- Kerry
- Kraft Foods
- Morinaga
- NurturMe
- Rafferty's Garden
Notable Milestones in Infant And Toddler Nutrition Sector
- 2020: Nestlé launches a new line of organic infant formula.
- 2021: Abbott Laboratories recalls several batches of infant formula due to safety concerns.
- 2022: Danone acquires a smaller organic baby food company.
- 2023: New regulations regarding the labeling of infant formula are implemented in the EU.
- 2024: Several key players invest in research and development for personalized nutrition solutions.
In-Depth Infant And Toddler Nutrition Market Outlook
The future of the infant and toddler nutrition market looks bright, fueled by continuous innovation, increasing consumer awareness, and the expansion of global markets. Opportunities abound for companies that can leverage technological advancements, adapt to changing consumer preferences, and navigate regulatory landscapes effectively. Strategic partnerships and investments in research and development will be crucial for sustained growth in this competitive yet dynamic sector.
Infant And Toddler Nutrition Segmentation
-
1. Application
- 1.1. Online Sales
- 1.2. Offline Sales
-
2. Type
- 2.1. Infant Formula
- 2.2. Baby Food
Infant And Toddler Nutrition Segmentation By Geography
-
1. North America
- 1.1. United States
- 1.2. Canada
- 1.3. Mexico
-
2. South America
- 2.1. Brazil
- 2.2. Argentina
- 2.3. Rest of South America
-
3. Europe
- 3.1. United Kingdom
- 3.2. Germany
- 3.3. France
- 3.4. Italy
- 3.5. Spain
- 3.6. Russia
- 3.7. Benelux
- 3.8. Nordics
- 3.9. Rest of Europe
-
4. Middle East & Africa
- 4.1. Turkey
- 4.2. Israel
- 4.3. GCC
- 4.4. North Africa
- 4.5. South Africa
- 4.6. Rest of Middle East & Africa
-
5. Asia Pacific
- 5.1. China
- 5.2. India
- 5.3. Japan
- 5.4. South Korea
- 5.5. ASEAN
- 5.6. Oceania
- 5.7. Rest of Asia Pacific
Infant And Toddler Nutrition Regional Market Share
Geographic Coverage of Infant And Toddler Nutrition
Infant And Toddler Nutrition REPORT HIGHLIGHTS
| Aspects | Details |
|---|---|
| Study Period | 2020-2034 |
| Base Year | 2025 |
| Estimated Year | 2026 |
| Forecast Period | 2026-2034 |
| Historical Period | 2020-2025 |
| Growth Rate | CAGR of XXX% from 2020-2034 |
| Segmentation |
|
Table of Contents
- 1. Introduction
- 1.1. Research Scope
- 1.2. Market Segmentation
- 1.3. Research Methodology
- 1.4. Definitions and Assumptions
- 2. Executive Summary
- 2.1. Introduction
- 3. Market Dynamics
- 3.1. Introduction
- 3.2. Market Drivers
- 3.3. Market Restrains
- 3.4. Market Trends
- 4. Market Factor Analysis
- 4.1. Porters Five Forces
- 4.2. Supply/Value Chain
- 4.3. PESTEL analysis
- 4.4. Market Entropy
- 4.5. Patent/Trademark Analysis
- 5. Global Infant And Toddler Nutrition Analysis, Insights and Forecast, 2020-2032
- 5.1. Market Analysis, Insights and Forecast - by Application
- 5.1.1. Online Sales
- 5.1.2. Offline Sales
- 5.2. Market Analysis, Insights and Forecast - by Type
- 5.2.1. Infant Formula
- 5.2.2. Baby Food
- 5.3. Market Analysis, Insights and Forecast - by Region
- 5.3.1. North America
- 5.3.2. South America
- 5.3.3. Europe
- 5.3.4. Middle East & Africa
- 5.3.5. Asia Pacific
- 5.1. Market Analysis, Insights and Forecast - by Application
- 6. North America Infant And Toddler Nutrition Analysis, Insights and Forecast, 2020-2032
- 6.1. Market Analysis, Insights and Forecast - by Application
- 6.1.1. Online Sales
- 6.1.2. Offline Sales
- 6.2. Market Analysis, Insights and Forecast - by Type
- 6.2.1. Infant Formula
- 6.2.2. Baby Food
- 6.1. Market Analysis, Insights and Forecast - by Application
- 7. South America Infant And Toddler Nutrition Analysis, Insights and Forecast, 2020-2032
- 7.1. Market Analysis, Insights and Forecast - by Application
- 7.1.1. Online Sales
- 7.1.2. Offline Sales
- 7.2. Market Analysis, Insights and Forecast - by Type
- 7.2.1. Infant Formula
- 7.2.2. Baby Food
- 7.1. Market Analysis, Insights and Forecast - by Application
- 8. Europe Infant And Toddler Nutrition Analysis, Insights and Forecast, 2020-2032
- 8.1. Market Analysis, Insights and Forecast - by Application
- 8.1.1. Online Sales
- 8.1.2. Offline Sales
- 8.2. Market Analysis, Insights and Forecast - by Type
- 8.2.1. Infant Formula
- 8.2.2. Baby Food
- 8.1. Market Analysis, Insights and Forecast - by Application
- 9. Middle East & Africa Infant And Toddler Nutrition Analysis, Insights and Forecast, 2020-2032
- 9.1. Market Analysis, Insights and Forecast - by Application
- 9.1.1. Online Sales
- 9.1.2. Offline Sales
- 9.2. Market Analysis, Insights and Forecast - by Type
- 9.2.1. Infant Formula
- 9.2.2. Baby Food
- 9.1. Market Analysis, Insights and Forecast - by Application
- 10. Asia Pacific Infant And Toddler Nutrition Analysis, Insights and Forecast, 2020-2032
- 10.1. Market Analysis, Insights and Forecast - by Application
- 10.1.1. Online Sales
- 10.1.2. Offline Sales
- 10.2. Market Analysis, Insights and Forecast - by Type
- 10.2.1. Infant Formula
- 10.2.2. Baby Food
- 10.1. Market Analysis, Insights and Forecast - by Application
- 11. Competitive Analysis
- 11.1. Global Market Share Analysis 2025
- 11.2. Company Profiles
- 11.2.1 Mead Johnson
- 11.2.1.1. Overview
- 11.2.1.2. Products
- 11.2.1.3. SWOT Analysis
- 11.2.1.4. Recent Developments
- 11.2.1.5. Financials (Based on Availability)
- 11.2.2 Danone
- 11.2.2.1. Overview
- 11.2.2.2. Products
- 11.2.2.3. SWOT Analysis
- 11.2.2.4. Recent Developments
- 11.2.2.5. Financials (Based on Availability)
- 11.2.3 Nestlé
- 11.2.3.1. Overview
- 11.2.3.2. Products
- 11.2.3.3. SWOT Analysis
- 11.2.3.4. Recent Developments
- 11.2.3.5. Financials (Based on Availability)
- 11.2.4 Glanbia
- 11.2.4.1. Overview
- 11.2.4.2. Products
- 11.2.4.3. SWOT Analysis
- 11.2.4.4. Recent Developments
- 11.2.4.5. Financials (Based on Availability)
- 11.2.5 Abbott Laboratories
- 11.2.5.1. Overview
- 11.2.5.2. Products
- 11.2.5.3. SWOT Analysis
- 11.2.5.4. Recent Developments
- 11.2.5.5. Financials (Based on Availability)
- 11.2.6 Arla Foods
- 11.2.6.1. Overview
- 11.2.6.2. Products
- 11.2.6.3. SWOT Analysis
- 11.2.6.4. Recent Developments
- 11.2.6.5. Financials (Based on Availability)
- 11.2.7 Amara
- 11.2.7.1. Overview
- 11.2.7.2. Products
- 11.2.7.3. SWOT Analysis
- 11.2.7.4. Recent Developments
- 11.2.7.5. Financials (Based on Availability)
- 11.2.8 Baby Gourmet
- 11.2.8.1. Overview
- 11.2.8.2. Products
- 11.2.8.3. SWOT Analysis
- 11.2.8.4. Recent Developments
- 11.2.8.5. Financials (Based on Availability)
- 11.2.9 Beech-Nut
- 11.2.9.1. Overview
- 11.2.9.2. Products
- 11.2.9.3. SWOT Analysis
- 11.2.9.4. Recent Developments
- 11.2.9.5. Financials (Based on Availability)
- 11.2.10 Friso
- 11.2.10.1. Overview
- 11.2.10.2. Products
- 11.2.10.3. SWOT Analysis
- 11.2.10.4. Recent Developments
- 11.2.10.5. Financials (Based on Availability)
- 11.2.11 Healthy Sprouts Foods
- 11.2.11.1. Overview
- 11.2.11.2. Products
- 11.2.11.3. SWOT Analysis
- 11.2.11.4. Recent Developments
- 11.2.11.5. Financials (Based on Availability)
- 11.2.12 Hyproca Nutrition
- 11.2.12.1. Overview
- 11.2.12.2. Products
- 11.2.12.3. SWOT Analysis
- 11.2.12.4. Recent Developments
- 11.2.12.5. Financials (Based on Availability)
- 11.2.13 Kerry
- 11.2.13.1. Overview
- 11.2.13.2. Products
- 11.2.13.3. SWOT Analysis
- 11.2.13.4. Recent Developments
- 11.2.13.5. Financials (Based on Availability)
- 11.2.14 Kraft Foods
- 11.2.14.1. Overview
- 11.2.14.2. Products
- 11.2.14.3. SWOT Analysis
- 11.2.14.4. Recent Developments
- 11.2.14.5. Financials (Based on Availability)
- 11.2.15 Morinaga
- 11.2.15.1. Overview
- 11.2.15.2. Products
- 11.2.15.3. SWOT Analysis
- 11.2.15.4. Recent Developments
- 11.2.15.5. Financials (Based on Availability)
- 11.2.16 NurturMe
- 11.2.16.1. Overview
- 11.2.16.2. Products
- 11.2.16.3. SWOT Analysis
- 11.2.16.4. Recent Developments
- 11.2.16.5. Financials (Based on Availability)
- 11.2.17 Rafferty's Garden
- 11.2.17.1. Overview
- 11.2.17.2. Products
- 11.2.17.3. SWOT Analysis
- 11.2.17.4. Recent Developments
- 11.2.17.5. Financials (Based on Availability)
- 11.2.1 Mead Johnson
List of Figures
- Figure 1: Global Infant And Toddler Nutrition Revenue Breakdown (million, %) by Region 2025 & 2033
- Figure 2: Global Infant And Toddler Nutrition Volume Breakdown (K, %) by Region 2025 & 2033
- Figure 3: North America Infant And Toddler Nutrition Revenue (million), by Application 2025 & 2033
- Figure 4: North America Infant And Toddler Nutrition Volume (K), by Application 2025 & 2033
- Figure 5: North America Infant And Toddler Nutrition Revenue Share (%), by Application 2025 & 2033
- Figure 6: North America Infant And Toddler Nutrition Volume Share (%), by Application 2025 & 2033
- Figure 7: North America Infant And Toddler Nutrition Revenue (million), by Type 2025 & 2033
- Figure 8: North America Infant And Toddler Nutrition Volume (K), by Type 2025 & 2033
- Figure 9: North America Infant And Toddler Nutrition Revenue Share (%), by Type 2025 & 2033
- Figure 10: North America Infant And Toddler Nutrition Volume Share (%), by Type 2025 & 2033
- Figure 11: North America Infant And Toddler Nutrition Revenue (million), by Country 2025 & 2033
- Figure 12: North America Infant And Toddler Nutrition Volume (K), by Country 2025 & 2033
- Figure 13: North America Infant And Toddler Nutrition Revenue Share (%), by Country 2025 & 2033
- Figure 14: North America Infant And Toddler Nutrition Volume Share (%), by Country 2025 & 2033
- Figure 15: South America Infant And Toddler Nutrition Revenue (million), by Application 2025 & 2033
- Figure 16: South America Infant And Toddler Nutrition Volume (K), by Application 2025 & 2033
- Figure 17: South America Infant And Toddler Nutrition Revenue Share (%), by Application 2025 & 2033
- Figure 18: South America Infant And Toddler Nutrition Volume Share (%), by Application 2025 & 2033
- Figure 19: South America Infant And Toddler Nutrition Revenue (million), by Type 2025 & 2033
- Figure 20: South America Infant And Toddler Nutrition Volume (K), by Type 2025 & 2033
- Figure 21: South America Infant And Toddler Nutrition Revenue Share (%), by Type 2025 & 2033
- Figure 22: South America Infant And Toddler Nutrition Volume Share (%), by Type 2025 & 2033
- Figure 23: South America Infant And Toddler Nutrition Revenue (million), by Country 2025 & 2033
- Figure 24: South America Infant And Toddler Nutrition Volume (K), by Country 2025 & 2033
- Figure 25: South America Infant And Toddler Nutrition Revenue Share (%), by Country 2025 & 2033
- Figure 26: South America Infant And Toddler Nutrition Volume Share (%), by Country 2025 & 2033
- Figure 27: Europe Infant And Toddler Nutrition Revenue (million), by Application 2025 & 2033
- Figure 28: Europe Infant And Toddler Nutrition Volume (K), by Application 2025 & 2033
- Figure 29: Europe Infant And Toddler Nutrition Revenue Share (%), by Application 2025 & 2033
- Figure 30: Europe Infant And Toddler Nutrition Volume Share (%), by Application 2025 & 2033
- Figure 31: Europe Infant And Toddler Nutrition Revenue (million), by Type 2025 & 2033
- Figure 32: Europe Infant And Toddler Nutrition Volume (K), by Type 2025 & 2033
- Figure 33: Europe Infant And Toddler Nutrition Revenue Share (%), by Type 2025 & 2033
- Figure 34: Europe Infant And Toddler Nutrition Volume Share (%), by Type 2025 & 2033
- Figure 35: Europe Infant And Toddler Nutrition Revenue (million), by Country 2025 & 2033
- Figure 36: Europe Infant And Toddler Nutrition Volume (K), by Country 2025 & 2033
- Figure 37: Europe Infant And Toddler Nutrition Revenue Share (%), by Country 2025 & 2033
- Figure 38: Europe Infant And Toddler Nutrition Volume Share (%), by Country 2025 & 2033
- Figure 39: Middle East & Africa Infant And Toddler Nutrition Revenue (million), by Application 2025 & 2033
- Figure 40: Middle East & Africa Infant And Toddler Nutrition Volume (K), by Application 2025 & 2033
- Figure 41: Middle East & Africa Infant And Toddler Nutrition Revenue Share (%), by Application 2025 & 2033
- Figure 42: Middle East & Africa Infant And Toddler Nutrition Volume Share (%), by Application 2025 & 2033
- Figure 43: Middle East & Africa Infant And Toddler Nutrition Revenue (million), by Type 2025 & 2033
- Figure 44: Middle East & Africa Infant And Toddler Nutrition Volume (K), by Type 2025 & 2033
- Figure 45: Middle East & Africa Infant And Toddler Nutrition Revenue Share (%), by Type 2025 & 2033
- Figure 46: Middle East & Africa Infant And Toddler Nutrition Volume Share (%), by Type 2025 & 2033
- Figure 47: Middle East & Africa Infant And Toddler Nutrition Revenue (million), by Country 2025 & 2033
- Figure 48: Middle East & Africa Infant And Toddler Nutrition Volume (K), by Country 2025 & 2033
- Figure 49: Middle East & Africa Infant And Toddler Nutrition Revenue Share (%), by Country 2025 & 2033
- Figure 50: Middle East & Africa Infant And Toddler Nutrition Volume Share (%), by Country 2025 & 2033
- Figure 51: Asia Pacific Infant And Toddler Nutrition Revenue (million), by Application 2025 & 2033
- Figure 52: Asia Pacific Infant And Toddler Nutrition Volume (K), by Application 2025 & 2033
- Figure 53: Asia Pacific Infant And Toddler Nutrition Revenue Share (%), by Application 2025 & 2033
- Figure 54: Asia Pacific Infant And Toddler Nutrition Volume Share (%), by Application 2025 & 2033
- Figure 55: Asia Pacific Infant And Toddler Nutrition Revenue (million), by Type 2025 & 2033
- Figure 56: Asia Pacific Infant And Toddler Nutrition Volume (K), by Type 2025 & 2033
- Figure 57: Asia Pacific Infant And Toddler Nutrition Revenue Share (%), by Type 2025 & 2033
- Figure 58: Asia Pacific Infant And Toddler Nutrition Volume Share (%), by Type 2025 & 2033
- Figure 59: Asia Pacific Infant And Toddler Nutrition Revenue (million), by Country 2025 & 2033
- Figure 60: Asia Pacific Infant And Toddler Nutrition Volume (K), by Country 2025 & 2033
- Figure 61: Asia Pacific Infant And Toddler Nutrition Revenue Share (%), by Country 2025 & 2033
- Figure 62: Asia Pacific Infant And Toddler Nutrition Volume Share (%), by Country 2025 & 2033
List of Tables
- Table 1: Global Infant And Toddler Nutrition Revenue million Forecast, by Application 2020 & 2033
- Table 2: Global Infant And Toddler Nutrition Volume K Forecast, by Application 2020 & 2033
- Table 3: Global Infant And Toddler Nutrition Revenue million Forecast, by Type 2020 & 2033
- Table 4: Global Infant And Toddler Nutrition Volume K Forecast, by Type 2020 & 2033
- Table 5: Global Infant And Toddler Nutrition Revenue million Forecast, by Region 2020 & 2033
- Table 6: Global Infant And Toddler Nutrition Volume K Forecast, by Region 2020 & 2033
- Table 7: Global Infant And Toddler Nutrition Revenue million Forecast, by Application 2020 & 2033
- Table 8: Global Infant And Toddler Nutrition Volume K Forecast, by Application 2020 & 2033
- Table 9: Global Infant And Toddler Nutrition Revenue million Forecast, by Type 2020 & 2033
- Table 10: Global Infant And Toddler Nutrition Volume K Forecast, by Type 2020 & 2033
- Table 11: Global Infant And Toddler Nutrition Revenue million Forecast, by Country 2020 & 2033
- Table 12: Global Infant And Toddler Nutrition Volume K Forecast, by Country 2020 & 2033
- Table 13: United States Infant And Toddler Nutrition Revenue (million) Forecast, by Application 2020 & 2033
- Table 14: United States Infant And Toddler Nutrition Volume (K) Forecast, by Application 2020 & 2033
- Table 15: Canada Infant And Toddler Nutrition Revenue (million) Forecast, by Application 2020 & 2033
- Table 16: Canada Infant And Toddler Nutrition Volume (K) Forecast, by Application 2020 & 2033
- Table 17: Mexico Infant And Toddler Nutrition Revenue (million) Forecast, by Application 2020 & 2033
- Table 18: Mexico Infant And Toddler Nutrition Volume (K) Forecast, by Application 2020 & 2033
- Table 19: Global Infant And Toddler Nutrition Revenue million Forecast, by Application 2020 & 2033
- Table 20: Global Infant And Toddler Nutrition Volume K Forecast, by Application 2020 & 2033
- Table 21: Global Infant And Toddler Nutrition Revenue million Forecast, by Type 2020 & 2033
- Table 22: Global Infant And Toddler Nutrition Volume K Forecast, by Type 2020 & 2033
- Table 23: Global Infant And Toddler Nutrition Revenue million Forecast, by Country 2020 & 2033
- Table 24: Global Infant And Toddler Nutrition Volume K Forecast, by Country 2020 & 2033
- Table 25: Brazil Infant And Toddler Nutrition Revenue (million) Forecast, by Application 2020 & 2033
- Table 26: Brazil Infant And Toddler Nutrition Volume (K) Forecast, by Application 2020 & 2033
- Table 27: Argentina Infant And Toddler Nutrition Revenue (million) Forecast, by Application 2020 & 2033
- Table 28: Argentina Infant And Toddler Nutrition Volume (K) Forecast, by Application 2020 & 2033
- Table 29: Rest of South America Infant And Toddler Nutrition Revenue (million) Forecast, by Application 2020 & 2033
- Table 30: Rest of South America Infant And Toddler Nutrition Volume (K) Forecast, by Application 2020 & 2033
- Table 31: Global Infant And Toddler Nutrition Revenue million Forecast, by Application 2020 & 2033
- Table 32: Global Infant And Toddler Nutrition Volume K Forecast, by Application 2020 & 2033
- Table 33: Global Infant And Toddler Nutrition Revenue million Forecast, by Type 2020 & 2033
- Table 34: Global Infant And Toddler Nutrition Volume K Forecast, by Type 2020 & 2033
- Table 35: Global Infant And Toddler Nutrition Revenue million Forecast, by Country 2020 & 2033
- Table 36: Global Infant And Toddler Nutrition Volume K Forecast, by Country 2020 & 2033
- Table 37: United Kingdom Infant And Toddler Nutrition Revenue (million) Forecast, by Application 2020 & 2033
- Table 38: United Kingdom Infant And Toddler Nutrition Volume (K) Forecast, by Application 2020 & 2033
- Table 39: Germany Infant And Toddler Nutrition Revenue (million) Forecast, by Application 2020 & 2033
- Table 40: Germany Infant And Toddler Nutrition Volume (K) Forecast, by Application 2020 & 2033
- Table 41: France Infant And Toddler Nutrition Revenue (million) Forecast, by Application 2020 & 2033
- Table 42: France Infant And Toddler Nutrition Volume (K) Forecast, by Application 2020 & 2033
- Table 43: Italy Infant And Toddler Nutrition Revenue (million) Forecast, by Application 2020 & 2033
- Table 44: Italy Infant And Toddler Nutrition Volume (K) Forecast, by Application 2020 & 2033
- Table 45: Spain Infant And Toddler Nutrition Revenue (million) Forecast, by Application 2020 & 2033
- Table 46: Spain Infant And Toddler Nutrition Volume (K) Forecast, by Application 2020 & 2033
- Table 47: Russia Infant And Toddler Nutrition Revenue (million) Forecast, by Application 2020 & 2033
- Table 48: Russia Infant And Toddler Nutrition Volume (K) Forecast, by Application 2020 & 2033
- Table 49: Benelux Infant And Toddler Nutrition Revenue (million) Forecast, by Application 2020 & 2033
- Table 50: Benelux Infant And Toddler Nutrition Volume (K) Forecast, by Application 2020 & 2033
- Table 51: Nordics Infant And Toddler Nutrition Revenue (million) Forecast, by Application 2020 & 2033
- Table 52: Nordics Infant And Toddler Nutrition Volume (K) Forecast, by Application 2020 & 2033
- Table 53: Rest of Europe Infant And Toddler Nutrition Revenue (million) Forecast, by Application 2020 & 2033
- Table 54: Rest of Europe Infant And Toddler Nutrition Volume (K) Forecast, by Application 2020 & 2033
- Table 55: Global Infant And Toddler Nutrition Revenue million Forecast, by Application 2020 & 2033
- Table 56: Global Infant And Toddler Nutrition Volume K Forecast, by Application 2020 & 2033
- Table 57: Global Infant And Toddler Nutrition Revenue million Forecast, by Type 2020 & 2033
- Table 58: Global Infant And Toddler Nutrition Volume K Forecast, by Type 2020 & 2033
- Table 59: Global Infant And Toddler Nutrition Revenue million Forecast, by Country 2020 & 2033
- Table 60: Global Infant And Toddler Nutrition Volume K Forecast, by Country 2020 & 2033
- Table 61: Turkey Infant And Toddler Nutrition Revenue (million) Forecast, by Application 2020 & 2033
- Table 62: Turkey Infant And Toddler Nutrition Volume (K) Forecast, by Application 2020 & 2033
- Table 63: Israel Infant And Toddler Nutrition Revenue (million) Forecast, by Application 2020 & 2033
- Table 64: Israel Infant And Toddler Nutrition Volume (K) Forecast, by Application 2020 & 2033
- Table 65: GCC Infant And Toddler Nutrition Revenue (million) Forecast, by Application 2020 & 2033
- Table 66: GCC Infant And Toddler Nutrition Volume (K) Forecast, by Application 2020 & 2033
- Table 67: North Africa Infant And Toddler Nutrition Revenue (million) Forecast, by Application 2020 & 2033
- Table 68: North Africa Infant And Toddler Nutrition Volume (K) Forecast, by Application 2020 & 2033
- Table 69: South Africa Infant And Toddler Nutrition Revenue (million) Forecast, by Application 2020 & 2033
- Table 70: South Africa Infant And Toddler Nutrition Volume (K) Forecast, by Application 2020 & 2033
- Table 71: Rest of Middle East & Africa Infant And Toddler Nutrition Revenue (million) Forecast, by Application 2020 & 2033
- Table 72: Rest of Middle East & Africa Infant And Toddler Nutrition Volume (K) Forecast, by Application 2020 & 2033
- Table 73: Global Infant And Toddler Nutrition Revenue million Forecast, by Application 2020 & 2033
- Table 74: Global Infant And Toddler Nutrition Volume K Forecast, by Application 2020 & 2033
- Table 75: Global Infant And Toddler Nutrition Revenue million Forecast, by Type 2020 & 2033
- Table 76: Global Infant And Toddler Nutrition Volume K Forecast, by Type 2020 & 2033
- Table 77: Global Infant And Toddler Nutrition Revenue million Forecast, by Country 2020 & 2033
- Table 78: Global Infant And Toddler Nutrition Volume K Forecast, by Country 2020 & 2033
- Table 79: China Infant And Toddler Nutrition Revenue (million) Forecast, by Application 2020 & 2033
- Table 80: China Infant And Toddler Nutrition Volume (K) Forecast, by Application 2020 & 2033
- Table 81: India Infant And Toddler Nutrition Revenue (million) Forecast, by Application 2020 & 2033
- Table 82: India Infant And Toddler Nutrition Volume (K) Forecast, by Application 2020 & 2033
- Table 83: Japan Infant And Toddler Nutrition Revenue (million) Forecast, by Application 2020 & 2033
- Table 84: Japan Infant And Toddler Nutrition Volume (K) Forecast, by Application 2020 & 2033
- Table 85: South Korea Infant And Toddler Nutrition Revenue (million) Forecast, by Application 2020 & 2033
- Table 86: South Korea Infant And Toddler Nutrition Volume (K) Forecast, by Application 2020 & 2033
- Table 87: ASEAN Infant And Toddler Nutrition Revenue (million) Forecast, by Application 2020 & 2033
- Table 88: ASEAN Infant And Toddler Nutrition Volume (K) Forecast, by Application 2020 & 2033
- Table 89: Oceania Infant And Toddler Nutrition Revenue (million) Forecast, by Application 2020 & 2033
- Table 90: Oceania Infant And Toddler Nutrition Volume (K) Forecast, by Application 2020 & 2033
- Table 91: Rest of Asia Pacific Infant And Toddler Nutrition Revenue (million) Forecast, by Application 2020 & 2033
- Table 92: Rest of Asia Pacific Infant And Toddler Nutrition Volume (K) Forecast, by Application 2020 & 2033
Frequently Asked Questions
1. What is the projected Compound Annual Growth Rate (CAGR) of the Infant And Toddler Nutrition?
The projected CAGR is approximately XXX%.
2. Which companies are prominent players in the Infant And Toddler Nutrition?
Key companies in the market include Mead Johnson, Danone, Nestlé, Glanbia, Abbott Laboratories, Arla Foods, Amara, Baby Gourmet, Beech-Nut, Friso, Healthy Sprouts Foods, Hyproca Nutrition, Kerry, Kraft Foods, Morinaga, NurturMe, Rafferty's Garden.
3. What are the main segments of the Infant And Toddler Nutrition?
The market segments include Application, Type.
4. Can you provide details about the market size?
The market size is estimated to be USD XXX million as of 2022.
5. What are some drivers contributing to market growth?
N/A
6. What are the notable trends driving market growth?
N/A
7. Are there any restraints impacting market growth?
N/A
8. Can you provide examples of recent developments in the market?
N/A
9. What pricing options are available for accessing the report?
Pricing options include single-user, multi-user, and enterprise licenses priced at USD 3950.00, USD 5925.00, and USD 7900.00 respectively.
10. Is the market size provided in terms of value or volume?
The market size is provided in terms of value, measured in million and volume, measured in K.
11. Are there any specific market keywords associated with the report?
Yes, the market keyword associated with the report is "Infant And Toddler Nutrition," which aids in identifying and referencing the specific market segment covered.
12. How do I determine which pricing option suits my needs best?
The pricing options vary based on user requirements and access needs. Individual users may opt for single-user licenses, while businesses requiring broader access may choose multi-user or enterprise licenses for cost-effective access to the report.
13. Are there any additional resources or data provided in the Infant And Toddler Nutrition report?
While the report offers comprehensive insights, it's advisable to review the specific contents or supplementary materials provided to ascertain if additional resources or data are available.
14. How can I stay updated on further developments or reports in the Infant And Toddler Nutrition?
To stay informed about further developments, trends, and reports in the Infant And Toddler Nutrition, consider subscribing to industry newsletters, following relevant companies and organizations, or regularly checking reputable industry news sources and publications.
Methodology
Step 1 - Identification of Relevant Samples Size from Population Database


Step 2 - Approaches for Defining Global Market Size (Value, Volume* & Price*)

Note*: In applicable scenarios
Step 3 - Data Sources
Primary Research
- Web Analytics
- Survey Reports
- Research Institute
- Latest Research Reports
- Opinion Leaders
Secondary Research
- Annual Reports
- White Paper
- Latest Press Release
- Industry Association
- Paid Database
- Investor Presentations

Step 4 - Data Triangulation
Involves using different sources of information in order to increase the validity of a study
These sources are likely to be stakeholders in a program - participants, other researchers, program staff, other community members, and so on.
Then we put all data in single framework & apply various statistical tools to find out the dynamic on the market.
During the analysis stage, feedback from the stakeholder groups would be compared to determine areas of agreement as well as areas of divergence