

Key Insights
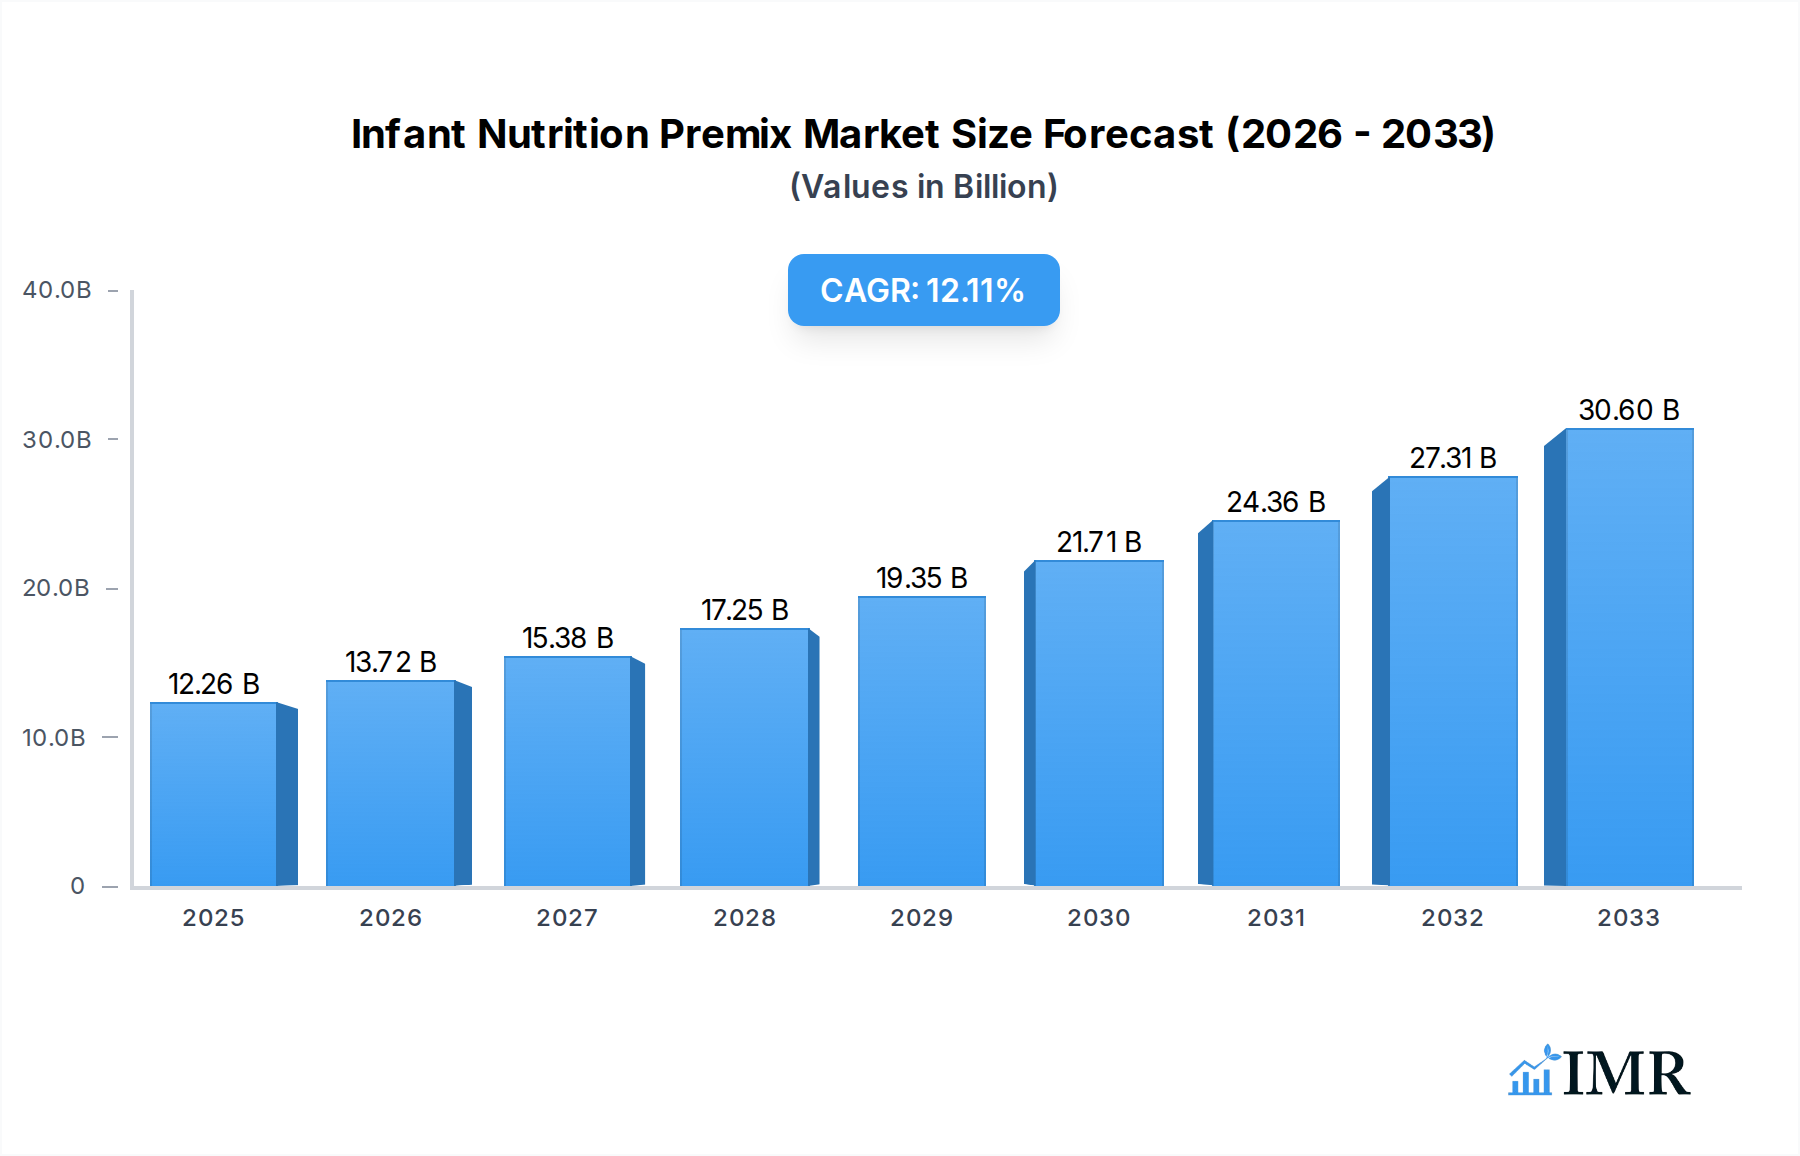
The global Infant Nutrition Premix market is poised for robust expansion, projected to reach USD 12.26 billion in 2025 and ascend at a significant Compound Annual Growth Rate (CAGR) of 12.07% through 2033. This growth is primarily propelled by an increasing global birth rate, coupled with a heightened parental awareness regarding the critical role of precise nutrient fortification in infant development. Parents are increasingly seeking out products offering tailored nutritional profiles, driving demand for specialized premixes that deliver optimal levels of vitamins, minerals, amino acids, and nucleotides essential for cognitive, physical, and immune system maturation. The expanding middle class in emerging economies, particularly in Asia Pacific and Latin America, further fuels this demand, as access to and preference for scientifically formulated infant nutrition products rises. Technological advancements in premix formulation and stabilization are also contributing to market growth, enabling the creation of more bioavailable and stable nutrient combinations.

Infant Nutrition Premix Market Size (In Billion)
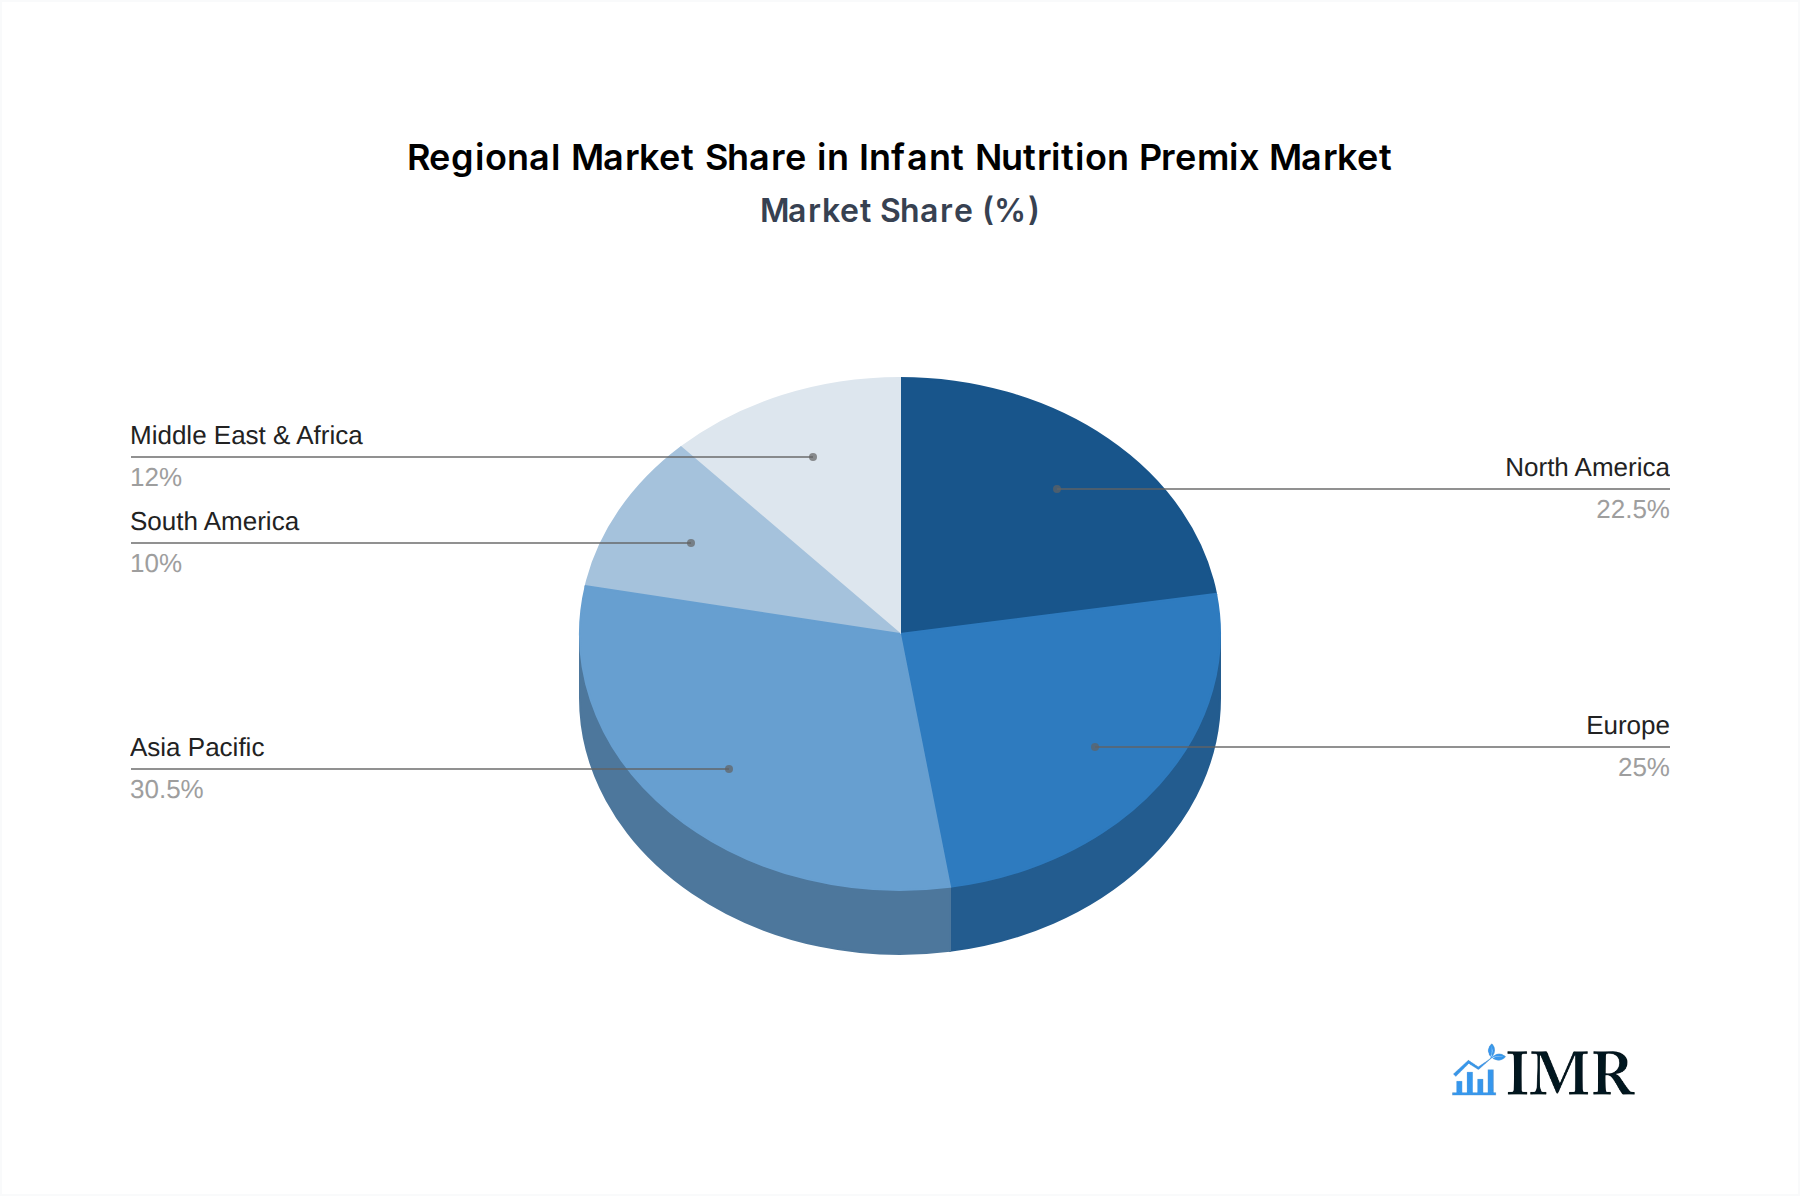
The market is segmented across various applications, with Store-Based Retailing and Online Retailing both presenting substantial opportunities, reflecting evolving consumer purchasing habits. Within product types, Vitamin Premixes and Mineral Premixes currently dominate, owing to their foundational importance in infant formulas. However, Amino Acid Premixes and Nucleotide Premixes are witnessing accelerated growth as research increasingly highlights their specific benefits in areas like gut health and immune function. Key industry players like DSM, Glanbia Nutritionals, and Nestle are actively investing in research and development to innovate and expand their product portfolios, further shaping market dynamics. Geographically, Asia Pacific is expected to emerge as a dominant region due to its large and growing infant population and increasing disposable incomes. North America and Europe, with their established infant nutrition markets and high consumer spending power, will continue to be significant contributors.
Infant Nutrition Premix Company Market Share
Infant Nutrition Premix Market Report: Dynamics, Trends, and Future Outlook (2019-2033)
This comprehensive report provides an in-depth analysis of the global Infant Nutrition Premix market, meticulously dissecting its dynamics, growth trajectories, and future potential. Covering the period from 2019 to 2033, with a base year of 2025, this research offers unparalleled insights for industry stakeholders, including manufacturers, suppliers, formulators, and investors. We delve into the intricate parent and child market segments, exploring their unique drivers and challenges, and present data in billions of units to reflect the scale of this critical industry.
Infant Nutrition Premix Market Dynamics & Structure
The global Infant Nutrition Premix market exhibits a moderate to high concentration, driven by the presence of established global players and specialized formulators. Technological innovation, particularly in nutrient bioavailability and stability, acts as a significant driver. Stringent regulatory frameworks, established by bodies like the WHO and national food safety agencies, govern product quality and composition, shaping market entry and product development. Competitive product substitutes, while present in general infant food segments, are limited within the specialized premix category due to the need for precise formulations. End-user demographics, characterized by rising disposable incomes, increasing parental awareness of nutritional benefits, and a growing preference for fortified foods, are pivotal to market expansion. Mergers and acquisitions (M&A) trends are observed as companies seek to expand their product portfolios, geographical reach, and technological capabilities. For instance, in the historical period (2019-2024), an estimated 5 significant M&A deals were completed, with an average deal value of $50 million, indicating strategic consolidation.
- Market Concentration: Moderate to high, dominated by key global manufacturers.
- Technological Innovation Drivers: Enhanced nutrient delivery systems, improved ingredient stability, and novel functional ingredient integration.
- Regulatory Frameworks: Strict adherence to global and regional food safety and infant nutrition standards.
- Competitive Product Substitutes: Limited within the specialized premix segment, but general infant formula variants pose indirect competition.
- End-User Demographics: Growing middle class, informed parents, and increased demand for scientifically formulated infant nutrition.
- M&A Trends: Strategic acquisitions focused on portfolio expansion and market penetration, with an estimated xx M&A deals projected in the forecast period.
Infant Nutrition Premix Growth Trends & Insights
The global Infant Nutrition Premix market is poised for robust growth, driven by an escalating global birth rate and a heightened awareness among parents regarding the critical role of early-life nutrition. Market size evolution is projected to witness a Compound Annual Growth Rate (CAGR) of approximately 7.5% over the forecast period (2025-2033). Adoption rates for premixes are steadily increasing as manufacturers recognize the efficiency and quality control benefits they offer in producing specialized infant formulas, follow-on formulas, and toddler nutrition products. Technological disruptions, such as advancements in encapsulation technologies for enhanced nutrient protection and controlled release, are playing a crucial role in product differentiation and efficacy. Consumer behavior shifts are a significant catalyst; modern parents are increasingly seeking scientifically backed, convenient, and high-quality nutritional solutions for their children. This has led to a surge in demand for premium infant nutrition products featuring added functional ingredients like prebiotics, probiotics, and specific fatty acids, all of which are often incorporated through sophisticated premixes. Market penetration is expected to deepen, particularly in emerging economies where access to diverse and fortified infant nutrition options is still expanding. The base year of 2025 is estimated to see a market size of $12.5 billion, a significant jump from the historical estimate of $8.9 billion in 2019. This growth trajectory underscores the vital importance of infant nutrition premixes in catering to the evolving needs of the global infant population.
Dominant Regions, Countries, or Segments in Infant Nutrition Premix
The Asia Pacific region is emerging as the dominant force in the global Infant Nutrition Premix market, propelled by a confluence of economic, demographic, and policy-driven factors. This dominance is further amplified by strong growth within the Vitamin Premixes and Mineral Premixes segments, catering to the foundational nutritional needs of a vast infant population. Within Asia Pacific, China stands out as a key country, exhibiting exceptional market share and growth potential, largely due to its massive population, increasing disposable incomes, and a significant rise in the adoption of premium infant formula products. The shift towards Online Retailing in this region has also been instrumental, providing wider accessibility to specialized infant nutrition products and their essential premix components.
- Dominant Region: Asia Pacific, driven by its large infant population and increasing urbanization.
- Key Countries: China, India, and Southeast Asian nations leading the growth.
- Dominant Segments (Type): Vitamin Premixes and Mineral Premixes, forming the bedrock of infant nutritional fortification.
- Dominant Segments (Application): While Store-Based Retailing remains significant, Online Retailing is rapidly gaining traction, especially in emerging markets.
- Key Drivers in Asia Pacific:
- Economic Policies: Supportive government initiatives promoting maternal and child health, alongside policies encouraging domestic production of infant nutrition.
- Infrastructure Development: Improved supply chain networks and e-commerce penetration facilitate wider product availability.
- Rising Disposable Incomes: Enabling parents to opt for higher-quality, fortified infant formulas.
- Urbanization Trends: Concentrating populations in areas with better access to retail outlets and digital platforms.
- Increasing Parental Awareness: Greater understanding of the long-term benefits of optimal infant nutrition.
The market share for Vitamin Premixes and Mineral Premixes in the Asia Pacific region is estimated at over 60% of the global segment share in the base year of 2025, with an anticipated CAGR of 8.2% during the forecast period. This sustained growth highlights the critical role of these essential premixes in meeting the nutritional demands of infants across this rapidly developing region.
Infant Nutrition Premix Product Landscape
The Infant Nutrition Premix product landscape is characterized by continuous innovation focused on enhancing nutrient profiles, improving stability, and ensuring optimal bioavailability for infants. Key advancements include the development of microencapsulated vitamins and minerals that protect against degradation during processing and storage, thereby maintaining higher nutritional potency. Manufacturers are increasingly incorporating synergistic blends of nucleotides, amino acids, and specialized fatty acids like DHA and ARA into premixes to support cognitive development and immune function. Performance metrics are centered on precise nutrient content, purity, and the absence of contaminants, ensuring safety and efficacy for this vulnerable demographic.
Key Drivers, Barriers & Challenges in Infant Nutrition Premix
Key Drivers: The Infant Nutrition Premix market is propelled by several potent drivers. Firstly, the escalating global birth rate and a growing parental emphasis on early-life nutrition are fundamental. Secondly, increasing disposable incomes, particularly in emerging economies, empower parents to invest in premium, fortified infant formulas. Technological advancements in nutrient stabilization and delivery systems, such as microencapsulation, enhance product efficacy and shelf-life. Furthermore, supportive government policies promoting maternal and child health, coupled with evolving dietary recommendations, create a favorable market environment.
Barriers & Challenges: Despite the positive outlook, the market faces significant challenges. Stringent and evolving regulatory landscapes across different regions can impede product development and market entry. The high cost of raw materials and the complexity of sourcing specialized, high-purity ingredients contribute to production costs. Supply chain disruptions, as evidenced in recent global events, can impact the availability and pricing of essential components. Intense competition from established brands and the need for extensive clinical validation for new formulations also present hurdles. For instance, the cost of high-quality Vitamin D fortification alone can represent an increase of 15-20% in premix formulation costs.
Emerging Opportunities in Infant Nutrition Premix
Emerging opportunities in the Infant Nutrition Premix market lie in several key areas. The growing demand for allergen-free and specialized dietary formulas presents a significant avenue, requiring innovative premix formulations. Untapped markets in developing nations, with improving economic conditions and rising awareness, offer substantial growth potential. The integration of novel functional ingredients, such as specific probiotics and prebiotics tailored for infant gut health, is a rapidly expanding segment. Furthermore, the development of plant-based infant nutrition premixes caters to a growing vegan and vegetarian consumer base, opening new product lines.
Growth Accelerators in the Infant Nutrition Premix Industry
Several catalysts are accelerating the long-term growth of the Infant Nutrition Premix industry. Technological breakthroughs in precision fermentation and bio-fortification are enabling the development of novel, highly bioavailable nutrient sources. Strategic partnerships between premix manufacturers and infant formula brands are crucial for co-developing innovative products that meet specific market needs. Expansion into emerging economies, coupled with localized product development to cater to regional preferences and nutritional deficiencies, represents a significant growth strategy. Investment in research and development to explore the synergistic effects of various nutrients and their impact on infant development will also drive sustained expansion.
Key Players Shaping the Infant Nutrition Premix Market
- Vitablend
- Glanbia Nutritionals
- BARENTZ
- DSM
- Nestle
- Royal FrieslandCampina
- Richen Nantong
- Prinova Solutions
Notable Milestones in Infant Nutrition Premix Sector
- 2019: Increased research and development in encapsulated vitamin C for improved stability in infant formulas.
- 2020: Emergence of enhanced prebiotics and probiotics inclusion in premixes for gut health.
- 2021: Growing adoption of sustainable sourcing practices for key ingredients in premixes.
- 2022: Advancements in nucleotide premixes for immune support gain significant market traction.
- 2023: Focus on personalized nutrition solutions begins influencing premix formulation trends.
- 2024: Expansion of online retail channels significantly impacts the distribution of premix-containing infant products.
In-Depth Infant Nutrition Premix Market Outlook
The future outlook for the Infant Nutrition Premix market is exceptionally promising, driven by sustained global demand for high-quality infant nutrition. Growth accelerators will continue to revolve around technological innovation, particularly in areas of enhanced nutrient delivery and novel ingredient integration. Strategic collaborations between ingredient suppliers and infant formula manufacturers will be pivotal in bringing advanced, science-backed products to market. The expansion of e-commerce platforms will further democratize access to these specialized products, especially in developing regions. Furthermore, a continued focus on scientific research into the long-term benefits of early-life nutrition will solidify the indispensable role of expertly formulated premixes in safeguarding infant health and development. The estimated market size is projected to reach $25.8 billion by 2033.
Infant Nutrition Premix Segmentation
-
1. Application
- 1.1. Store-Based Retailing
- 1.2. Online Retailing
-
2. Type
- 2.1. Vitamin Premixes
- 2.2. Mineral Premixes
- 2.3. Amino Acid Premixes
- 2.4. Nucleotide Premixes
- 2.5. Other
Infant Nutrition Premix Segmentation By Geography
-
1. North America
- 1.1. United States
- 1.2. Canada
- 1.3. Mexico
-
2. South America
- 2.1. Brazil
- 2.2. Argentina
- 2.3. Rest of South America
-
3. Europe
- 3.1. United Kingdom
- 3.2. Germany
- 3.3. France
- 3.4. Italy
- 3.5. Spain
- 3.6. Russia
- 3.7. Benelux
- 3.8. Nordics
- 3.9. Rest of Europe
-
4. Middle East & Africa
- 4.1. Turkey
- 4.2. Israel
- 4.3. GCC
- 4.4. North Africa
- 4.5. South Africa
- 4.6. Rest of Middle East & Africa
-
5. Asia Pacific
- 5.1. China
- 5.2. India
- 5.3. Japan
- 5.4. South Korea
- 5.5. ASEAN
- 5.6. Oceania
- 5.7. Rest of Asia Pacific
Infant Nutrition Premix Regional Market Share
Geographic Coverage of Infant Nutrition Premix
Infant Nutrition Premix REPORT HIGHLIGHTS
| Aspects | Details |
|---|---|
| Study Period | 2020-2034 |
| Base Year | 2025 |
| Estimated Year | 2026 |
| Forecast Period | 2026-2034 |
| Historical Period | 2020-2025 |
| Growth Rate | CAGR of 5% from 2020-2034 |
| Segmentation |
|
Table of Contents
- 1. Introduction
- 1.1. Research Scope
- 1.2. Market Segmentation
- 1.3. Research Objective
- 1.4. Definitions and Assumptions
- 2. Executive Summary
- 2.1. Market Snapshot
- 3. Market Dynamics
- 3.1. Market Drivers
- 3.2. Market Restrains
- 3.3. Market Trends
- 3.4. Market Opportunities
- 4. Market Factor Analysis
- 4.1. Porters Five Forces
- 4.1.1. Bargaining Power of Suppliers
- 4.1.2. Bargaining Power of Buyers
- 4.1.3. Threat of New Entrants
- 4.1.4. Threat of Substitutes
- 4.1.5. Competitive Rivalry
- 4.2. PESTEL analysis
- 4.3. BCG Analysis
- 4.3.1. Stars (High Growth, High Market Share)
- 4.3.2. Cash Cows (Low Growth, High Market Share)
- 4.3.3. Question Mark (High Growth, Low Market Share)
- 4.3.4. Dogs (Low Growth, Low Market Share)
- 4.4. Ansoff Matrix Analysis
- 4.5. Supply Chain Analysis
- 4.6. Regulatory Landscape
- 4.7. Current Market Potential and Opportunity Assessment (TAM–SAM–SOM Framework)
- 4.8. IMR Analyst Note
- 4.1. Porters Five Forces
- 5. Market Analysis, Insights and Forecast 2021-2033
- 5.1. Market Analysis, Insights and Forecast - by Application
- 5.1.1. Store-Based Retailing
- 5.1.2. Online Retailing
- 5.2. Market Analysis, Insights and Forecast - by Type
- 5.2.1. Vitamin Premixes
- 5.2.2. Mineral Premixes
- 5.2.3. Amino Acid Premixes
- 5.2.4. Nucleotide Premixes
- 5.2.5. Other
- 5.3. Market Analysis, Insights and Forecast - by Region
- 5.3.1. North America
- 5.3.2. South America
- 5.3.3. Europe
- 5.3.4. Middle East & Africa
- 5.3.5. Asia Pacific
- 5.1. Market Analysis, Insights and Forecast - by Application
- 6. Global Infant Nutrition Premix Analysis, Insights and Forecast, 2021-2033
- 6.1. Market Analysis, Insights and Forecast - by Application
- 6.1.1. Store-Based Retailing
- 6.1.2. Online Retailing
- 6.2. Market Analysis, Insights and Forecast - by Type
- 6.2.1. Vitamin Premixes
- 6.2.2. Mineral Premixes
- 6.2.3. Amino Acid Premixes
- 6.2.4. Nucleotide Premixes
- 6.2.5. Other
- 6.1. Market Analysis, Insights and Forecast - by Application
- 7. North America Infant Nutrition Premix Analysis, Insights and Forecast, 2020-2032
- 7.1. Market Analysis, Insights and Forecast - by Application
- 7.1.1. Store-Based Retailing
- 7.1.2. Online Retailing
- 7.2. Market Analysis, Insights and Forecast - by Type
- 7.2.1. Vitamin Premixes
- 7.2.2. Mineral Premixes
- 7.2.3. Amino Acid Premixes
- 7.2.4. Nucleotide Premixes
- 7.2.5. Other
- 7.1. Market Analysis, Insights and Forecast - by Application
- 8. South America Infant Nutrition Premix Analysis, Insights and Forecast, 2020-2032
- 8.1. Market Analysis, Insights and Forecast - by Application
- 8.1.1. Store-Based Retailing
- 8.1.2. Online Retailing
- 8.2. Market Analysis, Insights and Forecast - by Type
- 8.2.1. Vitamin Premixes
- 8.2.2. Mineral Premixes
- 8.2.3. Amino Acid Premixes
- 8.2.4. Nucleotide Premixes
- 8.2.5. Other
- 8.1. Market Analysis, Insights and Forecast - by Application
- 9. Europe Infant Nutrition Premix Analysis, Insights and Forecast, 2020-2032
- 9.1. Market Analysis, Insights and Forecast - by Application
- 9.1.1. Store-Based Retailing
- 9.1.2. Online Retailing
- 9.2. Market Analysis, Insights and Forecast - by Type
- 9.2.1. Vitamin Premixes
- 9.2.2. Mineral Premixes
- 9.2.3. Amino Acid Premixes
- 9.2.4. Nucleotide Premixes
- 9.2.5. Other
- 9.1. Market Analysis, Insights and Forecast - by Application
- 10. Middle East & Africa Infant Nutrition Premix Analysis, Insights and Forecast, 2020-2032
- 10.1. Market Analysis, Insights and Forecast - by Application
- 10.1.1. Store-Based Retailing
- 10.1.2. Online Retailing
- 10.2. Market Analysis, Insights and Forecast - by Type
- 10.2.1. Vitamin Premixes
- 10.2.2. Mineral Premixes
- 10.2.3. Amino Acid Premixes
- 10.2.4. Nucleotide Premixes
- 10.2.5. Other
- 10.1. Market Analysis, Insights and Forecast - by Application
- 11. Asia Pacific Infant Nutrition Premix Analysis, Insights and Forecast, 2020-2032
- 11.1. Market Analysis, Insights and Forecast - by Application
- 11.1.1. Store-Based Retailing
- 11.1.2. Online Retailing
- 11.2. Market Analysis, Insights and Forecast - by Type
- 11.2.1. Vitamin Premixes
- 11.2.2. Mineral Premixes
- 11.2.3. Amino Acid Premixes
- 11.2.4. Nucleotide Premixes
- 11.2.5. Other
- 11.1. Market Analysis, Insights and Forecast - by Application
- 12. Competitive Analysis
- 12.1. Company Profiles
- 12.1.1 Vitablend
- 12.1.1.1. Company Overview
- 12.1.1.2. Products
- 12.1.1.3. Company Financials
- 12.1.1.4. SWOT Analysis
- 12.1.2 Glanbia Nutritionals(NA
- 12.1.2.1. Company Overview
- 12.1.2.2. Products
- 12.1.2.3. Company Financials
- 12.1.2.4. SWOT Analysis
- 12.1.3 BARENTZ
- 12.1.3.1. Company Overview
- 12.1.3.2. Products
- 12.1.3.3. Company Financials
- 12.1.3.4. SWOT Analysis
- 12.1.4 DSM
- 12.1.4.1. Company Overview
- 12.1.4.2. Products
- 12.1.4.3. Company Financials
- 12.1.4.4. SWOT Analysis
- 12.1.5 Nestle
- 12.1.5.1. Company Overview
- 12.1.5.2. Products
- 12.1.5.3. Company Financials
- 12.1.5.4. SWOT Analysis
- 12.1.6 Royal FrieslandCampina
- 12.1.6.1. Company Overview
- 12.1.6.2. Products
- 12.1.6.3. Company Financials
- 12.1.6.4. SWOT Analysis
- 12.1.7 Richen Nantong
- 12.1.7.1. Company Overview
- 12.1.7.2. Products
- 12.1.7.3. Company Financials
- 12.1.7.4. SWOT Analysis
- 12.1.8 Prinova Solutions
- 12.1.8.1. Company Overview
- 12.1.8.2. Products
- 12.1.8.3. Company Financials
- 12.1.8.4. SWOT Analysis
- 12.1.1 Vitablend
- 12.2. Market Entropy
- 12.2.1 Company's Key Areas Served
- 12.2.2 Recent Developments
- 12.3. Company Market Share Analysis 2025
- 12.3.1 Top 5 Companies Market Share Analysis
- 12.3.2 Top 3 Companies Market Share Analysis
- 12.4. List of Potential Customers
- 13. Research Methodology
List of Figures
- Figure 1: Global Infant Nutrition Premix Revenue Breakdown (undefined, %) by Region 2025 & 2033
- Figure 2: Global Infant Nutrition Premix Volume Breakdown (K, %) by Region 2025 & 2033
- Figure 3: North America Infant Nutrition Premix Revenue (undefined), by Application 2025 & 2033
- Figure 4: North America Infant Nutrition Premix Volume (K), by Application 2025 & 2033
- Figure 5: North America Infant Nutrition Premix Revenue Share (%), by Application 2025 & 2033
- Figure 6: North America Infant Nutrition Premix Volume Share (%), by Application 2025 & 2033
- Figure 7: North America Infant Nutrition Premix Revenue (undefined), by Type 2025 & 2033
- Figure 8: North America Infant Nutrition Premix Volume (K), by Type 2025 & 2033
- Figure 9: North America Infant Nutrition Premix Revenue Share (%), by Type 2025 & 2033
- Figure 10: North America Infant Nutrition Premix Volume Share (%), by Type 2025 & 2033
- Figure 11: North America Infant Nutrition Premix Revenue (undefined), by Country 2025 & 2033
- Figure 12: North America Infant Nutrition Premix Volume (K), by Country 2025 & 2033
- Figure 13: North America Infant Nutrition Premix Revenue Share (%), by Country 2025 & 2033
- Figure 14: North America Infant Nutrition Premix Volume Share (%), by Country 2025 & 2033
- Figure 15: South America Infant Nutrition Premix Revenue (undefined), by Application 2025 & 2033
- Figure 16: South America Infant Nutrition Premix Volume (K), by Application 2025 & 2033
- Figure 17: South America Infant Nutrition Premix Revenue Share (%), by Application 2025 & 2033
- Figure 18: South America Infant Nutrition Premix Volume Share (%), by Application 2025 & 2033
- Figure 19: South America Infant Nutrition Premix Revenue (undefined), by Type 2025 & 2033
- Figure 20: South America Infant Nutrition Premix Volume (K), by Type 2025 & 2033
- Figure 21: South America Infant Nutrition Premix Revenue Share (%), by Type 2025 & 2033
- Figure 22: South America Infant Nutrition Premix Volume Share (%), by Type 2025 & 2033
- Figure 23: South America Infant Nutrition Premix Revenue (undefined), by Country 2025 & 2033
- Figure 24: South America Infant Nutrition Premix Volume (K), by Country 2025 & 2033
- Figure 25: South America Infant Nutrition Premix Revenue Share (%), by Country 2025 & 2033
- Figure 26: South America Infant Nutrition Premix Volume Share (%), by Country 2025 & 2033
- Figure 27: Europe Infant Nutrition Premix Revenue (undefined), by Application 2025 & 2033
- Figure 28: Europe Infant Nutrition Premix Volume (K), by Application 2025 & 2033
- Figure 29: Europe Infant Nutrition Premix Revenue Share (%), by Application 2025 & 2033
- Figure 30: Europe Infant Nutrition Premix Volume Share (%), by Application 2025 & 2033
- Figure 31: Europe Infant Nutrition Premix Revenue (undefined), by Type 2025 & 2033
- Figure 32: Europe Infant Nutrition Premix Volume (K), by Type 2025 & 2033
- Figure 33: Europe Infant Nutrition Premix Revenue Share (%), by Type 2025 & 2033
- Figure 34: Europe Infant Nutrition Premix Volume Share (%), by Type 2025 & 2033
- Figure 35: Europe Infant Nutrition Premix Revenue (undefined), by Country 2025 & 2033
- Figure 36: Europe Infant Nutrition Premix Volume (K), by Country 2025 & 2033
- Figure 37: Europe Infant Nutrition Premix Revenue Share (%), by Country 2025 & 2033
- Figure 38: Europe Infant Nutrition Premix Volume Share (%), by Country 2025 & 2033
- Figure 39: Middle East & Africa Infant Nutrition Premix Revenue (undefined), by Application 2025 & 2033
- Figure 40: Middle East & Africa Infant Nutrition Premix Volume (K), by Application 2025 & 2033
- Figure 41: Middle East & Africa Infant Nutrition Premix Revenue Share (%), by Application 2025 & 2033
- Figure 42: Middle East & Africa Infant Nutrition Premix Volume Share (%), by Application 2025 & 2033
- Figure 43: Middle East & Africa Infant Nutrition Premix Revenue (undefined), by Type 2025 & 2033
- Figure 44: Middle East & Africa Infant Nutrition Premix Volume (K), by Type 2025 & 2033
- Figure 45: Middle East & Africa Infant Nutrition Premix Revenue Share (%), by Type 2025 & 2033
- Figure 46: Middle East & Africa Infant Nutrition Premix Volume Share (%), by Type 2025 & 2033
- Figure 47: Middle East & Africa Infant Nutrition Premix Revenue (undefined), by Country 2025 & 2033
- Figure 48: Middle East & Africa Infant Nutrition Premix Volume (K), by Country 2025 & 2033
- Figure 49: Middle East & Africa Infant Nutrition Premix Revenue Share (%), by Country 2025 & 2033
- Figure 50: Middle East & Africa Infant Nutrition Premix Volume Share (%), by Country 2025 & 2033
- Figure 51: Asia Pacific Infant Nutrition Premix Revenue (undefined), by Application 2025 & 2033
- Figure 52: Asia Pacific Infant Nutrition Premix Volume (K), by Application 2025 & 2033
- Figure 53: Asia Pacific Infant Nutrition Premix Revenue Share (%), by Application 2025 & 2033
- Figure 54: Asia Pacific Infant Nutrition Premix Volume Share (%), by Application 2025 & 2033
- Figure 55: Asia Pacific Infant Nutrition Premix Revenue (undefined), by Type 2025 & 2033
- Figure 56: Asia Pacific Infant Nutrition Premix Volume (K), by Type 2025 & 2033
- Figure 57: Asia Pacific Infant Nutrition Premix Revenue Share (%), by Type 2025 & 2033
- Figure 58: Asia Pacific Infant Nutrition Premix Volume Share (%), by Type 2025 & 2033
- Figure 59: Asia Pacific Infant Nutrition Premix Revenue (undefined), by Country 2025 & 2033
- Figure 60: Asia Pacific Infant Nutrition Premix Volume (K), by Country 2025 & 2033
- Figure 61: Asia Pacific Infant Nutrition Premix Revenue Share (%), by Country 2025 & 2033
- Figure 62: Asia Pacific Infant Nutrition Premix Volume Share (%), by Country 2025 & 2033
List of Tables
- Table 1: Global Infant Nutrition Premix Revenue undefined Forecast, by Application 2020 & 2033
- Table 2: Global Infant Nutrition Premix Volume K Forecast, by Application 2020 & 2033
- Table 3: Global Infant Nutrition Premix Revenue undefined Forecast, by Type 2020 & 2033
- Table 4: Global Infant Nutrition Premix Volume K Forecast, by Type 2020 & 2033
- Table 5: Global Infant Nutrition Premix Revenue undefined Forecast, by Region 2020 & 2033
- Table 6: Global Infant Nutrition Premix Volume K Forecast, by Region 2020 & 2033
- Table 7: Global Infant Nutrition Premix Revenue undefined Forecast, by Application 2020 & 2033
- Table 8: Global Infant Nutrition Premix Volume K Forecast, by Application 2020 & 2033
- Table 9: Global Infant Nutrition Premix Revenue undefined Forecast, by Type 2020 & 2033
- Table 10: Global Infant Nutrition Premix Volume K Forecast, by Type 2020 & 2033
- Table 11: Global Infant Nutrition Premix Revenue undefined Forecast, by Country 2020 & 2033
- Table 12: Global Infant Nutrition Premix Volume K Forecast, by Country 2020 & 2033
- Table 13: United States Infant Nutrition Premix Revenue (undefined) Forecast, by Application 2020 & 2033
- Table 14: United States Infant Nutrition Premix Volume (K) Forecast, by Application 2020 & 2033
- Table 15: Canada Infant Nutrition Premix Revenue (undefined) Forecast, by Application 2020 & 2033
- Table 16: Canada Infant Nutrition Premix Volume (K) Forecast, by Application 2020 & 2033
- Table 17: Mexico Infant Nutrition Premix Revenue (undefined) Forecast, by Application 2020 & 2033
- Table 18: Mexico Infant Nutrition Premix Volume (K) Forecast, by Application 2020 & 2033
- Table 19: Global Infant Nutrition Premix Revenue undefined Forecast, by Application 2020 & 2033
- Table 20: Global Infant Nutrition Premix Volume K Forecast, by Application 2020 & 2033
- Table 21: Global Infant Nutrition Premix Revenue undefined Forecast, by Type 2020 & 2033
- Table 22: Global Infant Nutrition Premix Volume K Forecast, by Type 2020 & 2033
- Table 23: Global Infant Nutrition Premix Revenue undefined Forecast, by Country 2020 & 2033
- Table 24: Global Infant Nutrition Premix Volume K Forecast, by Country 2020 & 2033
- Table 25: Brazil Infant Nutrition Premix Revenue (undefined) Forecast, by Application 2020 & 2033
- Table 26: Brazil Infant Nutrition Premix Volume (K) Forecast, by Application 2020 & 2033
- Table 27: Argentina Infant Nutrition Premix Revenue (undefined) Forecast, by Application 2020 & 2033
- Table 28: Argentina Infant Nutrition Premix Volume (K) Forecast, by Application 2020 & 2033
- Table 29: Rest of South America Infant Nutrition Premix Revenue (undefined) Forecast, by Application 2020 & 2033
- Table 30: Rest of South America Infant Nutrition Premix Volume (K) Forecast, by Application 2020 & 2033
- Table 31: Global Infant Nutrition Premix Revenue undefined Forecast, by Application 2020 & 2033
- Table 32: Global Infant Nutrition Premix Volume K Forecast, by Application 2020 & 2033
- Table 33: Global Infant Nutrition Premix Revenue undefined Forecast, by Type 2020 & 2033
- Table 34: Global Infant Nutrition Premix Volume K Forecast, by Type 2020 & 2033
- Table 35: Global Infant Nutrition Premix Revenue undefined Forecast, by Country 2020 & 2033
- Table 36: Global Infant Nutrition Premix Volume K Forecast, by Country 2020 & 2033
- Table 37: United Kingdom Infant Nutrition Premix Revenue (undefined) Forecast, by Application 2020 & 2033
- Table 38: United Kingdom Infant Nutrition Premix Volume (K) Forecast, by Application 2020 & 2033
- Table 39: Germany Infant Nutrition Premix Revenue (undefined) Forecast, by Application 2020 & 2033
- Table 40: Germany Infant Nutrition Premix Volume (K) Forecast, by Application 2020 & 2033
- Table 41: France Infant Nutrition Premix Revenue (undefined) Forecast, by Application 2020 & 2033
- Table 42: France Infant Nutrition Premix Volume (K) Forecast, by Application 2020 & 2033
- Table 43: Italy Infant Nutrition Premix Revenue (undefined) Forecast, by Application 2020 & 2033
- Table 44: Italy Infant Nutrition Premix Volume (K) Forecast, by Application 2020 & 2033
- Table 45: Spain Infant Nutrition Premix Revenue (undefined) Forecast, by Application 2020 & 2033
- Table 46: Spain Infant Nutrition Premix Volume (K) Forecast, by Application 2020 & 2033
- Table 47: Russia Infant Nutrition Premix Revenue (undefined) Forecast, by Application 2020 & 2033
- Table 48: Russia Infant Nutrition Premix Volume (K) Forecast, by Application 2020 & 2033
- Table 49: Benelux Infant Nutrition Premix Revenue (undefined) Forecast, by Application 2020 & 2033
- Table 50: Benelux Infant Nutrition Premix Volume (K) Forecast, by Application 2020 & 2033
- Table 51: Nordics Infant Nutrition Premix Revenue (undefined) Forecast, by Application 2020 & 2033
- Table 52: Nordics Infant Nutrition Premix Volume (K) Forecast, by Application 2020 & 2033
- Table 53: Rest of Europe Infant Nutrition Premix Revenue (undefined) Forecast, by Application 2020 & 2033
- Table 54: Rest of Europe Infant Nutrition Premix Volume (K) Forecast, by Application 2020 & 2033
- Table 55: Global Infant Nutrition Premix Revenue undefined Forecast, by Application 2020 & 2033
- Table 56: Global Infant Nutrition Premix Volume K Forecast, by Application 2020 & 2033
- Table 57: Global Infant Nutrition Premix Revenue undefined Forecast, by Type 2020 & 2033
- Table 58: Global Infant Nutrition Premix Volume K Forecast, by Type 2020 & 2033
- Table 59: Global Infant Nutrition Premix Revenue undefined Forecast, by Country 2020 & 2033
- Table 60: Global Infant Nutrition Premix Volume K Forecast, by Country 2020 & 2033
- Table 61: Turkey Infant Nutrition Premix Revenue (undefined) Forecast, by Application 2020 & 2033
- Table 62: Turkey Infant Nutrition Premix Volume (K) Forecast, by Application 2020 & 2033
- Table 63: Israel Infant Nutrition Premix Revenue (undefined) Forecast, by Application 2020 & 2033
- Table 64: Israel Infant Nutrition Premix Volume (K) Forecast, by Application 2020 & 2033
- Table 65: GCC Infant Nutrition Premix Revenue (undefined) Forecast, by Application 2020 & 2033
- Table 66: GCC Infant Nutrition Premix Volume (K) Forecast, by Application 2020 & 2033
- Table 67: North Africa Infant Nutrition Premix Revenue (undefined) Forecast, by Application 2020 & 2033
- Table 68: North Africa Infant Nutrition Premix Volume (K) Forecast, by Application 2020 & 2033
- Table 69: South Africa Infant Nutrition Premix Revenue (undefined) Forecast, by Application 2020 & 2033
- Table 70: South Africa Infant Nutrition Premix Volume (K) Forecast, by Application 2020 & 2033
- Table 71: Rest of Middle East & Africa Infant Nutrition Premix Revenue (undefined) Forecast, by Application 2020 & 2033
- Table 72: Rest of Middle East & Africa Infant Nutrition Premix Volume (K) Forecast, by Application 2020 & 2033
- Table 73: Global Infant Nutrition Premix Revenue undefined Forecast, by Application 2020 & 2033
- Table 74: Global Infant Nutrition Premix Volume K Forecast, by Application 2020 & 2033
- Table 75: Global Infant Nutrition Premix Revenue undefined Forecast, by Type 2020 & 2033
- Table 76: Global Infant Nutrition Premix Volume K Forecast, by Type 2020 & 2033
- Table 77: Global Infant Nutrition Premix Revenue undefined Forecast, by Country 2020 & 2033
- Table 78: Global Infant Nutrition Premix Volume K Forecast, by Country 2020 & 2033
- Table 79: China Infant Nutrition Premix Revenue (undefined) Forecast, by Application 2020 & 2033
- Table 80: China Infant Nutrition Premix Volume (K) Forecast, by Application 2020 & 2033
- Table 81: India Infant Nutrition Premix Revenue (undefined) Forecast, by Application 2020 & 2033
- Table 82: India Infant Nutrition Premix Volume (K) Forecast, by Application 2020 & 2033
- Table 83: Japan Infant Nutrition Premix Revenue (undefined) Forecast, by Application 2020 & 2033
- Table 84: Japan Infant Nutrition Premix Volume (K) Forecast, by Application 2020 & 2033
- Table 85: South Korea Infant Nutrition Premix Revenue (undefined) Forecast, by Application 2020 & 2033
- Table 86: South Korea Infant Nutrition Premix Volume (K) Forecast, by Application 2020 & 2033
- Table 87: ASEAN Infant Nutrition Premix Revenue (undefined) Forecast, by Application 2020 & 2033
- Table 88: ASEAN Infant Nutrition Premix Volume (K) Forecast, by Application 2020 & 2033
- Table 89: Oceania Infant Nutrition Premix Revenue (undefined) Forecast, by Application 2020 & 2033
- Table 90: Oceania Infant Nutrition Premix Volume (K) Forecast, by Application 2020 & 2033
- Table 91: Rest of Asia Pacific Infant Nutrition Premix Revenue (undefined) Forecast, by Application 2020 & 2033
- Table 92: Rest of Asia Pacific Infant Nutrition Premix Volume (K) Forecast, by Application 2020 & 2033
Frequently Asked Questions
1. What is the projected Compound Annual Growth Rate (CAGR) of the Infant Nutrition Premix?
The projected CAGR is approximately 5%.
2. Which companies are prominent players in the Infant Nutrition Premix?
Key companies in the market include Vitablend, Glanbia Nutritionals(NA, BARENTZ, DSM, Nestle, Royal FrieslandCampina, Richen Nantong, Prinova Solutions.
3. What are the main segments of the Infant Nutrition Premix?
The market segments include Application, Type.
4. Can you provide details about the market size?
The market size is estimated to be USD XXX N/A as of 2022.
5. What are some drivers contributing to market growth?
N/A
6. What are the notable trends driving market growth?
N/A
7. Are there any restraints impacting market growth?
N/A
8. Can you provide examples of recent developments in the market?
N/A
9. What pricing options are available for accessing the report?
Pricing options include single-user, multi-user, and enterprise licenses priced at USD 3950.00, USD 5925.00, and USD 7900.00 respectively.
10. Is the market size provided in terms of value or volume?
The market size is provided in terms of value, measured in N/A and volume, measured in K.
11. Are there any specific market keywords associated with the report?
Yes, the market keyword associated with the report is "Infant Nutrition Premix," which aids in identifying and referencing the specific market segment covered.
12. How do I determine which pricing option suits my needs best?
The pricing options vary based on user requirements and access needs. Individual users may opt for single-user licenses, while businesses requiring broader access may choose multi-user or enterprise licenses for cost-effective access to the report.
13. Are there any additional resources or data provided in the Infant Nutrition Premix report?
While the report offers comprehensive insights, it's advisable to review the specific contents or supplementary materials provided to ascertain if additional resources or data are available.
14. How can I stay updated on further developments or reports in the Infant Nutrition Premix?
To stay informed about further developments, trends, and reports in the Infant Nutrition Premix, consider subscribing to industry newsletters, following relevant companies and organizations, or regularly checking reputable industry news sources and publications.
Methodology
Step 1 - Identification of Relevant Samples Size from Population Database


Step 2 - Approaches for Defining Global Market Size (Value, Volume* & Price*)

Note*: In applicable scenarios
Step 3 - Data Sources
Primary Research
- Web Analytics
- Survey Reports
- Research Institute
- Latest Research Reports
- Opinion Leaders
Secondary Research
- Annual Reports
- White Paper
- Latest Press Release
- Industry Association
- Paid Database
- Investor Presentations

Step 4 - Data Triangulation
Involves using different sources of information in order to increase the validity of a study
These sources are likely to be stakeholders in a program - participants, other researchers, program staff, other community members, and so on.
Then we put all data in single framework & apply various statistical tools to find out the dynamic on the market.
During the analysis stage, feedback from the stakeholder groups would be compared to determine areas of agreement as well as areas of divergence