

Key Insights
The global Insurance Third-Party Administrators (TPA) market is projected for substantial growth, anticipated to reach $376.11 billion by 2033. Driven by a Compound Annual Growth Rate (CAGR) of 9.9% from the base year 2025, this expansion is underpinned by escalating healthcare expenditures and the increasing complexity of insurance claims. Insurers are increasingly outsourcing administrative functions to specialized TPAs to achieve cost efficiencies and enhance operational effectiveness. The adoption of advanced technologies, including AI and machine learning, is further streamlining claims processing and fraud detection, thereby boosting TPA demand. A heightened focus on customer experience, where TPAs are pivotal in improving service delivery and responsiveness, also contributes to market growth. Additionally, evolving regulatory mandates for greater transparency and accountability are driving the demand for TPAs' expertise in compliance and regulatory navigation.
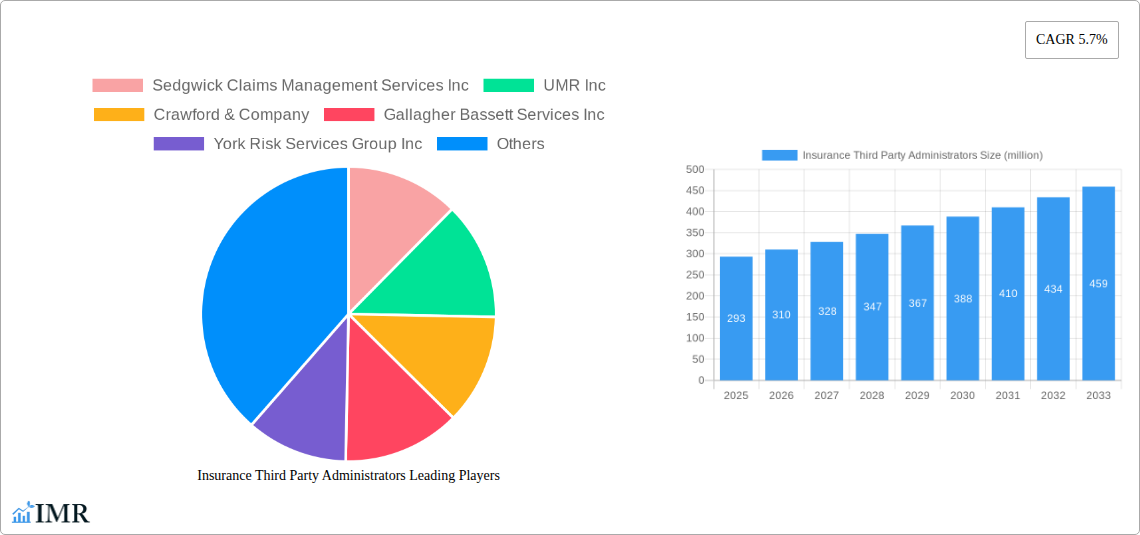
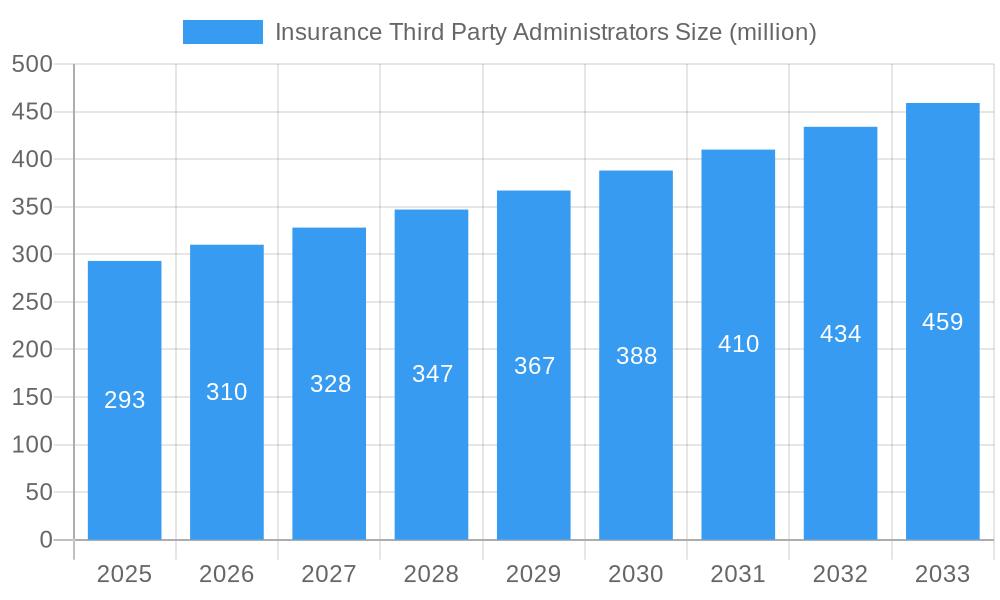
Insurance Third Party Administrators Market Size (In Billion)
Competitive dynamics within the TPA market are significant. Key players such as Sedgwick Claims Management Services Inc., UMR Inc., Crawford & Company, Gallagher Bassett Services Inc., York Risk Services Group Inc., and Maritain Health are actively pursuing market share through strategic mergers, acquisitions, technological advancements, and geographical expansion. While market entry barriers are relatively moderate, fostering a competitive environment, opportunities exist for new entrants. The market is broadly segmented by service type (e.g., claims management, billing, utilization review), client scale, and geographical reach. Future market trajectory will be influenced by continued technological innovation, dynamic regulatory environments, and the ongoing trend of outsourcing within the insurance industry.
Insurance Third Party Administrators Company Market Share
Insurance Third Party Administrators (TPA) Market Report: 2019-2033
This comprehensive report provides an in-depth analysis of the Insurance Third Party Administrators (TPA) market, encompassing market dynamics, growth trends, regional segmentation, product landscape, and key player profiles. The report covers the period 2019-2033, with a focus on the forecast period 2025-2033 and a base year of 2025. This invaluable resource is designed for insurance professionals, investors, and market researchers seeking a clear understanding of this dynamic sector.
Insurance Third Party Administrators Market Dynamics & Structure
This section analyzes the competitive landscape of the TPA market, focusing on market concentration, technological advancements, regulatory influences, and market forces shaping its evolution. The study period (2019-2024) revealed a moderately consolidated market, with the top five players – Sedgwick Claims Management Services Inc, UMR Inc, Crawford & Company, Gallagher Bassett Services Inc, and York Risk Services Group Inc – holding an estimated xx% market share in 2024.
- Market Concentration: High, with top 5 players controlling xx% of the market in 2024.
- Technological Innovation: Driven by AI, machine learning, and blockchain for claims processing and fraud detection. However, significant barriers exist in terms of legacy system integration and data security concerns.
- Regulatory Frameworks: Vary significantly across regions, impacting operational costs and compliance. Stringent regulations on data privacy (e.g., GDPR) are a major factor.
- Competitive Product Substitutes: Limited direct substitutes; however, internalization of TPA functions by larger insurers presents indirect competition.
- End-User Demographics: Primarily large insurers and self-insured entities. Growing demand from mid-sized businesses is observed.
- M&A Trends: Consistent M&A activity driven by expansion strategies and technological capabilities acquisition. The historical period saw approximately xx M&A deals, with an average deal value of $xx million.
Insurance Third Party Administrators Growth Trends & Insights
The global Insurance TPA market experienced significant growth between 2019 and 2024, driven by increasing healthcare costs, rising demand for specialized claims management, and the adoption of advanced technologies. The market size expanded from $xx million in 2019 to $xx million in 2024, exhibiting a CAGR of xx%. This growth is projected to continue during the forecast period (2025-2033), with a predicted CAGR of xx%, reaching $xx million by 2033. Market penetration is currently at xx% and is anticipated to increase to xx% by 2033, particularly within the SME sector. Technological advancements are significantly driving adoption rates, with the incorporation of AI and automation streamlining processes and improving efficiency. Changing consumer behavior, including a preference for digital solutions and personalized services, also fuels growth.
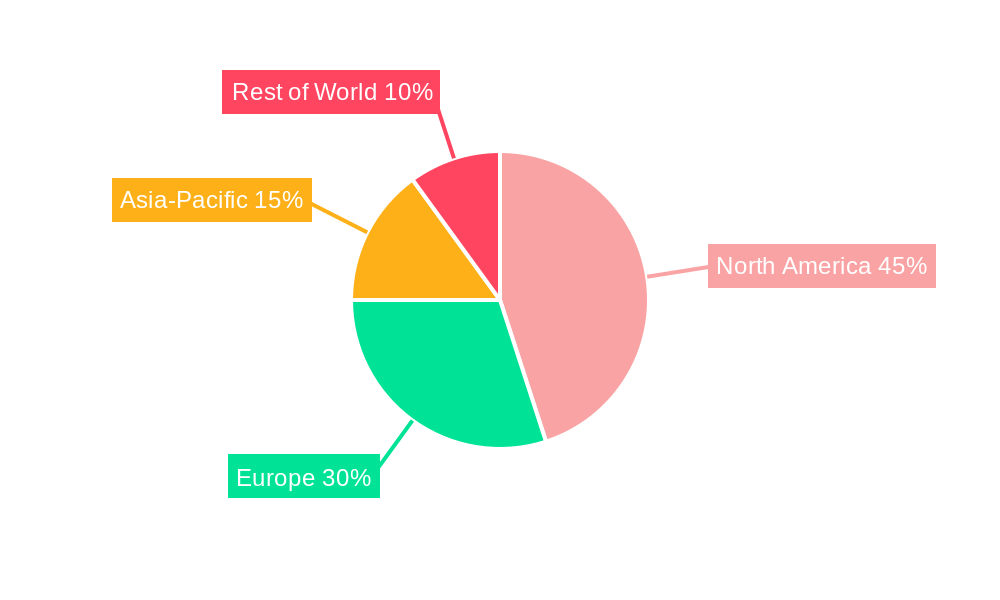
Dominant Regions, Countries, or Segments in Insurance Third Party Administrators
North America currently dominates the global TPA market, accounting for approximately xx% of the total market share in 2024, driven by robust insurance infrastructure, high healthcare expenditures, and a large self-insured population. Europe follows as a significant region, with a market share of xx%. Growth is also observed in the Asia-Pacific region, primarily in countries like India and China due to increasing insurance penetration and government initiatives.
- North America: High adoption of advanced technologies, substantial insurance industry, and presence of major TPA players.
- Europe: Stringent regulations, but increasing demand for specialized TPA services.
- Asia-Pacific: Rapidly growing insurance market, driven by economic expansion and rising middle class.
- Key Growth Drivers: Favorable economic policies, robust healthcare infrastructure, and increasing insurance awareness.
Insurance Third Party Administrators Product Landscape
The TPA market offers a wide range of services, including claims management, medical management, utilization review, and network administration. Recent product innovations focus on digital platforms, integrating AI-powered analytics for enhanced accuracy and speed in claims processing. Key selling propositions include cost reduction, improved efficiency, and access to specialized expertise. Technological advancements are continuously transforming the TPA landscape, with solutions that are more user-friendly, data-driven, and offer real-time insights.
Key Drivers, Barriers & Challenges in Insurance Third Party Administrators
Key Drivers: Rising healthcare costs, increasing demand for specialized claims management, advancements in technology (AI, machine learning), and the growing adoption of self-insured health plans.
Challenges: Data security and privacy concerns, regulatory compliance complexities (varying across regions), competition from large insurance companies offering in-house TPA services, and managing supply chain disruptions, such as workforce shortages. These challenges impact operational efficiency and profitability, estimated to reduce market growth by xx% annually.
Emerging Opportunities in Insurance Third Party Administrators
Untapped market segments, including small and medium-sized enterprises (SMEs) and emerging economies, present significant growth opportunities. Further innovation in areas such as blockchain technology for fraud detection and AI-powered predictive analytics to identify potential risks offer new revenue streams. Personalization of services, catering to individual customer needs, is also an attractive proposition for TPA providers.
Growth Accelerators in the Insurance Third Party Administrators Industry
Strategic partnerships and collaborations between TPAs and technology providers will be crucial for enhancing service offerings and driving efficiency gains. The expansion into new geographic markets, particularly in emerging economies with rising insurance penetration, will propel significant market growth. Technological breakthroughs in AI and machine learning will continue to revolutionize the sector.
Key Players Shaping the Insurance Third Party Administrators Market
Notable Milestones in Insurance Third Party Administrators Sector
- 2020, Q3: Sedgwick Claims Management Services Inc launched a new AI-powered claims processing platform.
- 2021, Q1: UMR Inc announced a strategic partnership with a leading technology company to enhance its data analytics capabilities.
- 2022, Q4: Gallagher Bassett Services Inc acquired a smaller TPA firm to expand its geographic footprint. (Further milestones require specific data)
In-Depth Insurance Third Party Administrators Market Outlook
The future of the Insurance TPA market is bright, with continued growth driven by technological innovation and rising demand for specialized services. The expansion into new markets and the implementation of innovative solutions will create lucrative opportunities for existing and new players. Strategic partnerships and acquisitions will play a key role in shaping the future of the industry, leading to a more consolidated market with a focus on technology-driven solutions.
Insurance Third Party Administrators Segmentation
-
1. Application
- 1.1. Patient
- 1.2. Old man
- 1.3. Other
-
2. Types
- 2.1. Healthcare Providers
- 2.2. Commercial General Liability
- 2.3. Others
Insurance Third Party Administrators Segmentation By Geography
-
1. North America
- 1.1. United States
- 1.2. Canada
- 1.3. Mexico
-
2. South America
- 2.1. Brazil
- 2.2. Argentina
- 2.3. Rest of South America
-
3. Europe
- 3.1. United Kingdom
- 3.2. Germany
- 3.3. France
- 3.4. Italy
- 3.5. Spain
- 3.6. Russia
- 3.7. Benelux
- 3.8. Nordics
- 3.9. Rest of Europe
-
4. Middle East & Africa
- 4.1. Turkey
- 4.2. Israel
- 4.3. GCC
- 4.4. North Africa
- 4.5. South Africa
- 4.6. Rest of Middle East & Africa
-
5. Asia Pacific
- 5.1. China
- 5.2. India
- 5.3. Japan
- 5.4. South Korea
- 5.5. ASEAN
- 5.6. Oceania
- 5.7. Rest of Asia Pacific
Insurance Third Party Administrators Regional Market Share
Geographic Coverage of Insurance Third Party Administrators
Insurance Third Party Administrators REPORT HIGHLIGHTS
| Aspects | Details |
|---|---|
| Study Period | 2020-2034 |
| Base Year | 2025 |
| Estimated Year | 2026 |
| Forecast Period | 2026-2034 |
| Historical Period | 2020-2025 |
| Growth Rate | CAGR of 9.9% from 2020-2034 |
| Segmentation |
|
Table of Contents
- 1. Introduction
- 1.1. Research Scope
- 1.2. Market Segmentation
- 1.3. Research Methodology
- 1.4. Definitions and Assumptions
- 2. Executive Summary
- 2.1. Introduction
- 3. Market Dynamics
- 3.1. Introduction
- 3.2. Market Drivers
- 3.3. Market Restrains
- 3.4. Market Trends
- 4. Market Factor Analysis
- 4.1. Porters Five Forces
- 4.2. Supply/Value Chain
- 4.3. PESTEL analysis
- 4.4. Market Entropy
- 4.5. Patent/Trademark Analysis
- 5. Global Insurance Third Party Administrators Analysis, Insights and Forecast, 2020-2032
- 5.1. Market Analysis, Insights and Forecast - by Application
- 5.1.1. Patient
- 5.1.2. Old man
- 5.1.3. Other
- 5.2. Market Analysis, Insights and Forecast - by Types
- 5.2.1. Healthcare Providers
- 5.2.2. Commercial General Liability
- 5.2.3. Others
- 5.3. Market Analysis, Insights and Forecast - by Region
- 5.3.1. North America
- 5.3.2. South America
- 5.3.3. Europe
- 5.3.4. Middle East & Africa
- 5.3.5. Asia Pacific
- 5.1. Market Analysis, Insights and Forecast - by Application
- 6. North America Insurance Third Party Administrators Analysis, Insights and Forecast, 2020-2032
- 6.1. Market Analysis, Insights and Forecast - by Application
- 6.1.1. Patient
- 6.1.2. Old man
- 6.1.3. Other
- 6.2. Market Analysis, Insights and Forecast - by Types
- 6.2.1. Healthcare Providers
- 6.2.2. Commercial General Liability
- 6.2.3. Others
- 6.1. Market Analysis, Insights and Forecast - by Application
- 7. South America Insurance Third Party Administrators Analysis, Insights and Forecast, 2020-2032
- 7.1. Market Analysis, Insights and Forecast - by Application
- 7.1.1. Patient
- 7.1.2. Old man
- 7.1.3. Other
- 7.2. Market Analysis, Insights and Forecast - by Types
- 7.2.1. Healthcare Providers
- 7.2.2. Commercial General Liability
- 7.2.3. Others
- 7.1. Market Analysis, Insights and Forecast - by Application
- 8. Europe Insurance Third Party Administrators Analysis, Insights and Forecast, 2020-2032
- 8.1. Market Analysis, Insights and Forecast - by Application
- 8.1.1. Patient
- 8.1.2. Old man
- 8.1.3. Other
- 8.2. Market Analysis, Insights and Forecast - by Types
- 8.2.1. Healthcare Providers
- 8.2.2. Commercial General Liability
- 8.2.3. Others
- 8.1. Market Analysis, Insights and Forecast - by Application
- 9. Middle East & Africa Insurance Third Party Administrators Analysis, Insights and Forecast, 2020-2032
- 9.1. Market Analysis, Insights and Forecast - by Application
- 9.1.1. Patient
- 9.1.2. Old man
- 9.1.3. Other
- 9.2. Market Analysis, Insights and Forecast - by Types
- 9.2.1. Healthcare Providers
- 9.2.2. Commercial General Liability
- 9.2.3. Others
- 9.1. Market Analysis, Insights and Forecast - by Application
- 10. Asia Pacific Insurance Third Party Administrators Analysis, Insights and Forecast, 2020-2032
- 10.1. Market Analysis, Insights and Forecast - by Application
- 10.1.1. Patient
- 10.1.2. Old man
- 10.1.3. Other
- 10.2. Market Analysis, Insights and Forecast - by Types
- 10.2.1. Healthcare Providers
- 10.2.2. Commercial General Liability
- 10.2.3. Others
- 10.1. Market Analysis, Insights and Forecast - by Application
- 11. Competitive Analysis
- 11.1. Global Market Share Analysis 2025
- 11.2. Company Profiles
- 11.2.1 Sedgwick Claims Management Services Inc
- 11.2.1.1. Overview
- 11.2.1.2. Products
- 11.2.1.3. SWOT Analysis
- 11.2.1.4. Recent Developments
- 11.2.1.5. Financials (Based on Availability)
- 11.2.2 UMR Inc
- 11.2.2.1. Overview
- 11.2.2.2. Products
- 11.2.2.3. SWOT Analysis
- 11.2.2.4. Recent Developments
- 11.2.2.5. Financials (Based on Availability)
- 11.2.3 Crawford & Company
- 11.2.3.1. Overview
- 11.2.3.2. Products
- 11.2.3.3. SWOT Analysis
- 11.2.3.4. Recent Developments
- 11.2.3.5. Financials (Based on Availability)
- 11.2.4 Gallagher Bassett Services Inc
- 11.2.4.1. Overview
- 11.2.4.2. Products
- 11.2.4.3. SWOT Analysis
- 11.2.4.4. Recent Developments
- 11.2.4.5. Financials (Based on Availability)
- 11.2.5 York Risk Services Group Inc
- 11.2.5.1. Overview
- 11.2.5.2. Products
- 11.2.5.3. SWOT Analysis
- 11.2.5.4. Recent Developments
- 11.2.5.5. Financials (Based on Availability)
- 11.2.6 Maritain Health
- 11.2.6.1. Overview
- 11.2.6.2. Products
- 11.2.6.3. SWOT Analysis
- 11.2.6.4. Recent Developments
- 11.2.6.5. Financials (Based on Availability)
- 11.2.1 Sedgwick Claims Management Services Inc
List of Figures
- Figure 1: Global Insurance Third Party Administrators Revenue Breakdown (billion, %) by Region 2025 & 2033
- Figure 2: North America Insurance Third Party Administrators Revenue (billion), by Application 2025 & 2033
- Figure 3: North America Insurance Third Party Administrators Revenue Share (%), by Application 2025 & 2033
- Figure 4: North America Insurance Third Party Administrators Revenue (billion), by Types 2025 & 2033
- Figure 5: North America Insurance Third Party Administrators Revenue Share (%), by Types 2025 & 2033
- Figure 6: North America Insurance Third Party Administrators Revenue (billion), by Country 2025 & 2033
- Figure 7: North America Insurance Third Party Administrators Revenue Share (%), by Country 2025 & 2033
- Figure 8: South America Insurance Third Party Administrators Revenue (billion), by Application 2025 & 2033
- Figure 9: South America Insurance Third Party Administrators Revenue Share (%), by Application 2025 & 2033
- Figure 10: South America Insurance Third Party Administrators Revenue (billion), by Types 2025 & 2033
- Figure 11: South America Insurance Third Party Administrators Revenue Share (%), by Types 2025 & 2033
- Figure 12: South America Insurance Third Party Administrators Revenue (billion), by Country 2025 & 2033
- Figure 13: South America Insurance Third Party Administrators Revenue Share (%), by Country 2025 & 2033
- Figure 14: Europe Insurance Third Party Administrators Revenue (billion), by Application 2025 & 2033
- Figure 15: Europe Insurance Third Party Administrators Revenue Share (%), by Application 2025 & 2033
- Figure 16: Europe Insurance Third Party Administrators Revenue (billion), by Types 2025 & 2033
- Figure 17: Europe Insurance Third Party Administrators Revenue Share (%), by Types 2025 & 2033
- Figure 18: Europe Insurance Third Party Administrators Revenue (billion), by Country 2025 & 2033
- Figure 19: Europe Insurance Third Party Administrators Revenue Share (%), by Country 2025 & 2033
- Figure 20: Middle East & Africa Insurance Third Party Administrators Revenue (billion), by Application 2025 & 2033
- Figure 21: Middle East & Africa Insurance Third Party Administrators Revenue Share (%), by Application 2025 & 2033
- Figure 22: Middle East & Africa Insurance Third Party Administrators Revenue (billion), by Types 2025 & 2033
- Figure 23: Middle East & Africa Insurance Third Party Administrators Revenue Share (%), by Types 2025 & 2033
- Figure 24: Middle East & Africa Insurance Third Party Administrators Revenue (billion), by Country 2025 & 2033
- Figure 25: Middle East & Africa Insurance Third Party Administrators Revenue Share (%), by Country 2025 & 2033
- Figure 26: Asia Pacific Insurance Third Party Administrators Revenue (billion), by Application 2025 & 2033
- Figure 27: Asia Pacific Insurance Third Party Administrators Revenue Share (%), by Application 2025 & 2033
- Figure 28: Asia Pacific Insurance Third Party Administrators Revenue (billion), by Types 2025 & 2033
- Figure 29: Asia Pacific Insurance Third Party Administrators Revenue Share (%), by Types 2025 & 2033
- Figure 30: Asia Pacific Insurance Third Party Administrators Revenue (billion), by Country 2025 & 2033
- Figure 31: Asia Pacific Insurance Third Party Administrators Revenue Share (%), by Country 2025 & 2033
List of Tables
- Table 1: Global Insurance Third Party Administrators Revenue billion Forecast, by Application 2020 & 2033
- Table 2: Global Insurance Third Party Administrators Revenue billion Forecast, by Types 2020 & 2033
- Table 3: Global Insurance Third Party Administrators Revenue billion Forecast, by Region 2020 & 2033
- Table 4: Global Insurance Third Party Administrators Revenue billion Forecast, by Application 2020 & 2033
- Table 5: Global Insurance Third Party Administrators Revenue billion Forecast, by Types 2020 & 2033
- Table 6: Global Insurance Third Party Administrators Revenue billion Forecast, by Country 2020 & 2033
- Table 7: United States Insurance Third Party Administrators Revenue (billion) Forecast, by Application 2020 & 2033
- Table 8: Canada Insurance Third Party Administrators Revenue (billion) Forecast, by Application 2020 & 2033
- Table 9: Mexico Insurance Third Party Administrators Revenue (billion) Forecast, by Application 2020 & 2033
- Table 10: Global Insurance Third Party Administrators Revenue billion Forecast, by Application 2020 & 2033
- Table 11: Global Insurance Third Party Administrators Revenue billion Forecast, by Types 2020 & 2033
- Table 12: Global Insurance Third Party Administrators Revenue billion Forecast, by Country 2020 & 2033
- Table 13: Brazil Insurance Third Party Administrators Revenue (billion) Forecast, by Application 2020 & 2033
- Table 14: Argentina Insurance Third Party Administrators Revenue (billion) Forecast, by Application 2020 & 2033
- Table 15: Rest of South America Insurance Third Party Administrators Revenue (billion) Forecast, by Application 2020 & 2033
- Table 16: Global Insurance Third Party Administrators Revenue billion Forecast, by Application 2020 & 2033
- Table 17: Global Insurance Third Party Administrators Revenue billion Forecast, by Types 2020 & 2033
- Table 18: Global Insurance Third Party Administrators Revenue billion Forecast, by Country 2020 & 2033
- Table 19: United Kingdom Insurance Third Party Administrators Revenue (billion) Forecast, by Application 2020 & 2033
- Table 20: Germany Insurance Third Party Administrators Revenue (billion) Forecast, by Application 2020 & 2033
- Table 21: France Insurance Third Party Administrators Revenue (billion) Forecast, by Application 2020 & 2033
- Table 22: Italy Insurance Third Party Administrators Revenue (billion) Forecast, by Application 2020 & 2033
- Table 23: Spain Insurance Third Party Administrators Revenue (billion) Forecast, by Application 2020 & 2033
- Table 24: Russia Insurance Third Party Administrators Revenue (billion) Forecast, by Application 2020 & 2033
- Table 25: Benelux Insurance Third Party Administrators Revenue (billion) Forecast, by Application 2020 & 2033
- Table 26: Nordics Insurance Third Party Administrators Revenue (billion) Forecast, by Application 2020 & 2033
- Table 27: Rest of Europe Insurance Third Party Administrators Revenue (billion) Forecast, by Application 2020 & 2033
- Table 28: Global Insurance Third Party Administrators Revenue billion Forecast, by Application 2020 & 2033
- Table 29: Global Insurance Third Party Administrators Revenue billion Forecast, by Types 2020 & 2033
- Table 30: Global Insurance Third Party Administrators Revenue billion Forecast, by Country 2020 & 2033
- Table 31: Turkey Insurance Third Party Administrators Revenue (billion) Forecast, by Application 2020 & 2033
- Table 32: Israel Insurance Third Party Administrators Revenue (billion) Forecast, by Application 2020 & 2033
- Table 33: GCC Insurance Third Party Administrators Revenue (billion) Forecast, by Application 2020 & 2033
- Table 34: North Africa Insurance Third Party Administrators Revenue (billion) Forecast, by Application 2020 & 2033
- Table 35: South Africa Insurance Third Party Administrators Revenue (billion) Forecast, by Application 2020 & 2033
- Table 36: Rest of Middle East & Africa Insurance Third Party Administrators Revenue (billion) Forecast, by Application 2020 & 2033
- Table 37: Global Insurance Third Party Administrators Revenue billion Forecast, by Application 2020 & 2033
- Table 38: Global Insurance Third Party Administrators Revenue billion Forecast, by Types 2020 & 2033
- Table 39: Global Insurance Third Party Administrators Revenue billion Forecast, by Country 2020 & 2033
- Table 40: China Insurance Third Party Administrators Revenue (billion) Forecast, by Application 2020 & 2033
- Table 41: India Insurance Third Party Administrators Revenue (billion) Forecast, by Application 2020 & 2033
- Table 42: Japan Insurance Third Party Administrators Revenue (billion) Forecast, by Application 2020 & 2033
- Table 43: South Korea Insurance Third Party Administrators Revenue (billion) Forecast, by Application 2020 & 2033
- Table 44: ASEAN Insurance Third Party Administrators Revenue (billion) Forecast, by Application 2020 & 2033
- Table 45: Oceania Insurance Third Party Administrators Revenue (billion) Forecast, by Application 2020 & 2033
- Table 46: Rest of Asia Pacific Insurance Third Party Administrators Revenue (billion) Forecast, by Application 2020 & 2033
Frequently Asked Questions
1. What is the projected Compound Annual Growth Rate (CAGR) of the Insurance Third Party Administrators?
The projected CAGR is approximately 9.9%.
2. Which companies are prominent players in the Insurance Third Party Administrators?
Key companies in the market include Sedgwick Claims Management Services Inc, UMR Inc, Crawford & Company, Gallagher Bassett Services Inc, York Risk Services Group Inc, Maritain Health.
3. What are the main segments of the Insurance Third Party Administrators?
The market segments include Application, Types.
4. Can you provide details about the market size?
The market size is estimated to be USD 376.11 billion as of 2022.
5. What are some drivers contributing to market growth?
N/A
6. What are the notable trends driving market growth?
N/A
7. Are there any restraints impacting market growth?
N/A
8. Can you provide examples of recent developments in the market?
N/A
9. What pricing options are available for accessing the report?
Pricing options include single-user, multi-user, and enterprise licenses priced at USD 4900.00, USD 7350.00, and USD 9800.00 respectively.
10. Is the market size provided in terms of value or volume?
The market size is provided in terms of value, measured in billion.
11. Are there any specific market keywords associated with the report?
Yes, the market keyword associated with the report is "Insurance Third Party Administrators," which aids in identifying and referencing the specific market segment covered.
12. How do I determine which pricing option suits my needs best?
The pricing options vary based on user requirements and access needs. Individual users may opt for single-user licenses, while businesses requiring broader access may choose multi-user or enterprise licenses for cost-effective access to the report.
13. Are there any additional resources or data provided in the Insurance Third Party Administrators report?
While the report offers comprehensive insights, it's advisable to review the specific contents or supplementary materials provided to ascertain if additional resources or data are available.
14. How can I stay updated on further developments or reports in the Insurance Third Party Administrators?
To stay informed about further developments, trends, and reports in the Insurance Third Party Administrators, consider subscribing to industry newsletters, following relevant companies and organizations, or regularly checking reputable industry news sources and publications.
Methodology
Step 1 - Identification of Relevant Samples Size from Population Database


Step 2 - Approaches for Defining Global Market Size (Value, Volume* & Price*)

Note*: In applicable scenarios
Step 3 - Data Sources
Primary Research
- Web Analytics
- Survey Reports
- Research Institute
- Latest Research Reports
- Opinion Leaders
Secondary Research
- Annual Reports
- White Paper
- Latest Press Release
- Industry Association
- Paid Database
- Investor Presentations

Step 4 - Data Triangulation
Involves using different sources of information in order to increase the validity of a study
These sources are likely to be stakeholders in a program - participants, other researchers, program staff, other community members, and so on.
Then we put all data in single framework & apply various statistical tools to find out the dynamic on the market.
During the analysis stage, feedback from the stakeholder groups would be compared to determine areas of agreement as well as areas of divergence