

Key Insights
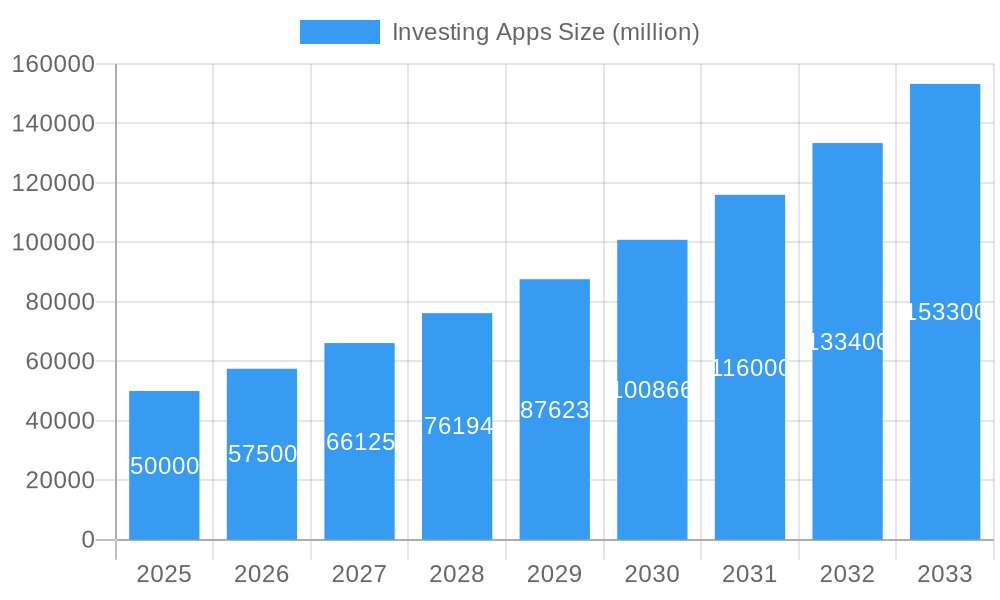
The investing app market is poised for substantial expansion, fueled by increasing fintech accessibility and the digital fluency of emerging investor demographics. The market is projected to reach $0.93 billion by 2025, with a Compound Annual Growth Rate (CAGR) of 19.3% from 2025 to 2033. Key growth drivers include intuitive interfaces and educational resources that democratize investing, alongside the appeal of robo-advisors and automated features for efficient portfolio management. The pervasive adoption of mobile-first platforms enables seamless, on-the-go financial management. Leading platforms such as Robinhood, Acorns, and Betterment are actively innovating, introducing novel features and investment avenues to enhance user acquisition and retention. While the market is currently characterized by established leaders, emerging players are increasingly targeting specialized segments like sustainable investing and fractional share trading.
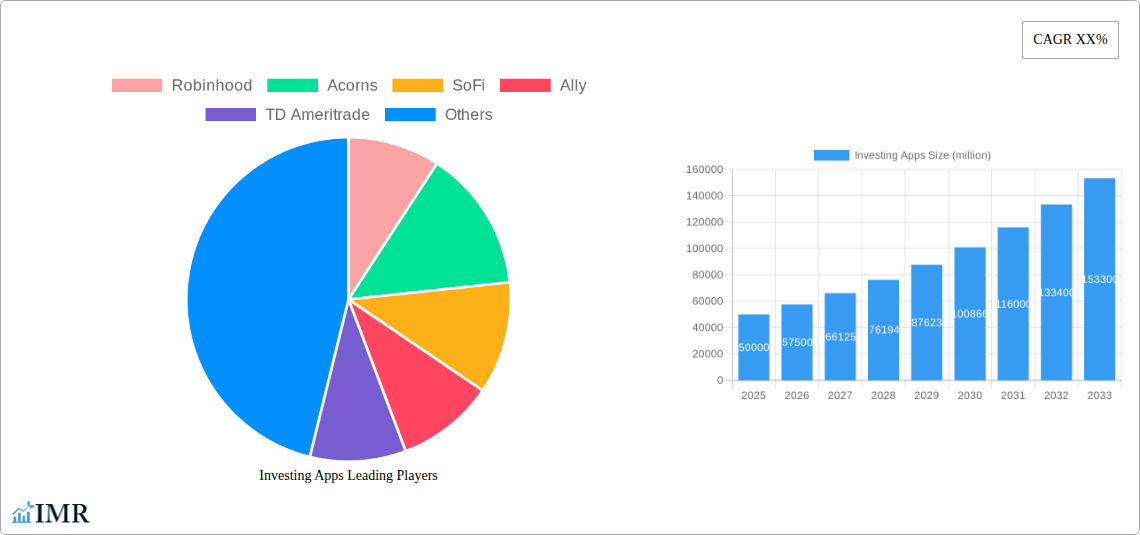
Investing Apps Market Size (In Million)
Despite robust growth prospects, the market confronts potential challenges. Heightened regulatory oversight may influence operational costs and pricing strategies. Cybersecurity and data privacy concerns remain critical considerations. Additionally, economic volatility could impact investor confidence and market size, though the inherent convenience of investing apps may offer some resilience. Intense competition from established financial institutions, leveraging brand equity and integrated services, necessitates continuous innovation. Sustained success will depend on a commitment to robust security, exceptional customer support, and ongoing feature enhancements aligned with evolving user demands and financial aspirations. Personalized investment guidance and education tailored to individual risk tolerance and objectives will be pivotal for market leaders.
Investing Apps Company Market Share
Investing Apps Market Report: 2019-2033
This comprehensive report delivers an in-depth analysis of the global investing apps market, encompassing market dynamics, growth trends, competitive landscape, and future outlook. The study period covers 2019-2033, with 2025 as the base and estimated year, and a forecast period of 2025-2033. The report provides valuable insights for industry professionals, investors, and businesses seeking to navigate this rapidly evolving sector. The market is segmented into parent market (Financial Technology) and child market (Investing Apps).
Investing Apps Market Dynamics & Structure
The investing apps market exhibits a dynamic interplay of factors, including increasing market concentration among leading players, rapid technological innovation, evolving regulatory landscapes, and the emergence of competitive substitutes. The market is characterized by a blend of established financial institutions and agile fintech startups. Mergers and acquisitions (M&A) activity has been significant, consolidating market share and driving innovation. End-user demographics are expanding beyond traditional investors to include younger, tech-savvy individuals.
- Market Concentration: The top 5 players command approximately xx% of the market share in 2025, with a predicted xx% increase by 2033.
- Technological Innovation: AI-powered robo-advisors, personalized investment strategies, and enhanced security features are key drivers.
- Regulatory Frameworks: Increasing regulatory scrutiny necessitates compliance with data privacy and security standards, impacting operational costs.
- Competitive Substitutes: Traditional brokerage firms and high-street banking services offer competition, requiring continuous innovation to retain market share.
- End-User Demographics: Millennials and Gen Z represent a significant growth segment, driving demand for user-friendly mobile interfaces and gamified investment experiences.
- M&A Trends: A total of xx M&A deals were recorded between 2019 and 2024, with an estimated xx deals projected for 2025-2033.
Investing Apps Growth Trends & Insights
The global investing apps market experienced significant growth during the historical period (2019-2024), fueled by the widespread adoption of smartphones, increased financial literacy, and the democratization of investment opportunities. The market size reached $xx billion in 2024 and is projected to reach $xx billion by 2033, exhibiting a Compound Annual Growth Rate (CAGR) of xx% during the forecast period. This growth is attributed to factors such as increased smartphone penetration, rising disposable incomes, and the growing popularity of commission-free trading. Technological disruptions, such as the introduction of AI-powered robo-advisors and blockchain technology, are further accelerating market growth. Consumer behavior is shifting towards digital-first investment strategies, driven by convenience, accessibility, and transparency.
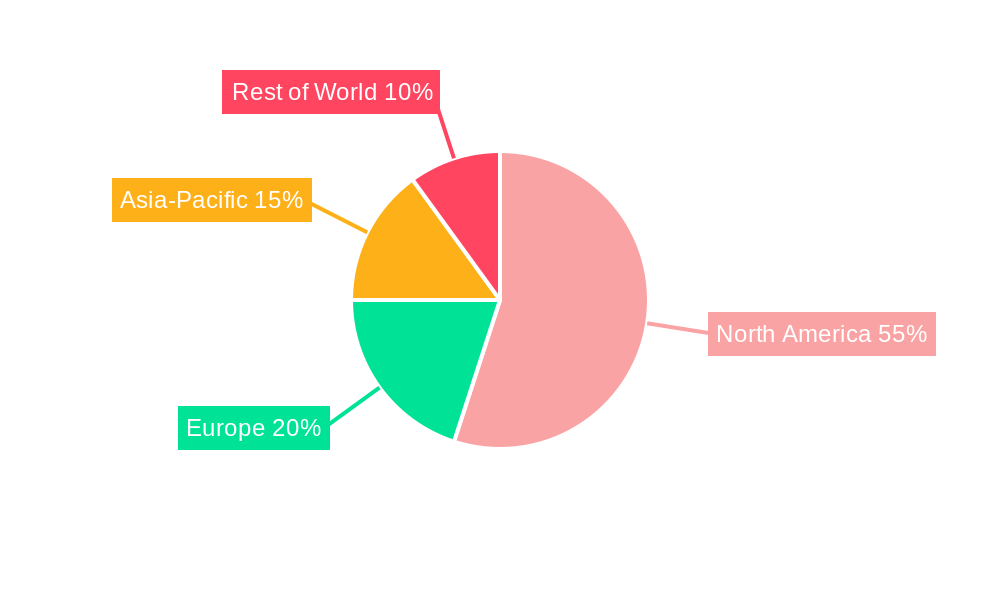
Dominant Regions, Countries, or Segments in Investing Apps
North America currently dominates the global investing apps market, driven by high smartphone penetration, robust financial infrastructure, and a favorable regulatory environment. However, the Asia-Pacific region is projected to witness significant growth during the forecast period, propelled by rising disposable incomes, increasing internet and smartphone usage, and a burgeoning young population.
- Key Drivers in North America: Established financial ecosystems, high levels of financial literacy, and early adoption of fintech innovations.
- Key Drivers in Asia-Pacific: Rapid economic growth, increasing smartphone penetration, and a growing young, tech-savvy population.
- Market Share: North America holds approximately xx% of the market share in 2025, with Asia-Pacific projected to reach xx% by 2033.
Investing Apps Product Landscape
The investing apps landscape is characterized by a diverse range of offerings, catering to varying investor needs and risk profiles. Products range from commission-free trading platforms and robo-advisors to fractional share investing and socially driven investment communities. Technological advancements, such as AI-powered portfolio optimization and personalized financial planning tools, are enhancing the user experience and driving product innovation. Unique selling propositions include user-friendly interfaces, educational resources, and sophisticated investment tools.
Key Drivers, Barriers & Challenges in Investing Apps
Key Drivers:
- Increased smartphone penetration and internet access.
- Rising disposable incomes and financial literacy.
- The emergence of commission-free trading platforms.
- Government initiatives promoting financial inclusion.
Challenges:
- Regulatory uncertainty and compliance costs.
- Cybersecurity threats and data privacy concerns.
- Intense competition from established players and new entrants.
- The need to maintain user trust and address potential market manipulation. Estimated losses due to security breaches and regulatory fines amount to approximately $xx million annually.
Emerging Opportunities in Investing Apps
- Expansion into untapped markets, particularly in emerging economies.
- Development of innovative investment products catering to specific niche segments (e.g., ESG investing, cryptocurrencies).
- Integration of AI and machine learning for personalized financial advice.
- Leveraging blockchain technology for enhanced security and transparency.
Growth Accelerators in the Investing Apps Industry
The long-term growth of the investing apps industry will be propelled by technological advancements such as the integration of artificial intelligence and machine learning, enhancing personalization and user experience. Strategic partnerships with established financial institutions and expansion into new geographical markets will also be crucial drivers. Furthermore, the development of innovative investment products and services will cater to evolving investor demands.
Key Players Shaping the Investing Apps Market
Notable Milestones in Investing Apps Sector
- 2020: Robinhood experiences a surge in user registrations amid the COVID-19 pandemic and increased retail investor activity.
- 2021: Several major mergers and acquisitions occur within the industry, reshaping the competitive landscape.
- 2022: Increased regulatory scrutiny leads to stricter compliance requirements for investing apps.
- 2023: New features such as AI-powered portfolio management and fractional share investing are widely adopted.
In-Depth Investing Apps Market Outlook
The future of the investing apps market is bright, with continued growth driven by technological innovations, increasing financial literacy, and the expansion of the investor base. Strategic partnerships, geographic expansion, and the development of new financial products will contribute to significant market growth. The market is poised to become even more competitive, necessitating a continuous focus on innovation, user experience, and regulatory compliance to maintain a leading position.
Investing Apps Segmentation
-
1. Application
- 1.1. Personal and Family Use
- 1.2. Enterprise Use
-
2. Types
- 2.1. Cloud-based
- 2.2. On-premises
Investing Apps Segmentation By Geography
-
1. North America
- 1.1. United States
- 1.2. Canada
- 1.3. Mexico
-
2. South America
- 2.1. Brazil
- 2.2. Argentina
- 2.3. Rest of South America
-
3. Europe
- 3.1. United Kingdom
- 3.2. Germany
- 3.3. France
- 3.4. Italy
- 3.5. Spain
- 3.6. Russia
- 3.7. Benelux
- 3.8. Nordics
- 3.9. Rest of Europe
-
4. Middle East & Africa
- 4.1. Turkey
- 4.2. Israel
- 4.3. GCC
- 4.4. North Africa
- 4.5. South Africa
- 4.6. Rest of Middle East & Africa
-
5. Asia Pacific
- 5.1. China
- 5.2. India
- 5.3. Japan
- 5.4. South Korea
- 5.5. ASEAN
- 5.6. Oceania
- 5.7. Rest of Asia Pacific
Investing Apps Regional Market Share
Geographic Coverage of Investing Apps
Investing Apps REPORT HIGHLIGHTS
| Aspects | Details |
|---|---|
| Study Period | 2020-2034 |
| Base Year | 2025 |
| Estimated Year | 2026 |
| Forecast Period | 2026-2034 |
| Historical Period | 2020-2025 |
| Growth Rate | CAGR of 19.3% from 2020-2034 |
| Segmentation |
|
Table of Contents
- 1. Introduction
- 1.1. Research Scope
- 1.2. Market Segmentation
- 1.3. Research Objective
- 1.4. Definitions and Assumptions
- 2. Executive Summary
- 2.1. Market Snapshot
- 3. Market Dynamics
- 3.1. Market Drivers
- 3.2. Market Restrains
- 3.3. Market Trends
- 3.4. Market Opportunities
- 4. Market Factor Analysis
- 4.1. Porters Five Forces
- 4.1.1. Bargaining Power of Suppliers
- 4.1.2. Bargaining Power of Buyers
- 4.1.3. Threat of New Entrants
- 4.1.4. Threat of Substitutes
- 4.1.5. Competitive Rivalry
- 4.2. PESTEL analysis
- 4.3. BCG Analysis
- 4.3.1. Stars (High Growth, High Market Share)
- 4.3.2. Cash Cows (Low Growth, High Market Share)
- 4.3.3. Question Mark (High Growth, Low Market Share)
- 4.3.4. Dogs (Low Growth, Low Market Share)
- 4.4. Ansoff Matrix Analysis
- 4.5. Supply Chain Analysis
- 4.6. Regulatory Landscape
- 4.7. Current Market Potential and Opportunity Assessment (TAM–SAM–SOM Framework)
- 4.8. IMR Analyst Note
- 4.1. Porters Five Forces
- 5. Market Analysis, Insights and Forecast 2021-2033
- 5.1. Market Analysis, Insights and Forecast - by Application
- 5.1.1. Personal and Family Use
- 5.1.2. Enterprise Use
- 5.2. Market Analysis, Insights and Forecast - by Types
- 5.2.1. Cloud-based
- 5.2.2. On-premises
- 5.3. Market Analysis, Insights and Forecast - by Region
- 5.3.1. North America
- 5.3.2. South America
- 5.3.3. Europe
- 5.3.4. Middle East & Africa
- 5.3.5. Asia Pacific
- 5.1. Market Analysis, Insights and Forecast - by Application
- 6. Global Investing Apps Analysis, Insights and Forecast, 2021-2033
- 6.1. Market Analysis, Insights and Forecast - by Application
- 6.1.1. Personal and Family Use
- 6.1.2. Enterprise Use
- 6.2. Market Analysis, Insights and Forecast - by Types
- 6.2.1. Cloud-based
- 6.2.2. On-premises
- 6.1. Market Analysis, Insights and Forecast - by Application
- 7. North America Investing Apps Analysis, Insights and Forecast, 2020-2032
- 7.1. Market Analysis, Insights and Forecast - by Application
- 7.1.1. Personal and Family Use
- 7.1.2. Enterprise Use
- 7.2. Market Analysis, Insights and Forecast - by Types
- 7.2.1. Cloud-based
- 7.2.2. On-premises
- 7.1. Market Analysis, Insights and Forecast - by Application
- 8. South America Investing Apps Analysis, Insights and Forecast, 2020-2032
- 8.1. Market Analysis, Insights and Forecast - by Application
- 8.1.1. Personal and Family Use
- 8.1.2. Enterprise Use
- 8.2. Market Analysis, Insights and Forecast - by Types
- 8.2.1. Cloud-based
- 8.2.2. On-premises
- 8.1. Market Analysis, Insights and Forecast - by Application
- 9. Europe Investing Apps Analysis, Insights and Forecast, 2020-2032
- 9.1. Market Analysis, Insights and Forecast - by Application
- 9.1.1. Personal and Family Use
- 9.1.2. Enterprise Use
- 9.2. Market Analysis, Insights and Forecast - by Types
- 9.2.1. Cloud-based
- 9.2.2. On-premises
- 9.1. Market Analysis, Insights and Forecast - by Application
- 10. Middle East & Africa Investing Apps Analysis, Insights and Forecast, 2020-2032
- 10.1. Market Analysis, Insights and Forecast - by Application
- 10.1.1. Personal and Family Use
- 10.1.2. Enterprise Use
- 10.2. Market Analysis, Insights and Forecast - by Types
- 10.2.1. Cloud-based
- 10.2.2. On-premises
- 10.1. Market Analysis, Insights and Forecast - by Application
- 11. Asia Pacific Investing Apps Analysis, Insights and Forecast, 2020-2032
- 11.1. Market Analysis, Insights and Forecast - by Application
- 11.1.1. Personal and Family Use
- 11.1.2. Enterprise Use
- 11.2. Market Analysis, Insights and Forecast - by Types
- 11.2.1. Cloud-based
- 11.2.2. On-premises
- 11.1. Market Analysis, Insights and Forecast - by Application
- 12. Competitive Analysis
- 12.1. Company Profiles
- 12.1.1 Robinhood
- 12.1.1.1. Company Overview
- 12.1.1.2. Products
- 12.1.1.3. Company Financials
- 12.1.1.4. SWOT Analysis
- 12.1.2 Acorns
- 12.1.2.1. Company Overview
- 12.1.2.2. Products
- 12.1.2.3. Company Financials
- 12.1.2.4. SWOT Analysis
- 12.1.3 SoFi
- 12.1.3.1. Company Overview
- 12.1.3.2. Products
- 12.1.3.3. Company Financials
- 12.1.3.4. SWOT Analysis
- 12.1.4 Ally
- 12.1.4.1. Company Overview
- 12.1.4.2. Products
- 12.1.4.3. Company Financials
- 12.1.4.4. SWOT Analysis
- 12.1.5 TD Ameritrade
- 12.1.5.1. Company Overview
- 12.1.5.2. Products
- 12.1.5.3. Company Financials
- 12.1.5.4. SWOT Analysis
- 12.1.6 Public Investing
- 12.1.6.1. Company Overview
- 12.1.6.2. Products
- 12.1.6.3. Company Financials
- 12.1.6.4. SWOT Analysis
- 12.1.7 Stockpile
- 12.1.7.1. Company Overview
- 12.1.7.2. Products
- 12.1.7.3. Company Financials
- 12.1.7.4. SWOT Analysis
- 12.1.8 Betterment
- 12.1.8.1. Company Overview
- 12.1.8.2. Products
- 12.1.8.3. Company Financials
- 12.1.8.4. SWOT Analysis
- 12.1.9 Cash App Investing
- 12.1.9.1. Company Overview
- 12.1.9.2. Products
- 12.1.9.3. Company Financials
- 12.1.9.4. SWOT Analysis
- 12.1.10 Stash
- 12.1.10.1. Company Overview
- 12.1.10.2. Products
- 12.1.10.3. Company Financials
- 12.1.10.4. SWOT Analysis
- 12.1.11 Charles Schwab
- 12.1.11.1. Company Overview
- 12.1.11.2. Products
- 12.1.11.3. Company Financials
- 12.1.11.4. SWOT Analysis
- 12.1.12 Fundrise
- 12.1.12.1. Company Overview
- 12.1.12.2. Products
- 12.1.12.3. Company Financials
- 12.1.12.4. SWOT Analysis
- 12.1.13 Invstr
- 12.1.13.1. Company Overview
- 12.1.13.2. Products
- 12.1.13.3. Company Financials
- 12.1.13.4. SWOT Analysis
- 12.1.14 M1 Finance
- 12.1.14.1. Company Overview
- 12.1.14.2. Products
- 12.1.14.3. Company Financials
- 12.1.14.4. SWOT Analysis
- 12.1.15 Ellevest
- 12.1.15.1. Company Overview
- 12.1.15.2. Products
- 12.1.15.3. Company Financials
- 12.1.15.4. SWOT Analysis
- 12.1.16 Suma Wealth
- 12.1.16.1. Company Overview
- 12.1.16.2. Products
- 12.1.16.3. Company Financials
- 12.1.16.4. SWOT Analysis
- 12.1.1 Robinhood
- 12.2. Market Entropy
- 12.2.1 Company's Key Areas Served
- 12.2.2 Recent Developments
- 12.3. Company Market Share Analysis 2025
- 12.3.1 Top 5 Companies Market Share Analysis
- 12.3.2 Top 3 Companies Market Share Analysis
- 12.4. List of Potential Customers
- 13. Research Methodology
List of Figures
- Figure 1: Global Investing Apps Revenue Breakdown (billion, %) by Region 2025 & 2033
- Figure 2: North America Investing Apps Revenue (billion), by Application 2025 & 2033
- Figure 3: North America Investing Apps Revenue Share (%), by Application 2025 & 2033
- Figure 4: North America Investing Apps Revenue (billion), by Types 2025 & 2033
- Figure 5: North America Investing Apps Revenue Share (%), by Types 2025 & 2033
- Figure 6: North America Investing Apps Revenue (billion), by Country 2025 & 2033
- Figure 7: North America Investing Apps Revenue Share (%), by Country 2025 & 2033
- Figure 8: South America Investing Apps Revenue (billion), by Application 2025 & 2033
- Figure 9: South America Investing Apps Revenue Share (%), by Application 2025 & 2033
- Figure 10: South America Investing Apps Revenue (billion), by Types 2025 & 2033
- Figure 11: South America Investing Apps Revenue Share (%), by Types 2025 & 2033
- Figure 12: South America Investing Apps Revenue (billion), by Country 2025 & 2033
- Figure 13: South America Investing Apps Revenue Share (%), by Country 2025 & 2033
- Figure 14: Europe Investing Apps Revenue (billion), by Application 2025 & 2033
- Figure 15: Europe Investing Apps Revenue Share (%), by Application 2025 & 2033
- Figure 16: Europe Investing Apps Revenue (billion), by Types 2025 & 2033
- Figure 17: Europe Investing Apps Revenue Share (%), by Types 2025 & 2033
- Figure 18: Europe Investing Apps Revenue (billion), by Country 2025 & 2033
- Figure 19: Europe Investing Apps Revenue Share (%), by Country 2025 & 2033
- Figure 20: Middle East & Africa Investing Apps Revenue (billion), by Application 2025 & 2033
- Figure 21: Middle East & Africa Investing Apps Revenue Share (%), by Application 2025 & 2033
- Figure 22: Middle East & Africa Investing Apps Revenue (billion), by Types 2025 & 2033
- Figure 23: Middle East & Africa Investing Apps Revenue Share (%), by Types 2025 & 2033
- Figure 24: Middle East & Africa Investing Apps Revenue (billion), by Country 2025 & 2033
- Figure 25: Middle East & Africa Investing Apps Revenue Share (%), by Country 2025 & 2033
- Figure 26: Asia Pacific Investing Apps Revenue (billion), by Application 2025 & 2033
- Figure 27: Asia Pacific Investing Apps Revenue Share (%), by Application 2025 & 2033
- Figure 28: Asia Pacific Investing Apps Revenue (billion), by Types 2025 & 2033
- Figure 29: Asia Pacific Investing Apps Revenue Share (%), by Types 2025 & 2033
- Figure 30: Asia Pacific Investing Apps Revenue (billion), by Country 2025 & 2033
- Figure 31: Asia Pacific Investing Apps Revenue Share (%), by Country 2025 & 2033
List of Tables
- Table 1: Global Investing Apps Revenue billion Forecast, by Application 2020 & 2033
- Table 2: Global Investing Apps Revenue billion Forecast, by Types 2020 & 2033
- Table 3: Global Investing Apps Revenue billion Forecast, by Region 2020 & 2033
- Table 4: Global Investing Apps Revenue billion Forecast, by Application 2020 & 2033
- Table 5: Global Investing Apps Revenue billion Forecast, by Types 2020 & 2033
- Table 6: Global Investing Apps Revenue billion Forecast, by Country 2020 & 2033
- Table 7: United States Investing Apps Revenue (billion) Forecast, by Application 2020 & 2033
- Table 8: Canada Investing Apps Revenue (billion) Forecast, by Application 2020 & 2033
- Table 9: Mexico Investing Apps Revenue (billion) Forecast, by Application 2020 & 2033
- Table 10: Global Investing Apps Revenue billion Forecast, by Application 2020 & 2033
- Table 11: Global Investing Apps Revenue billion Forecast, by Types 2020 & 2033
- Table 12: Global Investing Apps Revenue billion Forecast, by Country 2020 & 2033
- Table 13: Brazil Investing Apps Revenue (billion) Forecast, by Application 2020 & 2033
- Table 14: Argentina Investing Apps Revenue (billion) Forecast, by Application 2020 & 2033
- Table 15: Rest of South America Investing Apps Revenue (billion) Forecast, by Application 2020 & 2033
- Table 16: Global Investing Apps Revenue billion Forecast, by Application 2020 & 2033
- Table 17: Global Investing Apps Revenue billion Forecast, by Types 2020 & 2033
- Table 18: Global Investing Apps Revenue billion Forecast, by Country 2020 & 2033
- Table 19: United Kingdom Investing Apps Revenue (billion) Forecast, by Application 2020 & 2033
- Table 20: Germany Investing Apps Revenue (billion) Forecast, by Application 2020 & 2033
- Table 21: France Investing Apps Revenue (billion) Forecast, by Application 2020 & 2033
- Table 22: Italy Investing Apps Revenue (billion) Forecast, by Application 2020 & 2033
- Table 23: Spain Investing Apps Revenue (billion) Forecast, by Application 2020 & 2033
- Table 24: Russia Investing Apps Revenue (billion) Forecast, by Application 2020 & 2033
- Table 25: Benelux Investing Apps Revenue (billion) Forecast, by Application 2020 & 2033
- Table 26: Nordics Investing Apps Revenue (billion) Forecast, by Application 2020 & 2033
- Table 27: Rest of Europe Investing Apps Revenue (billion) Forecast, by Application 2020 & 2033
- Table 28: Global Investing Apps Revenue billion Forecast, by Application 2020 & 2033
- Table 29: Global Investing Apps Revenue billion Forecast, by Types 2020 & 2033
- Table 30: Global Investing Apps Revenue billion Forecast, by Country 2020 & 2033
- Table 31: Turkey Investing Apps Revenue (billion) Forecast, by Application 2020 & 2033
- Table 32: Israel Investing Apps Revenue (billion) Forecast, by Application 2020 & 2033
- Table 33: GCC Investing Apps Revenue (billion) Forecast, by Application 2020 & 2033
- Table 34: North Africa Investing Apps Revenue (billion) Forecast, by Application 2020 & 2033
- Table 35: South Africa Investing Apps Revenue (billion) Forecast, by Application 2020 & 2033
- Table 36: Rest of Middle East & Africa Investing Apps Revenue (billion) Forecast, by Application 2020 & 2033
- Table 37: Global Investing Apps Revenue billion Forecast, by Application 2020 & 2033
- Table 38: Global Investing Apps Revenue billion Forecast, by Types 2020 & 2033
- Table 39: Global Investing Apps Revenue billion Forecast, by Country 2020 & 2033
- Table 40: China Investing Apps Revenue (billion) Forecast, by Application 2020 & 2033
- Table 41: India Investing Apps Revenue (billion) Forecast, by Application 2020 & 2033
- Table 42: Japan Investing Apps Revenue (billion) Forecast, by Application 2020 & 2033
- Table 43: South Korea Investing Apps Revenue (billion) Forecast, by Application 2020 & 2033
- Table 44: ASEAN Investing Apps Revenue (billion) Forecast, by Application 2020 & 2033
- Table 45: Oceania Investing Apps Revenue (billion) Forecast, by Application 2020 & 2033
- Table 46: Rest of Asia Pacific Investing Apps Revenue (billion) Forecast, by Application 2020 & 2033
Frequently Asked Questions
1. What is the projected Compound Annual Growth Rate (CAGR) of the Investing Apps?
The projected CAGR is approximately 19.3%.
2. Which companies are prominent players in the Investing Apps?
Key companies in the market include Robinhood, Acorns, SoFi, Ally, TD Ameritrade, Public Investing, Stockpile, Betterment, Cash App Investing, Stash, Charles Schwab, Fundrise, Invstr, M1 Finance, Ellevest, Suma Wealth.
3. What are the main segments of the Investing Apps?
The market segments include Application, Types.
4. Can you provide details about the market size?
The market size is estimated to be USD 0.93 billion as of 2022.
5. What are some drivers contributing to market growth?
N/A
6. What are the notable trends driving market growth?
N/A
7. Are there any restraints impacting market growth?
N/A
8. Can you provide examples of recent developments in the market?
N/A
9. What pricing options are available for accessing the report?
Pricing options include single-user, multi-user, and enterprise licenses priced at USD 2900.00, USD 4350.00, and USD 5800.00 respectively.
10. Is the market size provided in terms of value or volume?
The market size is provided in terms of value, measured in billion.
11. Are there any specific market keywords associated with the report?
Yes, the market keyword associated with the report is "Investing Apps," which aids in identifying and referencing the specific market segment covered.
12. How do I determine which pricing option suits my needs best?
The pricing options vary based on user requirements and access needs. Individual users may opt for single-user licenses, while businesses requiring broader access may choose multi-user or enterprise licenses for cost-effective access to the report.
13. Are there any additional resources or data provided in the Investing Apps report?
While the report offers comprehensive insights, it's advisable to review the specific contents or supplementary materials provided to ascertain if additional resources or data are available.
14. How can I stay updated on further developments or reports in the Investing Apps?
To stay informed about further developments, trends, and reports in the Investing Apps, consider subscribing to industry newsletters, following relevant companies and organizations, or regularly checking reputable industry news sources and publications.
Methodology
Step 1 - Identification of Relevant Samples Size from Population Database


Step 2 - Approaches for Defining Global Market Size (Value, Volume* & Price*)

Note*: In applicable scenarios
Step 3 - Data Sources
Primary Research
- Web Analytics
- Survey Reports
- Research Institute
- Latest Research Reports
- Opinion Leaders
Secondary Research
- Annual Reports
- White Paper
- Latest Press Release
- Industry Association
- Paid Database
- Investor Presentations

Step 4 - Data Triangulation
Involves using different sources of information in order to increase the validity of a study
These sources are likely to be stakeholders in a program - participants, other researchers, program staff, other community members, and so on.
Then we put all data in single framework & apply various statistical tools to find out the dynamic on the market.
During the analysis stage, feedback from the stakeholder groups would be compared to determine areas of agreement as well as areas of divergence