

Key Insights
The global Lipid Nutrition market is poised for robust expansion, projected to reach an estimated $15.4 billion in 2025, with a compelling Compound Annual Growth Rate (CAGR) of 6.33% expected through 2033. This significant growth is primarily fueled by increasing consumer awareness regarding the health benefits of essential fatty acids and a rising demand for lipid-based nutritional products across various applications. The dietary supplements segment, in particular, is a major contributor, driven by proactive health management and the growing prevalence of lifestyle-related diseases. Furthermore, the infant formula sector benefits from a continued focus on early childhood nutrition, while the pharmaceuticals industry leverages lipids for drug delivery systems and therapeutic applications. The food fortification segment is also expanding as manufacturers seek to enhance the nutritional profile of everyday food products.

Lipid Nutrition Market Size (In Billion)
Geographically, Asia Pacific is anticipated to emerge as a key growth engine, propelled by a burgeoning middle class, increasing disposable incomes, and a heightened focus on health and wellness in countries like China and India. North America and Europe will continue to represent substantial markets, characterized by mature consumer bases and a strong preference for premium, science-backed nutritional solutions. While the market is driven by these positive trends, potential restraints include fluctuating raw material prices and stringent regulatory frameworks in certain regions. However, ongoing innovation in product formulation, such as the development of specialized lipid blends and convenient delivery formats like capsules and soft gels, is expected to mitigate these challenges and sustain the market's upward trajectory.

Lipid Nutrition Company Market Share
Lipid Nutrition Market Report: Comprehensive Analysis & Future Outlook (2019–2033)
This in-depth report provides a comprehensive analysis of the global Lipid Nutrition market, offering crucial insights into market dynamics, growth trends, competitive landscape, and future opportunities. Covering a study period from 2019 to 2033, with a base year of 2025, this report is an essential resource for industry professionals seeking to understand and navigate the evolving lipid nutrition sector. The market is segmented by application and type, providing granular data for strategic decision-making.
Lipid Nutrition Market Dynamics & Structure
The global Lipid Nutrition market exhibits a moderately concentrated structure, characterized by the presence of both large multinational corporations and specialized ingredient manufacturers. Technological innovation is a key driver, with ongoing research into novel lipid sources, enhanced bioavailability, and targeted delivery systems. Regulatory frameworks, particularly concerning food safety and health claims, play a significant role in shaping product development and market entry. Competitive product substitutes, such as other functional food ingredients and synthetic alternatives, also influence market dynamics, although naturally derived lipids often hold a premium. End-user demographics, driven by growing health consciousness and an aging global population, are increasingly demanding functional ingredients. Mergers and acquisitions (M&A) trends indicate a consolidation in the market, with larger players acquiring smaller, innovative companies to expand their portfolios and market reach.
- Market Concentration: Estimated to be moderately concentrated, with the top 5-7 players holding approximately 55-65% of the market share in 2025.
- Technological Innovation Drivers: Advancements in extraction techniques, microencapsulation for improved stability and delivery, and novel omega-3 and omega-6 fatty acid sources.
- Regulatory Frameworks: Stringent regulations for infant formula and pharmaceutical applications, with evolving guidelines for health claims in dietary supplements.
- Competitive Product Substitutes: Plant-based proteins, prebiotics, and probiotics, offering alternative health benefits.
- End-User Demographics: Growing demand from aging populations for joint health, cognitive function, and cardiovascular support, as well as increased awareness among younger demographics for sports nutrition and preventive health.
- M&A Trends: Significant M&A activity focused on acquiring specialized lipid ingredient manufacturers and companies with strong R&D capabilities. Anticipated M&A deal volume for 2025 is estimated at 5-7 significant transactions.
Lipid Nutrition Growth Trends & Insights
The global Lipid Nutrition market is poised for robust growth, driven by a confluence of factors that are reshaping consumer behavior and industry practices. The market size is projected to expand from approximately $35.2 billion in 2019 to an estimated $78.5 billion by 2033, exhibiting a compound annual growth rate (CAGR) of approximately 7.2% during the forecast period (2025–2033). Adoption rates for lipid-based supplements and fortified foods are steadily increasing across developed and developing economies, fueled by greater consumer awareness regarding the health benefits of essential fatty acids like omega-3, omega-6, and omega-9. Technological disruptions are playing a pivotal role, with advancements in sustainable sourcing, such as algae and microbial oil production, addressing environmental concerns and offering new avenues for product innovation. Furthermore, the development of specialized lipid formulations with improved bioavailability and targeted functionalities is enhancing product efficacy and consumer appeal. Consumer behavior shifts are particularly evident in the rising demand for personalized nutrition solutions, where lipids are recognized for their critical roles in brain health, cardiovascular well-being, and immune system support. The growing popularity of plant-based diets has also propelled the demand for plant-derived omega-3 sources, further diversifying the market. The pharmaceutical segment is witnessing increased adoption of specialized lipids for drug delivery systems and therapeutic applications. Infant formula manufacturers are prioritizing the inclusion of essential fatty acids for optimal cognitive and visual development. Food fortification is another key area, with manufacturers actively incorporating lipids into everyday food products to enhance their nutritional profile and appeal to health-conscious consumers. The animal nutrition segment is also expanding, recognizing the importance of lipids for animal health, growth, and productivity, particularly in aquaculture and livestock farming. The increasing prevalence of chronic diseases globally is a significant underlying driver, as consumers actively seek dietary interventions to manage and prevent these conditions, placing lipid nutrition at the forefront of preventive healthcare strategies.
Dominant Regions, Countries, or Segments in Lipid Nutrition
The Dietary Supplements segment, within the broader Lipid Nutrition market, is currently the dominant force driving global growth, projected to hold a substantial market share of approximately 35-40% in 2025. This dominance is attributed to a confluence of factors, including escalating global health consciousness, the growing prevalence of lifestyle-related diseases, and an aging population actively seeking to manage their well-being through nutritional interventions. The demand for omega-3 fatty acids (EPA and DHA) for cardiovascular health, cognitive function, and anti-inflammatory benefits is particularly strong within this segment.
- Dominant Segment: Dietary Supplements
- Key Drivers:
- Rising consumer awareness of the health benefits of omega-3, omega-6, and omega-9 fatty acids.
- Increasing prevalence of chronic diseases such as cardiovascular disorders and cognitive decline.
- Growth in the aging population seeking to maintain health and vitality.
- Proactive approach to preventive healthcare and wellness.
- Availability of a wide range of lipid-based supplements in various forms (capsules, soft gels, liquids).
- Market Share (Estimated 2025): 35-40% of the global Lipid Nutrition market.
- Growth Potential: High, driven by continuous product innovation and expanding consumer education.
- Key Drivers:
Geographically, North America stands out as the leading region, accounting for an estimated 30-35% of the global Lipid Nutrition market in 2025. This leadership is underpinned by a highly developed healthcare infrastructure, robust consumer purchasing power, and a deeply ingrained culture of health and wellness. The presence of key industry players, extensive research and development activities, and a strong regulatory environment conducive to the introduction of innovative lipid-based products further solidify its dominant position. The United States, in particular, represents a significant market within North America, driven by widespread consumer acceptance of dietary supplements and a strong emphasis on preventive health measures.
- Dominant Region: North America
- Key Drivers:
- High disposable income and consumer spending on health and wellness products.
- Advanced healthcare systems and strong adoption of dietary supplements.
- Well-established regulatory framework for food and supplement industries.
- Presence of leading global lipid nutrition companies and research institutions.
- Strong consumer awareness and demand for omega-3 and other essential fatty acids.
- Market Share (Estimated 2025): 30-35% of the global Lipid Nutrition market.
- Growth Potential: Steady, with continued innovation and expansion of functional food applications.
- Key Drivers:
Within the Type segment, Soft Gels are expected to command the largest market share, estimated at 30-35% in 2025. This dominance is primarily attributed to their superior bioavailability, ease of swallowing, and excellent product stability, making them a preferred choice for both manufacturers and consumers across various applications, particularly dietary supplements and pharmaceuticals.
- Dominant Type: Soft Gels
- Key Drivers:
- High bioavailability and efficient absorption of lipids.
- Convenience and ease of consumption for consumers.
- Excellent product stability and shelf life.
- Versatility in encapsulating various lipid formulations.
- Strong preference in dietary supplement and pharmaceutical applications.
- Market Share (Estimated 2025): 30-35% of the Lipid Nutrition market by type.
- Growth Potential: Significant, driven by ongoing technological advancements in soft gel manufacturing and increasing demand for high-quality supplements.
- Key Drivers:
Lipid Nutrition Product Landscape
The lipid nutrition product landscape is characterized by continuous innovation aimed at enhancing bioavailability, stability, and targeted delivery of essential fatty acids. Products range from highly purified omega-3s derived from fish oil and algal sources to specialized lipids for infant formula and pharmaceutical applications. Emerging innovations include microencapsulated lipids for improved oxidative stability and controlled release, as well as novel plant-based omega-3 sources addressing sustainability concerns. Performance metrics focus on fatty acid profile purity, allergen control, and sensory attributes. Unique selling propositions often revolve around sustainable sourcing, traceability, and specific health benefits supported by clinical research, such as improved cognitive function, cardiovascular support, and anti-inflammatory effects.
Key Drivers, Barriers & Challenges in Lipid Nutrition
Key Drivers:
The lipid nutrition market is propelled by a significant surge in consumer awareness regarding the profound health benefits of essential fatty acids, particularly omega-3s (EPA, DHA) and omega-6s. This heightened awareness is directly linked to the increasing global prevalence of chronic diseases, including cardiovascular ailments, neurological disorders, and inflammatory conditions, prompting consumers to actively seek dietary solutions. Furthermore, the growing aging population worldwide prioritizes maintaining cognitive function, joint health, and overall vitality, making lipid-rich products indispensable. Technological advancements in extraction, purification, and formulation technologies, such as microencapsulation for enhanced stability and bioavailability, are also crucial growth catalysts. The expansion of the animal nutrition sector, recognizing the role of lipids in animal health and productivity, further fuels market demand.
Barriers & Challenges:
Despite the robust growth potential, the lipid nutrition market faces several challenges. Supply chain volatility for certain raw materials, such as fish oil, can lead to price fluctuations and availability issues. Stringent and evolving regulatory landscapes across different regions, especially concerning health claims and product standardization, pose significant hurdles for market entry and expansion. The presence of competitive product substitutes, including other functional ingredients and synthetic alternatives, necessitates continuous innovation and robust scientific validation to maintain market share. Furthermore, consumer perception regarding the taste and odor of certain lipid-based products, particularly fish oil, can act as a restraint, requiring ongoing efforts in product development and sensory improvement.
Emerging Opportunities in Lipid Nutrition
Emerging opportunities in the lipid nutrition sector lie in the burgeoning demand for sustainable and traceable lipid sources, with algae- and microbial-derived oils gaining significant traction due to their environmental benefits and scalability. The expanding market for plant-based alternatives also presents a substantial avenue for innovation in plant-derived omega-3 and other beneficial lipids. Personalized nutrition, driven by genetic testing and individual health goals, offers a niche for customized lipid formulations tailored to specific consumer needs, such as cognitive enhancement or athletic performance. Moreover, the increasing focus on mental well-being and stress management is creating opportunities for specialized lipid blends that support brain health and mood regulation. The application of lipids in novel delivery systems for pharmaceuticals and nutraceuticals, such as liposomes and nanoparticles, is another area ripe for exploration and commercialization.
Growth Accelerators in the Lipid Nutrition Industry
Technological breakthroughs in enzyme-catalyzed lipid synthesis and genetic modification of oilseed crops are poised to significantly accelerate growth by offering more efficient, sustainable, and cost-effective production of valuable fatty acids. Strategic partnerships between ingredient suppliers, formulators, and end-product manufacturers are crucial for streamlining product development and market penetration, enabling faster innovation cycles and wider market reach. Furthermore, aggressive market expansion strategies targeting emerging economies, coupled with targeted consumer education campaigns highlighting the long-term health benefits of consistent lipid nutrition, will drive widespread adoption. The increasing investment in clinical research to substantiate health claims and develop novel therapeutic applications for lipids will further bolster market confidence and demand.
Key Players Shaping the Lipid Nutrition Market
- Archer Daniels Midland
- BASF SE
- Croda International Plc
- Koninklijke DSM N.V.
- Nordic Naturals
- NOW® Foods
- Solvay S.A.
- Croda International Plc
- Aker BioMarine Antarctic AS
- GC Rieber Vivo
Notable Milestones in Lipid Nutrition Sector
- 2019: Increased regulatory scrutiny on omega-3 claims in several key markets, leading to stricter guidelines for manufacturers.
- 2020: Surge in demand for immune-supporting supplements, boosting sales of omega-3 and vitamin D-fortified products.
- 2021: Growing focus on sustainable sourcing, with increased investment in algae-based omega-3 production technologies.
- 2022: Major advancements in microencapsulation techniques, improving the stability and palatability of omega-3 oils.
- 2023: Expansion of lipid applications in functional foods beyond traditional supplements, including beverages and baked goods.
- 2024: Intensified research into the role of specialized lipids in brain health and cognitive function, driving new product development.
In-Depth Lipid Nutrition Market Outlook
The future outlook for the Lipid Nutrition market is exceptionally promising, driven by an unwavering global commitment to health and wellness. Growth accelerators, including sustainable sourcing innovations and advancements in personalized nutrition, will continue to propel the market forward. Strategic collaborations and targeted expansion into underserved regions will unlock new revenue streams. The increasing body of scientific evidence supporting the multifaceted health benefits of various lipids, from cardiovascular protection to cognitive enhancement, will solidify their importance in diets worldwide. The market is projected to witness sustained expansion, driven by evolving consumer preferences for natural, functional, and scientifically validated nutritional solutions, making lipid nutrition an indispensable component of a healthy lifestyle.
Lipid Nutrition Segmentation
-
1. Application
- 1.1. Dietary Supplements
- 1.2. Infant Formula
- 1.3. Pharmaceuticals
- 1.4. Food Fortification
- 1.5. Animal Nutrition
-
2. Type
- 2.1. Powder
- 2.2. Liquid
- 2.3. Capsules
- 2.4. Soft Gels
Lipid Nutrition Segmentation By Geography
-
1. North America
- 1.1. United States
- 1.2. Canada
- 1.3. Mexico
-
2. South America
- 2.1. Brazil
- 2.2. Argentina
- 2.3. Rest of South America
-
3. Europe
- 3.1. United Kingdom
- 3.2. Germany
- 3.3. France
- 3.4. Italy
- 3.5. Spain
- 3.6. Russia
- 3.7. Benelux
- 3.8. Nordics
- 3.9. Rest of Europe
-
4. Middle East & Africa
- 4.1. Turkey
- 4.2. Israel
- 4.3. GCC
- 4.4. North Africa
- 4.5. South Africa
- 4.6. Rest of Middle East & Africa
-
5. Asia Pacific
- 5.1. China
- 5.2. India
- 5.3. Japan
- 5.4. South Korea
- 5.5. ASEAN
- 5.6. Oceania
- 5.7. Rest of Asia Pacific
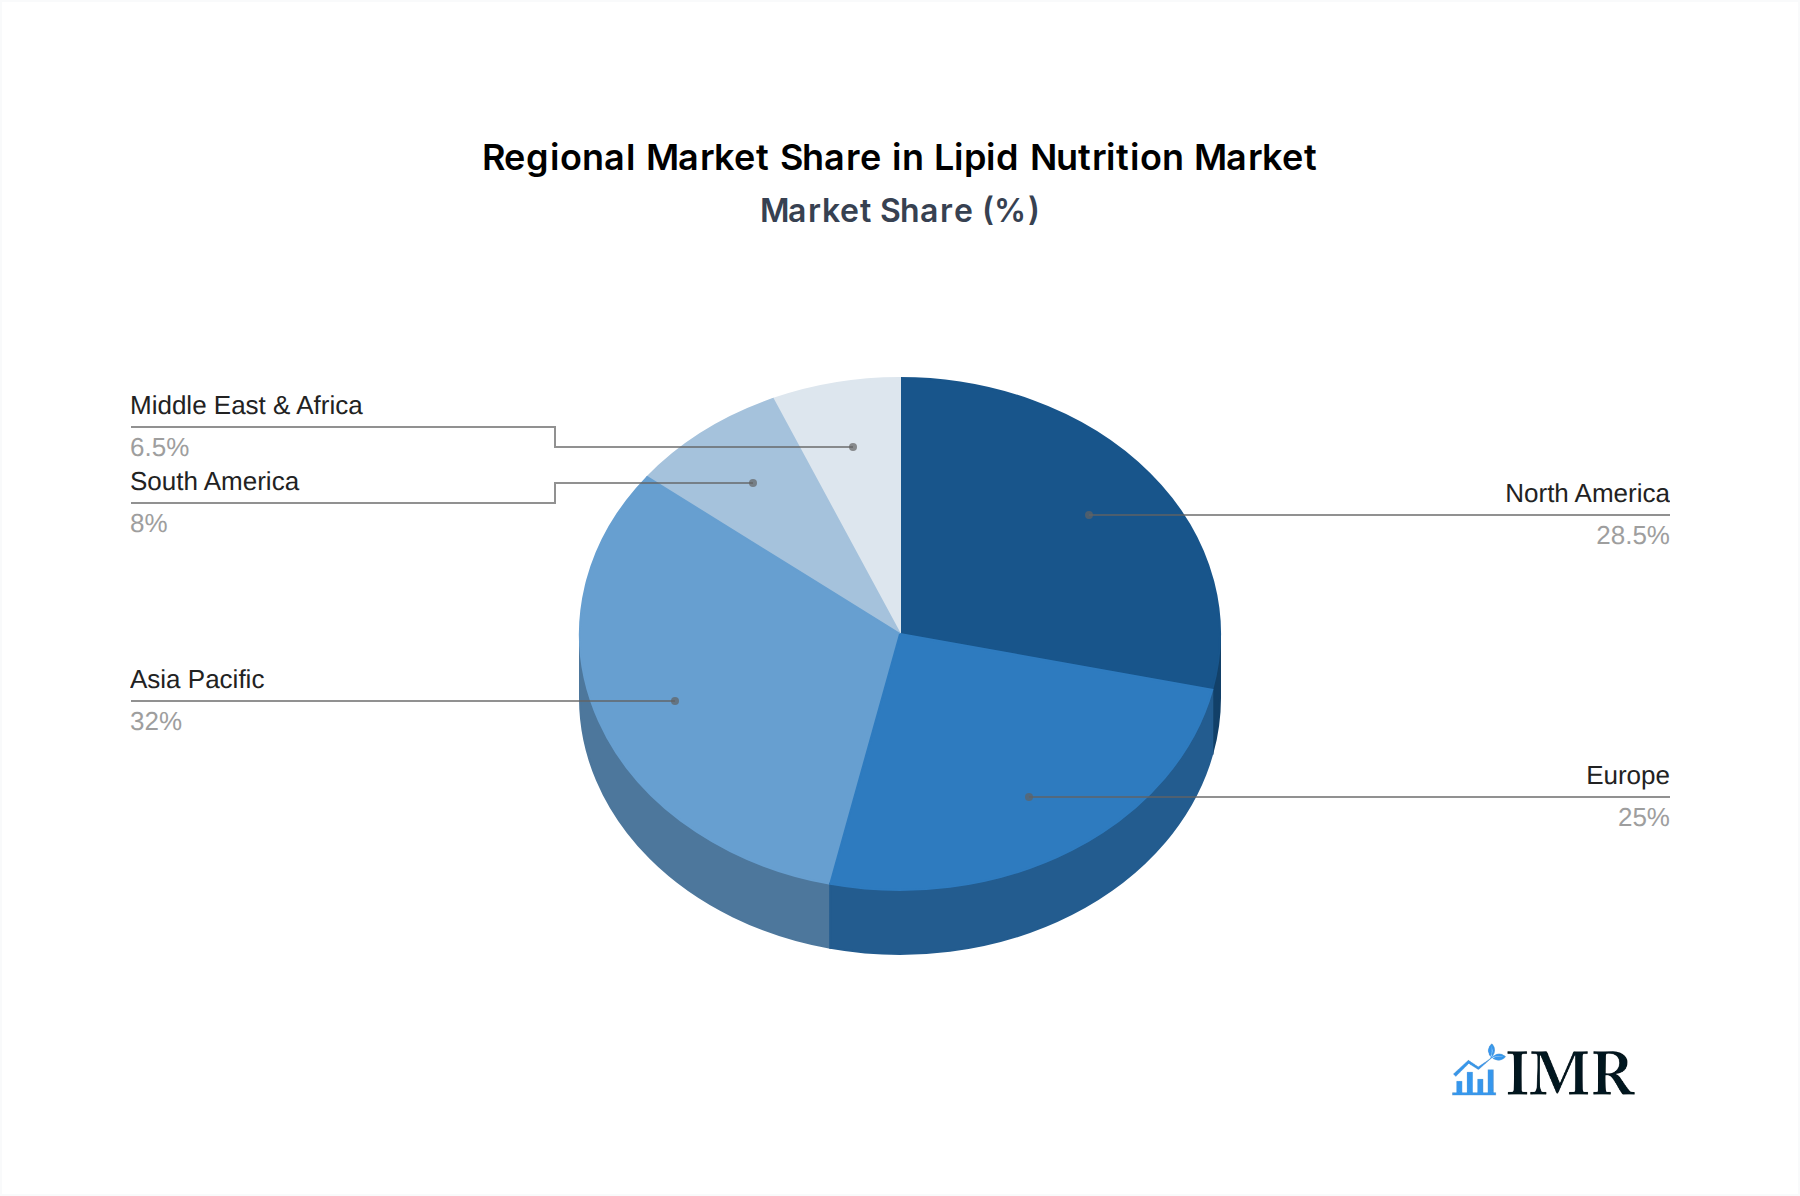
Lipid Nutrition Regional Market Share
Geographic Coverage of Lipid Nutrition
Lipid Nutrition REPORT HIGHLIGHTS
| Aspects | Details |
|---|---|
| Study Period | 2020-2034 |
| Base Year | 2025 |
| Estimated Year | 2026 |
| Forecast Period | 2026-2034 |
| Historical Period | 2020-2025 |
| Growth Rate | CAGR of 6.33% from 2020-2034 |
| Segmentation |
|
Table of Contents
- 1. Introduction
- 1.1. Research Scope
- 1.2. Market Segmentation
- 1.3. Research Objective
- 1.4. Definitions and Assumptions
- 2. Executive Summary
- 2.1. Market Snapshot
- 3. Market Dynamics
- 3.1. Market Drivers
- 3.2. Market Restrains
- 3.3. Market Trends
- 3.4. Market Opportunities
- 4. Market Factor Analysis
- 4.1. Porters Five Forces
- 4.1.1. Bargaining Power of Suppliers
- 4.1.2. Bargaining Power of Buyers
- 4.1.3. Threat of New Entrants
- 4.1.4. Threat of Substitutes
- 4.1.5. Competitive Rivalry
- 4.2. PESTEL analysis
- 4.3. BCG Analysis
- 4.3.1. Stars (High Growth, High Market Share)
- 4.3.2. Cash Cows (Low Growth, High Market Share)
- 4.3.3. Question Mark (High Growth, Low Market Share)
- 4.3.4. Dogs (Low Growth, Low Market Share)
- 4.4. Ansoff Matrix Analysis
- 4.5. Supply Chain Analysis
- 4.6. Regulatory Landscape
- 4.7. Current Market Potential and Opportunity Assessment (TAM–SAM–SOM Framework)
- 4.8. IMR Analyst Note
- 4.1. Porters Five Forces
- 5. Market Analysis, Insights and Forecast 2021-2033
- 5.1. Market Analysis, Insights and Forecast - by Application
- 5.1.1. Dietary Supplements
- 5.1.2. Infant Formula
- 5.1.3. Pharmaceuticals
- 5.1.4. Food Fortification
- 5.1.5. Animal Nutrition
- 5.2. Market Analysis, Insights and Forecast - by Type
- 5.2.1. Powder
- 5.2.2. Liquid
- 5.2.3. Capsules
- 5.2.4. Soft Gels
- 5.3. Market Analysis, Insights and Forecast - by Region
- 5.3.1. North America
- 5.3.2. South America
- 5.3.3. Europe
- 5.3.4. Middle East & Africa
- 5.3.5. Asia Pacific
- 5.1. Market Analysis, Insights and Forecast - by Application
- 6. Global Lipid Nutrition Analysis, Insights and Forecast, 2021-2033
- 6.1. Market Analysis, Insights and Forecast - by Application
- 6.1.1. Dietary Supplements
- 6.1.2. Infant Formula
- 6.1.3. Pharmaceuticals
- 6.1.4. Food Fortification
- 6.1.5. Animal Nutrition
- 6.2. Market Analysis, Insights and Forecast - by Type
- 6.2.1. Powder
- 6.2.2. Liquid
- 6.2.3. Capsules
- 6.2.4. Soft Gels
- 6.1. Market Analysis, Insights and Forecast - by Application
- 7. North America Lipid Nutrition Analysis, Insights and Forecast, 2020-2032
- 7.1. Market Analysis, Insights and Forecast - by Application
- 7.1.1. Dietary Supplements
- 7.1.2. Infant Formula
- 7.1.3. Pharmaceuticals
- 7.1.4. Food Fortification
- 7.1.5. Animal Nutrition
- 7.2. Market Analysis, Insights and Forecast - by Type
- 7.2.1. Powder
- 7.2.2. Liquid
- 7.2.3. Capsules
- 7.2.4. Soft Gels
- 7.1. Market Analysis, Insights and Forecast - by Application
- 8. South America Lipid Nutrition Analysis, Insights and Forecast, 2020-2032
- 8.1. Market Analysis, Insights and Forecast - by Application
- 8.1.1. Dietary Supplements
- 8.1.2. Infant Formula
- 8.1.3. Pharmaceuticals
- 8.1.4. Food Fortification
- 8.1.5. Animal Nutrition
- 8.2. Market Analysis, Insights and Forecast - by Type
- 8.2.1. Powder
- 8.2.2. Liquid
- 8.2.3. Capsules
- 8.2.4. Soft Gels
- 8.1. Market Analysis, Insights and Forecast - by Application
- 9. Europe Lipid Nutrition Analysis, Insights and Forecast, 2020-2032
- 9.1. Market Analysis, Insights and Forecast - by Application
- 9.1.1. Dietary Supplements
- 9.1.2. Infant Formula
- 9.1.3. Pharmaceuticals
- 9.1.4. Food Fortification
- 9.1.5. Animal Nutrition
- 9.2. Market Analysis, Insights and Forecast - by Type
- 9.2.1. Powder
- 9.2.2. Liquid
- 9.2.3. Capsules
- 9.2.4. Soft Gels
- 9.1. Market Analysis, Insights and Forecast - by Application
- 10. Middle East & Africa Lipid Nutrition Analysis, Insights and Forecast, 2020-2032
- 10.1. Market Analysis, Insights and Forecast - by Application
- 10.1.1. Dietary Supplements
- 10.1.2. Infant Formula
- 10.1.3. Pharmaceuticals
- 10.1.4. Food Fortification
- 10.1.5. Animal Nutrition
- 10.2. Market Analysis, Insights and Forecast - by Type
- 10.2.1. Powder
- 10.2.2. Liquid
- 10.2.3. Capsules
- 10.2.4. Soft Gels
- 10.1. Market Analysis, Insights and Forecast - by Application
- 11. Asia Pacific Lipid Nutrition Analysis, Insights and Forecast, 2020-2032
- 11.1. Market Analysis, Insights and Forecast - by Application
- 11.1.1. Dietary Supplements
- 11.1.2. Infant Formula
- 11.1.3. Pharmaceuticals
- 11.1.4. Food Fortification
- 11.1.5. Animal Nutrition
- 11.2. Market Analysis, Insights and Forecast - by Type
- 11.2.1. Powder
- 11.2.2. Liquid
- 11.2.3. Capsules
- 11.2.4. Soft Gels
- 11.1. Market Analysis, Insights and Forecast - by Application
- 12. Competitive Analysis
- 12.1. Company Profiles
- 12.1.1 Archer Daniels Midland
- 12.1.1.1. Company Overview
- 12.1.1.2. Products
- 12.1.1.3. Company Financials
- 12.1.1.4. SWOT Analysis
- 12.1.2 Basf
- 12.1.2.1. Company Overview
- 12.1.2.2. Products
- 12.1.2.3. Company Financials
- 12.1.2.4. SWOT Analysis
- 12.1.3 Croda International
- 12.1.3.1. Company Overview
- 12.1.3.2. Products
- 12.1.3.3. Company Financials
- 12.1.3.4. SWOT Analysis
- 12.1.4 Koninklijke Dsm
- 12.1.4.1. Company Overview
- 12.1.4.2. Products
- 12.1.4.3. Company Financials
- 12.1.4.4. SWOT Analysis
- 12.1.5 Nordic Naturals
- 12.1.5.1. Company Overview
- 12.1.5.2. Products
- 12.1.5.3. Company Financials
- 12.1.5.4. SWOT Analysis
- 12.1.6 Now Foods
- 12.1.6.1. Company Overview
- 12.1.6.2. Products
- 12.1.6.3. Company Financials
- 12.1.6.4. SWOT Analysis
- 12.1.1 Archer Daniels Midland
- 12.2. Market Entropy
- 12.2.1 Company's Key Areas Served
- 12.2.2 Recent Developments
- 12.3. Company Market Share Analysis 2025
- 12.3.1 Top 5 Companies Market Share Analysis
- 12.3.2 Top 3 Companies Market Share Analysis
- 12.4. List of Potential Customers
- 13. Research Methodology
List of Figures
- Figure 1: Global Lipid Nutrition Revenue Breakdown (billion, %) by Region 2025 & 2033
- Figure 2: Global Lipid Nutrition Volume Breakdown (K, %) by Region 2025 & 2033
- Figure 3: North America Lipid Nutrition Revenue (billion), by Application 2025 & 2033
- Figure 4: North America Lipid Nutrition Volume (K), by Application 2025 & 2033
- Figure 5: North America Lipid Nutrition Revenue Share (%), by Application 2025 & 2033
- Figure 6: North America Lipid Nutrition Volume Share (%), by Application 2025 & 2033
- Figure 7: North America Lipid Nutrition Revenue (billion), by Type 2025 & 2033
- Figure 8: North America Lipid Nutrition Volume (K), by Type 2025 & 2033
- Figure 9: North America Lipid Nutrition Revenue Share (%), by Type 2025 & 2033
- Figure 10: North America Lipid Nutrition Volume Share (%), by Type 2025 & 2033
- Figure 11: North America Lipid Nutrition Revenue (billion), by Country 2025 & 2033
- Figure 12: North America Lipid Nutrition Volume (K), by Country 2025 & 2033
- Figure 13: North America Lipid Nutrition Revenue Share (%), by Country 2025 & 2033
- Figure 14: North America Lipid Nutrition Volume Share (%), by Country 2025 & 2033
- Figure 15: South America Lipid Nutrition Revenue (billion), by Application 2025 & 2033
- Figure 16: South America Lipid Nutrition Volume (K), by Application 2025 & 2033
- Figure 17: South America Lipid Nutrition Revenue Share (%), by Application 2025 & 2033
- Figure 18: South America Lipid Nutrition Volume Share (%), by Application 2025 & 2033
- Figure 19: South America Lipid Nutrition Revenue (billion), by Type 2025 & 2033
- Figure 20: South America Lipid Nutrition Volume (K), by Type 2025 & 2033
- Figure 21: South America Lipid Nutrition Revenue Share (%), by Type 2025 & 2033
- Figure 22: South America Lipid Nutrition Volume Share (%), by Type 2025 & 2033
- Figure 23: South America Lipid Nutrition Revenue (billion), by Country 2025 & 2033
- Figure 24: South America Lipid Nutrition Volume (K), by Country 2025 & 2033
- Figure 25: South America Lipid Nutrition Revenue Share (%), by Country 2025 & 2033
- Figure 26: South America Lipid Nutrition Volume Share (%), by Country 2025 & 2033
- Figure 27: Europe Lipid Nutrition Revenue (billion), by Application 2025 & 2033
- Figure 28: Europe Lipid Nutrition Volume (K), by Application 2025 & 2033
- Figure 29: Europe Lipid Nutrition Revenue Share (%), by Application 2025 & 2033
- Figure 30: Europe Lipid Nutrition Volume Share (%), by Application 2025 & 2033
- Figure 31: Europe Lipid Nutrition Revenue (billion), by Type 2025 & 2033
- Figure 32: Europe Lipid Nutrition Volume (K), by Type 2025 & 2033
- Figure 33: Europe Lipid Nutrition Revenue Share (%), by Type 2025 & 2033
- Figure 34: Europe Lipid Nutrition Volume Share (%), by Type 2025 & 2033
- Figure 35: Europe Lipid Nutrition Revenue (billion), by Country 2025 & 2033
- Figure 36: Europe Lipid Nutrition Volume (K), by Country 2025 & 2033
- Figure 37: Europe Lipid Nutrition Revenue Share (%), by Country 2025 & 2033
- Figure 38: Europe Lipid Nutrition Volume Share (%), by Country 2025 & 2033
- Figure 39: Middle East & Africa Lipid Nutrition Revenue (billion), by Application 2025 & 2033
- Figure 40: Middle East & Africa Lipid Nutrition Volume (K), by Application 2025 & 2033
- Figure 41: Middle East & Africa Lipid Nutrition Revenue Share (%), by Application 2025 & 2033
- Figure 42: Middle East & Africa Lipid Nutrition Volume Share (%), by Application 2025 & 2033
- Figure 43: Middle East & Africa Lipid Nutrition Revenue (billion), by Type 2025 & 2033
- Figure 44: Middle East & Africa Lipid Nutrition Volume (K), by Type 2025 & 2033
- Figure 45: Middle East & Africa Lipid Nutrition Revenue Share (%), by Type 2025 & 2033
- Figure 46: Middle East & Africa Lipid Nutrition Volume Share (%), by Type 2025 & 2033
- Figure 47: Middle East & Africa Lipid Nutrition Revenue (billion), by Country 2025 & 2033
- Figure 48: Middle East & Africa Lipid Nutrition Volume (K), by Country 2025 & 2033
- Figure 49: Middle East & Africa Lipid Nutrition Revenue Share (%), by Country 2025 & 2033
- Figure 50: Middle East & Africa Lipid Nutrition Volume Share (%), by Country 2025 & 2033
- Figure 51: Asia Pacific Lipid Nutrition Revenue (billion), by Application 2025 & 2033
- Figure 52: Asia Pacific Lipid Nutrition Volume (K), by Application 2025 & 2033
- Figure 53: Asia Pacific Lipid Nutrition Revenue Share (%), by Application 2025 & 2033
- Figure 54: Asia Pacific Lipid Nutrition Volume Share (%), by Application 2025 & 2033
- Figure 55: Asia Pacific Lipid Nutrition Revenue (billion), by Type 2025 & 2033
- Figure 56: Asia Pacific Lipid Nutrition Volume (K), by Type 2025 & 2033
- Figure 57: Asia Pacific Lipid Nutrition Revenue Share (%), by Type 2025 & 2033
- Figure 58: Asia Pacific Lipid Nutrition Volume Share (%), by Type 2025 & 2033
- Figure 59: Asia Pacific Lipid Nutrition Revenue (billion), by Country 2025 & 2033
- Figure 60: Asia Pacific Lipid Nutrition Volume (K), by Country 2025 & 2033
- Figure 61: Asia Pacific Lipid Nutrition Revenue Share (%), by Country 2025 & 2033
- Figure 62: Asia Pacific Lipid Nutrition Volume Share (%), by Country 2025 & 2033
List of Tables
- Table 1: Global Lipid Nutrition Revenue billion Forecast, by Application 2020 & 2033
- Table 2: Global Lipid Nutrition Volume K Forecast, by Application 2020 & 2033
- Table 3: Global Lipid Nutrition Revenue billion Forecast, by Type 2020 & 2033
- Table 4: Global Lipid Nutrition Volume K Forecast, by Type 2020 & 2033
- Table 5: Global Lipid Nutrition Revenue billion Forecast, by Region 2020 & 2033
- Table 6: Global Lipid Nutrition Volume K Forecast, by Region 2020 & 2033
- Table 7: Global Lipid Nutrition Revenue billion Forecast, by Application 2020 & 2033
- Table 8: Global Lipid Nutrition Volume K Forecast, by Application 2020 & 2033
- Table 9: Global Lipid Nutrition Revenue billion Forecast, by Type 2020 & 2033
- Table 10: Global Lipid Nutrition Volume K Forecast, by Type 2020 & 2033
- Table 11: Global Lipid Nutrition Revenue billion Forecast, by Country 2020 & 2033
- Table 12: Global Lipid Nutrition Volume K Forecast, by Country 2020 & 2033
- Table 13: United States Lipid Nutrition Revenue (billion) Forecast, by Application 2020 & 2033
- Table 14: United States Lipid Nutrition Volume (K) Forecast, by Application 2020 & 2033
- Table 15: Canada Lipid Nutrition Revenue (billion) Forecast, by Application 2020 & 2033
- Table 16: Canada Lipid Nutrition Volume (K) Forecast, by Application 2020 & 2033
- Table 17: Mexico Lipid Nutrition Revenue (billion) Forecast, by Application 2020 & 2033
- Table 18: Mexico Lipid Nutrition Volume (K) Forecast, by Application 2020 & 2033
- Table 19: Global Lipid Nutrition Revenue billion Forecast, by Application 2020 & 2033
- Table 20: Global Lipid Nutrition Volume K Forecast, by Application 2020 & 2033
- Table 21: Global Lipid Nutrition Revenue billion Forecast, by Type 2020 & 2033
- Table 22: Global Lipid Nutrition Volume K Forecast, by Type 2020 & 2033
- Table 23: Global Lipid Nutrition Revenue billion Forecast, by Country 2020 & 2033
- Table 24: Global Lipid Nutrition Volume K Forecast, by Country 2020 & 2033
- Table 25: Brazil Lipid Nutrition Revenue (billion) Forecast, by Application 2020 & 2033
- Table 26: Brazil Lipid Nutrition Volume (K) Forecast, by Application 2020 & 2033
- Table 27: Argentina Lipid Nutrition Revenue (billion) Forecast, by Application 2020 & 2033
- Table 28: Argentina Lipid Nutrition Volume (K) Forecast, by Application 2020 & 2033
- Table 29: Rest of South America Lipid Nutrition Revenue (billion) Forecast, by Application 2020 & 2033
- Table 30: Rest of South America Lipid Nutrition Volume (K) Forecast, by Application 2020 & 2033
- Table 31: Global Lipid Nutrition Revenue billion Forecast, by Application 2020 & 2033
- Table 32: Global Lipid Nutrition Volume K Forecast, by Application 2020 & 2033
- Table 33: Global Lipid Nutrition Revenue billion Forecast, by Type 2020 & 2033
- Table 34: Global Lipid Nutrition Volume K Forecast, by Type 2020 & 2033
- Table 35: Global Lipid Nutrition Revenue billion Forecast, by Country 2020 & 2033
- Table 36: Global Lipid Nutrition Volume K Forecast, by Country 2020 & 2033
- Table 37: United Kingdom Lipid Nutrition Revenue (billion) Forecast, by Application 2020 & 2033
- Table 38: United Kingdom Lipid Nutrition Volume (K) Forecast, by Application 2020 & 2033
- Table 39: Germany Lipid Nutrition Revenue (billion) Forecast, by Application 2020 & 2033
- Table 40: Germany Lipid Nutrition Volume (K) Forecast, by Application 2020 & 2033
- Table 41: France Lipid Nutrition Revenue (billion) Forecast, by Application 2020 & 2033
- Table 42: France Lipid Nutrition Volume (K) Forecast, by Application 2020 & 2033
- Table 43: Italy Lipid Nutrition Revenue (billion) Forecast, by Application 2020 & 2033
- Table 44: Italy Lipid Nutrition Volume (K) Forecast, by Application 2020 & 2033
- Table 45: Spain Lipid Nutrition Revenue (billion) Forecast, by Application 2020 & 2033
- Table 46: Spain Lipid Nutrition Volume (K) Forecast, by Application 2020 & 2033
- Table 47: Russia Lipid Nutrition Revenue (billion) Forecast, by Application 2020 & 2033
- Table 48: Russia Lipid Nutrition Volume (K) Forecast, by Application 2020 & 2033
- Table 49: Benelux Lipid Nutrition Revenue (billion) Forecast, by Application 2020 & 2033
- Table 50: Benelux Lipid Nutrition Volume (K) Forecast, by Application 2020 & 2033
- Table 51: Nordics Lipid Nutrition Revenue (billion) Forecast, by Application 2020 & 2033
- Table 52: Nordics Lipid Nutrition Volume (K) Forecast, by Application 2020 & 2033
- Table 53: Rest of Europe Lipid Nutrition Revenue (billion) Forecast, by Application 2020 & 2033
- Table 54: Rest of Europe Lipid Nutrition Volume (K) Forecast, by Application 2020 & 2033
- Table 55: Global Lipid Nutrition Revenue billion Forecast, by Application 2020 & 2033
- Table 56: Global Lipid Nutrition Volume K Forecast, by Application 2020 & 2033
- Table 57: Global Lipid Nutrition Revenue billion Forecast, by Type 2020 & 2033
- Table 58: Global Lipid Nutrition Volume K Forecast, by Type 2020 & 2033
- Table 59: Global Lipid Nutrition Revenue billion Forecast, by Country 2020 & 2033
- Table 60: Global Lipid Nutrition Volume K Forecast, by Country 2020 & 2033
- Table 61: Turkey Lipid Nutrition Revenue (billion) Forecast, by Application 2020 & 2033
- Table 62: Turkey Lipid Nutrition Volume (K) Forecast, by Application 2020 & 2033
- Table 63: Israel Lipid Nutrition Revenue (billion) Forecast, by Application 2020 & 2033
- Table 64: Israel Lipid Nutrition Volume (K) Forecast, by Application 2020 & 2033
- Table 65: GCC Lipid Nutrition Revenue (billion) Forecast, by Application 2020 & 2033
- Table 66: GCC Lipid Nutrition Volume (K) Forecast, by Application 2020 & 2033
- Table 67: North Africa Lipid Nutrition Revenue (billion) Forecast, by Application 2020 & 2033
- Table 68: North Africa Lipid Nutrition Volume (K) Forecast, by Application 2020 & 2033
- Table 69: South Africa Lipid Nutrition Revenue (billion) Forecast, by Application 2020 & 2033
- Table 70: South Africa Lipid Nutrition Volume (K) Forecast, by Application 2020 & 2033
- Table 71: Rest of Middle East & Africa Lipid Nutrition Revenue (billion) Forecast, by Application 2020 & 2033
- Table 72: Rest of Middle East & Africa Lipid Nutrition Volume (K) Forecast, by Application 2020 & 2033
- Table 73: Global Lipid Nutrition Revenue billion Forecast, by Application 2020 & 2033
- Table 74: Global Lipid Nutrition Volume K Forecast, by Application 2020 & 2033
- Table 75: Global Lipid Nutrition Revenue billion Forecast, by Type 2020 & 2033
- Table 76: Global Lipid Nutrition Volume K Forecast, by Type 2020 & 2033
- Table 77: Global Lipid Nutrition Revenue billion Forecast, by Country 2020 & 2033
- Table 78: Global Lipid Nutrition Volume K Forecast, by Country 2020 & 2033
- Table 79: China Lipid Nutrition Revenue (billion) Forecast, by Application 2020 & 2033
- Table 80: China Lipid Nutrition Volume (K) Forecast, by Application 2020 & 2033
- Table 81: India Lipid Nutrition Revenue (billion) Forecast, by Application 2020 & 2033
- Table 82: India Lipid Nutrition Volume (K) Forecast, by Application 2020 & 2033
- Table 83: Japan Lipid Nutrition Revenue (billion) Forecast, by Application 2020 & 2033
- Table 84: Japan Lipid Nutrition Volume (K) Forecast, by Application 2020 & 2033
- Table 85: South Korea Lipid Nutrition Revenue (billion) Forecast, by Application 2020 & 2033
- Table 86: South Korea Lipid Nutrition Volume (K) Forecast, by Application 2020 & 2033
- Table 87: ASEAN Lipid Nutrition Revenue (billion) Forecast, by Application 2020 & 2033
- Table 88: ASEAN Lipid Nutrition Volume (K) Forecast, by Application 2020 & 2033
- Table 89: Oceania Lipid Nutrition Revenue (billion) Forecast, by Application 2020 & 2033
- Table 90: Oceania Lipid Nutrition Volume (K) Forecast, by Application 2020 & 2033
- Table 91: Rest of Asia Pacific Lipid Nutrition Revenue (billion) Forecast, by Application 2020 & 2033
- Table 92: Rest of Asia Pacific Lipid Nutrition Volume (K) Forecast, by Application 2020 & 2033
Frequently Asked Questions
1. What is the projected Compound Annual Growth Rate (CAGR) of the Lipid Nutrition?
The projected CAGR is approximately 6.33%.
2. Which companies are prominent players in the Lipid Nutrition?
Key companies in the market include Archer Daniels Midland, Basf, Croda International, Koninklijke Dsm, Nordic Naturals, Now Foods.
3. What are the main segments of the Lipid Nutrition?
The market segments include Application, Type.
4. Can you provide details about the market size?
The market size is estimated to be USD 15.4 billion as of 2022.
5. What are some drivers contributing to market growth?
N/A
6. What are the notable trends driving market growth?
N/A
7. Are there any restraints impacting market growth?
N/A
8. Can you provide examples of recent developments in the market?
N/A
9. What pricing options are available for accessing the report?
Pricing options include single-user, multi-user, and enterprise licenses priced at USD 3950.00, USD 5925.00, and USD 7900.00 respectively.
10. Is the market size provided in terms of value or volume?
The market size is provided in terms of value, measured in billion and volume, measured in K.
11. Are there any specific market keywords associated with the report?
Yes, the market keyword associated with the report is "Lipid Nutrition," which aids in identifying and referencing the specific market segment covered.
12. How do I determine which pricing option suits my needs best?
The pricing options vary based on user requirements and access needs. Individual users may opt for single-user licenses, while businesses requiring broader access may choose multi-user or enterprise licenses for cost-effective access to the report.
13. Are there any additional resources or data provided in the Lipid Nutrition report?
While the report offers comprehensive insights, it's advisable to review the specific contents or supplementary materials provided to ascertain if additional resources or data are available.
14. How can I stay updated on further developments or reports in the Lipid Nutrition?
To stay informed about further developments, trends, and reports in the Lipid Nutrition, consider subscribing to industry newsletters, following relevant companies and organizations, or regularly checking reputable industry news sources and publications.
Methodology
Step 1 - Identification of Relevant Samples Size from Population Database


Step 2 - Approaches for Defining Global Market Size (Value, Volume* & Price*)

Note*: In applicable scenarios
Step 3 - Data Sources
Primary Research
- Web Analytics
- Survey Reports
- Research Institute
- Latest Research Reports
- Opinion Leaders
Secondary Research
- Annual Reports
- White Paper
- Latest Press Release
- Industry Association
- Paid Database
- Investor Presentations

Step 4 - Data Triangulation
Involves using different sources of information in order to increase the validity of a study
These sources are likely to be stakeholders in a program - participants, other researchers, program staff, other community members, and so on.
Then we put all data in single framework & apply various statistical tools to find out the dynamic on the market.
During the analysis stage, feedback from the stakeholder groups would be compared to determine areas of agreement as well as areas of divergence