

Key Insights
The global liquid egg mixtures market is experiencing robust growth, driven by increasing demand from the food service industry, particularly quick-service restaurants (QSRs) and food manufacturers. Convenience, cost-effectiveness, and consistent quality offered by liquid egg mixtures compared to handling fresh eggs are major factors fueling market expansion. The rising popularity of processed foods, ready-to-eat meals, and bakery products further contributes to the market's upward trajectory. Technological advancements in processing and packaging are also enhancing the shelf life and quality of liquid egg mixtures, expanding their applications and market reach. Key players are focusing on product innovation, such as introducing specialized blends for specific applications (e.g., baking, confectionery), and exploring sustainable sourcing practices to cater to growing consumer demand for ethically and environmentally responsible products. The market is segmented by product type (whole egg, egg whites, yolk), application (bakery, confectionery, mayonnaise, sauces), and geography, with North America and Europe currently holding significant market shares.
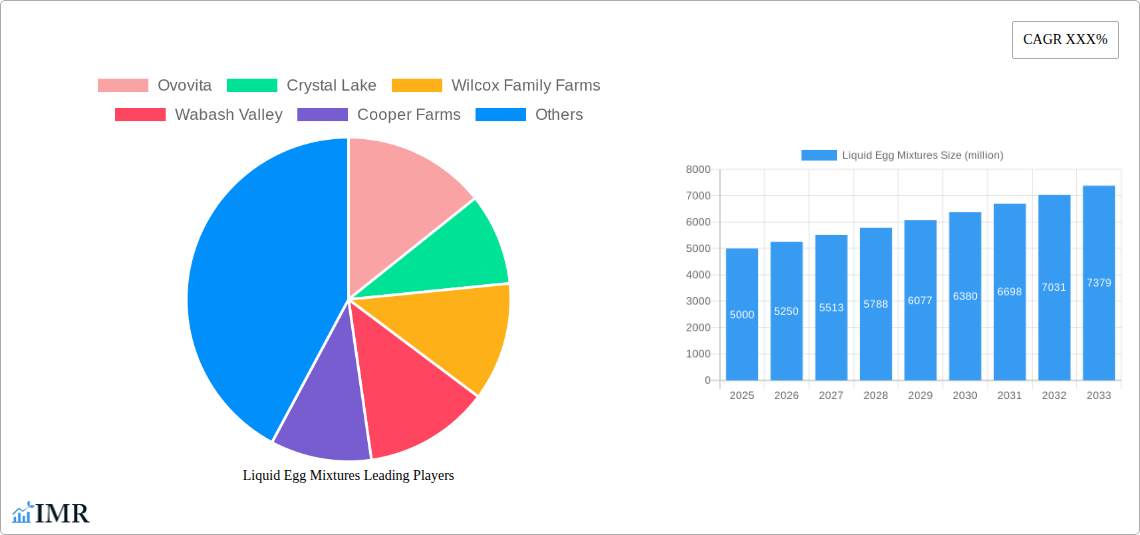
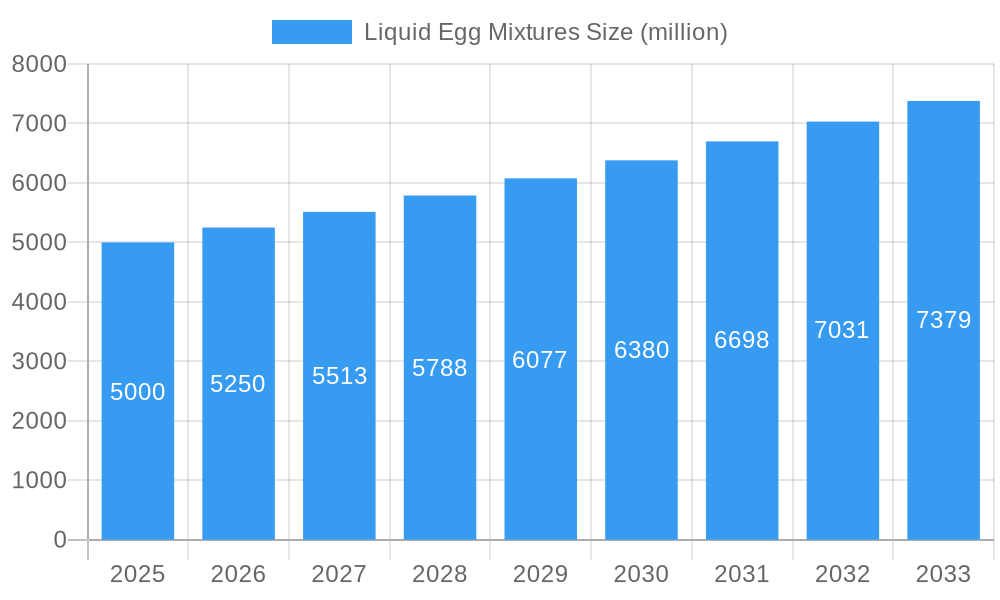
Liquid Egg Mixtures Market Size (In Billion)
Despite the growth potential, certain challenges persist. Fluctuations in egg prices due to factors like avian flu outbreaks and feed costs can impact profitability. Furthermore, concerns about food safety and the preservation methods used in liquid egg mixtures may present a hurdle. However, stringent regulatory frameworks and industry best practices are being implemented to address these concerns. The market is expected to witness a steady expansion over the forecast period (2025-2033), driven by continued demand from key sectors and ongoing technological advancements. Competitive intensity is moderate, with several established players and emerging companies vying for market share through product diversification and strategic partnerships. Future growth will largely depend on adapting to consumer preferences for healthier and more sustainable food products.
Liquid Egg Mixtures Company Market Share
Liquid Egg Mixtures Market Report: 2019-2033
This comprehensive report provides a detailed analysis of the global liquid egg mixtures market, encompassing historical data (2019-2024), current estimates (2025), and future projections (2025-2033). The report caters to industry professionals, investors, and strategic decision-makers seeking a deep understanding of this dynamic market. It leverages extensive primary and secondary research, incorporating insights from key players like Ovovita, Crystal Lake, Wilcox Family Farms, Wabash Valley, Cooper Farms, Michael Foods, Cargill, EggSolutions, Newburg Egg, Global Food Group, Willamette Egg Farms, Scholle IPN, and Siegel Egg, across various segments within the food processing and food service industries (parent market) with a focus on specific applications within bakery, food manufacturing, and quick-service restaurants (child market). The report's value lies in its granular data, insightful analysis, and actionable strategic recommendations.
Liquid Egg Mixtures Market Dynamics & Structure
The liquid egg mixtures market is characterized by moderate concentration, with a few large players holding significant market share. Technological innovation, particularly in preservation and shelf-life extension, is a key driver. Stringent regulatory frameworks regarding food safety and labeling influence production and distribution. Competitive substitutes include fresh eggs and egg powder, impacting market share. End-user demographics, shifting towards convenience and ready-to-eat options, fuel demand. Mergers and acquisitions (M&A) activity has been moderate in recent years, with xx million units representing the approximate value of deals in the historical period, shaping the competitive landscape.
- Market Concentration: Moderately concentrated, with top 5 players holding approximately xx% market share in 2025.
- Technological Innovation: Focus on extending shelf-life, improving functionality, and enhancing cost-effectiveness.
- Regulatory Framework: Stringent food safety and labeling regulations impacting product formulation and distribution.
- Competitive Substitutes: Fresh eggs and egg powder remain competitive alternatives, particularly in price-sensitive segments.
- End-User Demographics: Growing demand from the food service and food processing sectors drives market expansion.
- M&A Trends: Moderate M&A activity observed, with xx deals completed between 2019 and 2024.
Liquid Egg Mixtures Growth Trends & Insights
The global liquid egg mixtures market witnessed steady growth during the historical period (2019-2024), expanding from xx million units to xx million units in 2024. This growth is primarily attributed to increased demand from food processing industries and the rise of convenience food consumption. The market is projected to maintain a Compound Annual Growth Rate (CAGR) of xx% during the forecast period (2025-2033), reaching xx million units by 2033. Technological advancements, such as improved pasteurization techniques and aseptic packaging, are contributing factors. Consumer preference shifts towards healthier and convenient food options further stimulate market growth. Market penetration in developing economies remains relatively low, indicating significant untapped potential.
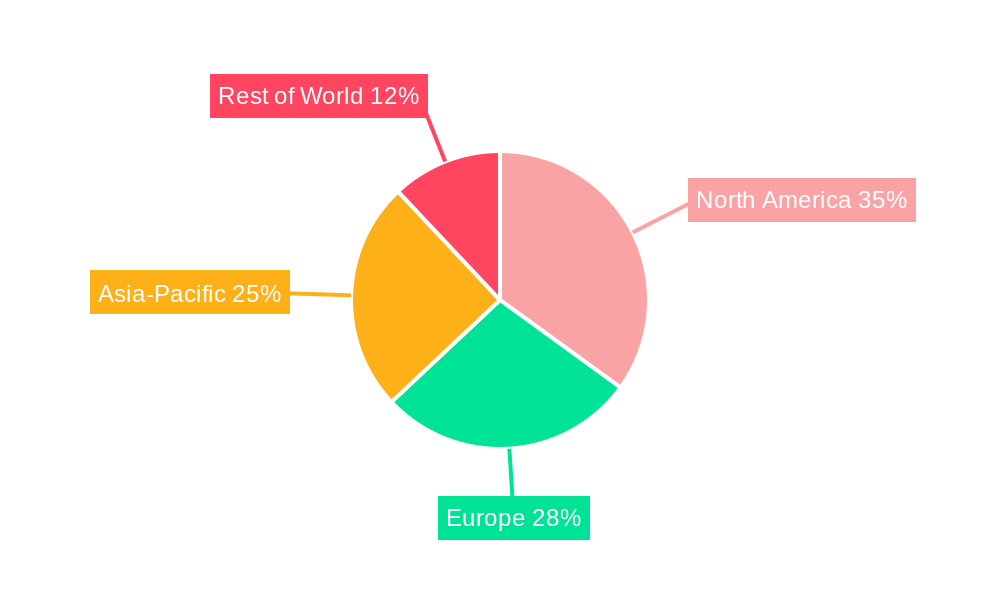
Dominant Regions, Countries, or Segments in Liquid Egg Mixtures
North America currently dominates the liquid egg mixtures market, driven by robust food processing and food service industries. This region accounts for approximately xx% of the global market share in 2025. Factors contributing to North America's dominance include:
- Strong Food Processing Industry: Large-scale food manufacturers heavily rely on liquid egg mixtures for their products.
- Developed Food Service Sector: Quick-service restaurants and other food outlets utilize liquid eggs for efficiency and consistency.
- Favorable Regulatory Environment: Established regulatory frameworks ensure product safety and quality.
- High Disposable Incomes: Consumer purchasing power fuels demand for convenient food products.
However, Asia-Pacific is expected to exhibit the highest growth rate during the forecast period, driven by factors such as rapid urbanization, rising disposable incomes, and growing preference for convenient food.
Liquid Egg Mixtures Product Landscape
Liquid egg mixtures are offered in various forms, including whole egg, egg yolk, and egg white blends, tailored to meet specific application requirements. Innovation focuses on enhancing functionality, extending shelf life, and improving flavor profiles. Pasteurized and aseptically packaged options dominate the market, offering extended shelf life and enhanced safety. Unique selling propositions include ease of use, consistent quality, and cost-effectiveness compared to using fresh eggs. Technological advancements in processing and packaging further improve product quality and convenience.
Key Drivers, Barriers & Challenges in Liquid Egg Mixtures
Key Drivers:
- Growing demand from the food processing industry.
- Increasing popularity of ready-to-eat meals and convenience foods.
- Technological advancements in processing and packaging.
- Favorable regulatory frameworks in developed markets.
Key Challenges:
- Fluctuations in egg prices and raw material availability.
- Stringent food safety regulations and compliance costs.
- Competition from fresh eggs and egg powder.
- Supply chain disruptions and logistical challenges. A xx% increase in transportation costs in 2023 impacted margins.
Emerging Opportunities in Liquid Egg Mixtures
- Growth in emerging markets: Untapped potential in developing economies with rising disposable incomes.
- Functional egg products: Development of value-added liquid egg mixtures with enhanced functionalities.
- Sustainable sourcing and production: Growing consumer demand for sustainably produced eggs.
- Plant-based egg alternatives: Increasing interest in plant-based food products presents opportunities for innovation.
Growth Accelerators in the Liquid Egg Mixtures Industry
Technological advancements in preservation and packaging technologies, coupled with strategic partnerships between egg producers and food manufacturers, are key drivers of long-term growth. Expansion into new geographical markets, particularly in developing economies, offers significant untapped potential. The development of innovative liquid egg mixtures with enhanced functionality and customized flavors will further stimulate market growth.
Key Players Shaping the Liquid Egg Mixtures Market
- Ovovita
- Crystal Lake
- Wilcox Family Farms
- Wabash Valley
- Cooper Farms
- Michael Foods
- Cargill
- EggSolutions
- Newburg Egg
- Global Food Group
- Willamette Egg Farms
- Scholle IPN
- Siegel Egg
Notable Milestones in Liquid Egg Mixtures Sector
- 2020, Q4: Michael Foods launched a new line of extended shelf-life liquid egg mixtures.
- 2022, Q2: Cargill acquired a smaller egg processing facility, expanding its production capacity.
- 2023, Q1: New regulations on food safety and labeling were implemented in several key markets.
In-Depth Liquid Egg Mixtures Market Outlook
The global liquid egg mixtures market is poised for continued growth, driven by several factors. Technological advancements, strategic partnerships, and expansion into new markets will play crucial roles in shaping future market dynamics. The growing demand for convenient and ready-to-eat foods, coupled with increased adoption of liquid egg mixtures in the food processing industry, indicates significant market potential. Companies that invest in innovation, sustainability, and efficient supply chains will be best positioned to capitalize on the growth opportunities in this dynamic market.
Liquid Egg Mixtures Segmentation
-
1. Application
- 1.1. Restaurant
- 1.2. Bakery
- 1.3. Other
-
2. Type
- 2.1. High Egg White Low Yolk
- 2.2. Low Egg White High Yolk
Liquid Egg Mixtures Segmentation By Geography
-
1. North America
- 1.1. United States
- 1.2. Canada
- 1.3. Mexico
-
2. South America
- 2.1. Brazil
- 2.2. Argentina
- 2.3. Rest of South America
-
3. Europe
- 3.1. United Kingdom
- 3.2. Germany
- 3.3. France
- 3.4. Italy
- 3.5. Spain
- 3.6. Russia
- 3.7. Benelux
- 3.8. Nordics
- 3.9. Rest of Europe
-
4. Middle East & Africa
- 4.1. Turkey
- 4.2. Israel
- 4.3. GCC
- 4.4. North Africa
- 4.5. South Africa
- 4.6. Rest of Middle East & Africa
-
5. Asia Pacific
- 5.1. China
- 5.2. India
- 5.3. Japan
- 5.4. South Korea
- 5.5. ASEAN
- 5.6. Oceania
- 5.7. Rest of Asia Pacific
Liquid Egg Mixtures Regional Market Share
Geographic Coverage of Liquid Egg Mixtures
Liquid Egg Mixtures REPORT HIGHLIGHTS
| Aspects | Details |
|---|---|
| Study Period | 2020-2034 |
| Base Year | 2025 |
| Estimated Year | 2026 |
| Forecast Period | 2026-2034 |
| Historical Period | 2020-2025 |
| Growth Rate | CAGR of 6.4% from 2020-2034 |
| Segmentation |
|
Table of Contents
- 1. Introduction
- 1.1. Research Scope
- 1.2. Market Segmentation
- 1.3. Research Objective
- 1.4. Definitions and Assumptions
- 2. Executive Summary
- 2.1. Market Snapshot
- 3. Market Dynamics
- 3.1. Market Drivers
- 3.2. Market Restrains
- 3.3. Market Trends
- 3.4. Market Opportunities
- 4. Market Factor Analysis
- 4.1. Porters Five Forces
- 4.1.1. Bargaining Power of Suppliers
- 4.1.2. Bargaining Power of Buyers
- 4.1.3. Threat of New Entrants
- 4.1.4. Threat of Substitutes
- 4.1.5. Competitive Rivalry
- 4.2. PESTEL analysis
- 4.3. BCG Analysis
- 4.3.1. Stars (High Growth, High Market Share)
- 4.3.2. Cash Cows (Low Growth, High Market Share)
- 4.3.3. Question Mark (High Growth, Low Market Share)
- 4.3.4. Dogs (Low Growth, Low Market Share)
- 4.4. Ansoff Matrix Analysis
- 4.5. Supply Chain Analysis
- 4.6. Regulatory Landscape
- 4.7. Current Market Potential and Opportunity Assessment (TAM–SAM–SOM Framework)
- 4.8. IMR Analyst Note
- 4.1. Porters Five Forces
- 5. Market Analysis, Insights and Forecast 2021-2033
- 5.1. Market Analysis, Insights and Forecast - by Application
- 5.1.1. Restaurant
- 5.1.2. Bakery
- 5.1.3. Other
- 5.2. Market Analysis, Insights and Forecast - by Type
- 5.2.1. High Egg White Low Yolk
- 5.2.2. Low Egg White High Yolk
- 5.3. Market Analysis, Insights and Forecast - by Region
- 5.3.1. North America
- 5.3.2. South America
- 5.3.3. Europe
- 5.3.4. Middle East & Africa
- 5.3.5. Asia Pacific
- 5.1. Market Analysis, Insights and Forecast - by Application
- 6. Global Liquid Egg Mixtures Analysis, Insights and Forecast, 2021-2033
- 6.1. Market Analysis, Insights and Forecast - by Application
- 6.1.1. Restaurant
- 6.1.2. Bakery
- 6.1.3. Other
- 6.2. Market Analysis, Insights and Forecast - by Type
- 6.2.1. High Egg White Low Yolk
- 6.2.2. Low Egg White High Yolk
- 6.1. Market Analysis, Insights and Forecast - by Application
- 7. North America Liquid Egg Mixtures Analysis, Insights and Forecast, 2020-2032
- 7.1. Market Analysis, Insights and Forecast - by Application
- 7.1.1. Restaurant
- 7.1.2. Bakery
- 7.1.3. Other
- 7.2. Market Analysis, Insights and Forecast - by Type
- 7.2.1. High Egg White Low Yolk
- 7.2.2. Low Egg White High Yolk
- 7.1. Market Analysis, Insights and Forecast - by Application
- 8. South America Liquid Egg Mixtures Analysis, Insights and Forecast, 2020-2032
- 8.1. Market Analysis, Insights and Forecast - by Application
- 8.1.1. Restaurant
- 8.1.2. Bakery
- 8.1.3. Other
- 8.2. Market Analysis, Insights and Forecast - by Type
- 8.2.1. High Egg White Low Yolk
- 8.2.2. Low Egg White High Yolk
- 8.1. Market Analysis, Insights and Forecast - by Application
- 9. Europe Liquid Egg Mixtures Analysis, Insights and Forecast, 2020-2032
- 9.1. Market Analysis, Insights and Forecast - by Application
- 9.1.1. Restaurant
- 9.1.2. Bakery
- 9.1.3. Other
- 9.2. Market Analysis, Insights and Forecast - by Type
- 9.2.1. High Egg White Low Yolk
- 9.2.2. Low Egg White High Yolk
- 9.1. Market Analysis, Insights and Forecast - by Application
- 10. Middle East & Africa Liquid Egg Mixtures Analysis, Insights and Forecast, 2020-2032
- 10.1. Market Analysis, Insights and Forecast - by Application
- 10.1.1. Restaurant
- 10.1.2. Bakery
- 10.1.3. Other
- 10.2. Market Analysis, Insights and Forecast - by Type
- 10.2.1. High Egg White Low Yolk
- 10.2.2. Low Egg White High Yolk
- 10.1. Market Analysis, Insights and Forecast - by Application
- 11. Asia Pacific Liquid Egg Mixtures Analysis, Insights and Forecast, 2020-2032
- 11.1. Market Analysis, Insights and Forecast - by Application
- 11.1.1. Restaurant
- 11.1.2. Bakery
- 11.1.3. Other
- 11.2. Market Analysis, Insights and Forecast - by Type
- 11.2.1. High Egg White Low Yolk
- 11.2.2. Low Egg White High Yolk
- 11.1. Market Analysis, Insights and Forecast - by Application
- 12. Competitive Analysis
- 12.1. Company Profiles
- 12.1.1 Ovovita
- 12.1.1.1. Company Overview
- 12.1.1.2. Products
- 12.1.1.3. Company Financials
- 12.1.1.4. SWOT Analysis
- 12.1.2 Crystal Lake
- 12.1.2.1. Company Overview
- 12.1.2.2. Products
- 12.1.2.3. Company Financials
- 12.1.2.4. SWOT Analysis
- 12.1.3 Wilcox Family Farms
- 12.1.3.1. Company Overview
- 12.1.3.2. Products
- 12.1.3.3. Company Financials
- 12.1.3.4. SWOT Analysis
- 12.1.4 Wabash Valley
- 12.1.4.1. Company Overview
- 12.1.4.2. Products
- 12.1.4.3. Company Financials
- 12.1.4.4. SWOT Analysis
- 12.1.5 Cooper Farms
- 12.1.5.1. Company Overview
- 12.1.5.2. Products
- 12.1.5.3. Company Financials
- 12.1.5.4. SWOT Analysis
- 12.1.6 Michael Foods
- 12.1.6.1. Company Overview
- 12.1.6.2. Products
- 12.1.6.3. Company Financials
- 12.1.6.4. SWOT Analysis
- 12.1.7 Cargill
- 12.1.7.1. Company Overview
- 12.1.7.2. Products
- 12.1.7.3. Company Financials
- 12.1.7.4. SWOT Analysis
- 12.1.8 EggSolutions
- 12.1.8.1. Company Overview
- 12.1.8.2. Products
- 12.1.8.3. Company Financials
- 12.1.8.4. SWOT Analysis
- 12.1.9 Newburg Egg
- 12.1.9.1. Company Overview
- 12.1.9.2. Products
- 12.1.9.3. Company Financials
- 12.1.9.4. SWOT Analysis
- 12.1.10 Global Food Group
- 12.1.10.1. Company Overview
- 12.1.10.2. Products
- 12.1.10.3. Company Financials
- 12.1.10.4. SWOT Analysis
- 12.1.11 Willamette Egg Farms
- 12.1.11.1. Company Overview
- 12.1.11.2. Products
- 12.1.11.3. Company Financials
- 12.1.11.4. SWOT Analysis
- 12.1.12 Scholle IPN
- 12.1.12.1. Company Overview
- 12.1.12.2. Products
- 12.1.12.3. Company Financials
- 12.1.12.4. SWOT Analysis
- 12.1.13 Siegel Egg
- 12.1.13.1. Company Overview
- 12.1.13.2. Products
- 12.1.13.3. Company Financials
- 12.1.13.4. SWOT Analysis
- 12.1.1 Ovovita
- 12.2. Market Entropy
- 12.2.1 Company's Key Areas Served
- 12.2.2 Recent Developments
- 12.3. Company Market Share Analysis 2025
- 12.3.1 Top 5 Companies Market Share Analysis
- 12.3.2 Top 3 Companies Market Share Analysis
- 12.4. List of Potential Customers
- 13. Research Methodology
List of Figures
- Figure 1: Global Liquid Egg Mixtures Revenue Breakdown (undefined, %) by Region 2025 & 2033
- Figure 2: Global Liquid Egg Mixtures Volume Breakdown (K, %) by Region 2025 & 2033
- Figure 3: North America Liquid Egg Mixtures Revenue (undefined), by Application 2025 & 2033
- Figure 4: North America Liquid Egg Mixtures Volume (K), by Application 2025 & 2033
- Figure 5: North America Liquid Egg Mixtures Revenue Share (%), by Application 2025 & 2033
- Figure 6: North America Liquid Egg Mixtures Volume Share (%), by Application 2025 & 2033
- Figure 7: North America Liquid Egg Mixtures Revenue (undefined), by Type 2025 & 2033
- Figure 8: North America Liquid Egg Mixtures Volume (K), by Type 2025 & 2033
- Figure 9: North America Liquid Egg Mixtures Revenue Share (%), by Type 2025 & 2033
- Figure 10: North America Liquid Egg Mixtures Volume Share (%), by Type 2025 & 2033
- Figure 11: North America Liquid Egg Mixtures Revenue (undefined), by Country 2025 & 2033
- Figure 12: North America Liquid Egg Mixtures Volume (K), by Country 2025 & 2033
- Figure 13: North America Liquid Egg Mixtures Revenue Share (%), by Country 2025 & 2033
- Figure 14: North America Liquid Egg Mixtures Volume Share (%), by Country 2025 & 2033
- Figure 15: South America Liquid Egg Mixtures Revenue (undefined), by Application 2025 & 2033
- Figure 16: South America Liquid Egg Mixtures Volume (K), by Application 2025 & 2033
- Figure 17: South America Liquid Egg Mixtures Revenue Share (%), by Application 2025 & 2033
- Figure 18: South America Liquid Egg Mixtures Volume Share (%), by Application 2025 & 2033
- Figure 19: South America Liquid Egg Mixtures Revenue (undefined), by Type 2025 & 2033
- Figure 20: South America Liquid Egg Mixtures Volume (K), by Type 2025 & 2033
- Figure 21: South America Liquid Egg Mixtures Revenue Share (%), by Type 2025 & 2033
- Figure 22: South America Liquid Egg Mixtures Volume Share (%), by Type 2025 & 2033
- Figure 23: South America Liquid Egg Mixtures Revenue (undefined), by Country 2025 & 2033
- Figure 24: South America Liquid Egg Mixtures Volume (K), by Country 2025 & 2033
- Figure 25: South America Liquid Egg Mixtures Revenue Share (%), by Country 2025 & 2033
- Figure 26: South America Liquid Egg Mixtures Volume Share (%), by Country 2025 & 2033
- Figure 27: Europe Liquid Egg Mixtures Revenue (undefined), by Application 2025 & 2033
- Figure 28: Europe Liquid Egg Mixtures Volume (K), by Application 2025 & 2033
- Figure 29: Europe Liquid Egg Mixtures Revenue Share (%), by Application 2025 & 2033
- Figure 30: Europe Liquid Egg Mixtures Volume Share (%), by Application 2025 & 2033
- Figure 31: Europe Liquid Egg Mixtures Revenue (undefined), by Type 2025 & 2033
- Figure 32: Europe Liquid Egg Mixtures Volume (K), by Type 2025 & 2033
- Figure 33: Europe Liquid Egg Mixtures Revenue Share (%), by Type 2025 & 2033
- Figure 34: Europe Liquid Egg Mixtures Volume Share (%), by Type 2025 & 2033
- Figure 35: Europe Liquid Egg Mixtures Revenue (undefined), by Country 2025 & 2033
- Figure 36: Europe Liquid Egg Mixtures Volume (K), by Country 2025 & 2033
- Figure 37: Europe Liquid Egg Mixtures Revenue Share (%), by Country 2025 & 2033
- Figure 38: Europe Liquid Egg Mixtures Volume Share (%), by Country 2025 & 2033
- Figure 39: Middle East & Africa Liquid Egg Mixtures Revenue (undefined), by Application 2025 & 2033
- Figure 40: Middle East & Africa Liquid Egg Mixtures Volume (K), by Application 2025 & 2033
- Figure 41: Middle East & Africa Liquid Egg Mixtures Revenue Share (%), by Application 2025 & 2033
- Figure 42: Middle East & Africa Liquid Egg Mixtures Volume Share (%), by Application 2025 & 2033
- Figure 43: Middle East & Africa Liquid Egg Mixtures Revenue (undefined), by Type 2025 & 2033
- Figure 44: Middle East & Africa Liquid Egg Mixtures Volume (K), by Type 2025 & 2033
- Figure 45: Middle East & Africa Liquid Egg Mixtures Revenue Share (%), by Type 2025 & 2033
- Figure 46: Middle East & Africa Liquid Egg Mixtures Volume Share (%), by Type 2025 & 2033
- Figure 47: Middle East & Africa Liquid Egg Mixtures Revenue (undefined), by Country 2025 & 2033
- Figure 48: Middle East & Africa Liquid Egg Mixtures Volume (K), by Country 2025 & 2033
- Figure 49: Middle East & Africa Liquid Egg Mixtures Revenue Share (%), by Country 2025 & 2033
- Figure 50: Middle East & Africa Liquid Egg Mixtures Volume Share (%), by Country 2025 & 2033
- Figure 51: Asia Pacific Liquid Egg Mixtures Revenue (undefined), by Application 2025 & 2033
- Figure 52: Asia Pacific Liquid Egg Mixtures Volume (K), by Application 2025 & 2033
- Figure 53: Asia Pacific Liquid Egg Mixtures Revenue Share (%), by Application 2025 & 2033
- Figure 54: Asia Pacific Liquid Egg Mixtures Volume Share (%), by Application 2025 & 2033
- Figure 55: Asia Pacific Liquid Egg Mixtures Revenue (undefined), by Type 2025 & 2033
- Figure 56: Asia Pacific Liquid Egg Mixtures Volume (K), by Type 2025 & 2033
- Figure 57: Asia Pacific Liquid Egg Mixtures Revenue Share (%), by Type 2025 & 2033
- Figure 58: Asia Pacific Liquid Egg Mixtures Volume Share (%), by Type 2025 & 2033
- Figure 59: Asia Pacific Liquid Egg Mixtures Revenue (undefined), by Country 2025 & 2033
- Figure 60: Asia Pacific Liquid Egg Mixtures Volume (K), by Country 2025 & 2033
- Figure 61: Asia Pacific Liquid Egg Mixtures Revenue Share (%), by Country 2025 & 2033
- Figure 62: Asia Pacific Liquid Egg Mixtures Volume Share (%), by Country 2025 & 2033
List of Tables
- Table 1: Global Liquid Egg Mixtures Revenue undefined Forecast, by Application 2020 & 2033
- Table 2: Global Liquid Egg Mixtures Volume K Forecast, by Application 2020 & 2033
- Table 3: Global Liquid Egg Mixtures Revenue undefined Forecast, by Type 2020 & 2033
- Table 4: Global Liquid Egg Mixtures Volume K Forecast, by Type 2020 & 2033
- Table 5: Global Liquid Egg Mixtures Revenue undefined Forecast, by Region 2020 & 2033
- Table 6: Global Liquid Egg Mixtures Volume K Forecast, by Region 2020 & 2033
- Table 7: Global Liquid Egg Mixtures Revenue undefined Forecast, by Application 2020 & 2033
- Table 8: Global Liquid Egg Mixtures Volume K Forecast, by Application 2020 & 2033
- Table 9: Global Liquid Egg Mixtures Revenue undefined Forecast, by Type 2020 & 2033
- Table 10: Global Liquid Egg Mixtures Volume K Forecast, by Type 2020 & 2033
- Table 11: Global Liquid Egg Mixtures Revenue undefined Forecast, by Country 2020 & 2033
- Table 12: Global Liquid Egg Mixtures Volume K Forecast, by Country 2020 & 2033
- Table 13: United States Liquid Egg Mixtures Revenue (undefined) Forecast, by Application 2020 & 2033
- Table 14: United States Liquid Egg Mixtures Volume (K) Forecast, by Application 2020 & 2033
- Table 15: Canada Liquid Egg Mixtures Revenue (undefined) Forecast, by Application 2020 & 2033
- Table 16: Canada Liquid Egg Mixtures Volume (K) Forecast, by Application 2020 & 2033
- Table 17: Mexico Liquid Egg Mixtures Revenue (undefined) Forecast, by Application 2020 & 2033
- Table 18: Mexico Liquid Egg Mixtures Volume (K) Forecast, by Application 2020 & 2033
- Table 19: Global Liquid Egg Mixtures Revenue undefined Forecast, by Application 2020 & 2033
- Table 20: Global Liquid Egg Mixtures Volume K Forecast, by Application 2020 & 2033
- Table 21: Global Liquid Egg Mixtures Revenue undefined Forecast, by Type 2020 & 2033
- Table 22: Global Liquid Egg Mixtures Volume K Forecast, by Type 2020 & 2033
- Table 23: Global Liquid Egg Mixtures Revenue undefined Forecast, by Country 2020 & 2033
- Table 24: Global Liquid Egg Mixtures Volume K Forecast, by Country 2020 & 2033
- Table 25: Brazil Liquid Egg Mixtures Revenue (undefined) Forecast, by Application 2020 & 2033
- Table 26: Brazil Liquid Egg Mixtures Volume (K) Forecast, by Application 2020 & 2033
- Table 27: Argentina Liquid Egg Mixtures Revenue (undefined) Forecast, by Application 2020 & 2033
- Table 28: Argentina Liquid Egg Mixtures Volume (K) Forecast, by Application 2020 & 2033
- Table 29: Rest of South America Liquid Egg Mixtures Revenue (undefined) Forecast, by Application 2020 & 2033
- Table 30: Rest of South America Liquid Egg Mixtures Volume (K) Forecast, by Application 2020 & 2033
- Table 31: Global Liquid Egg Mixtures Revenue undefined Forecast, by Application 2020 & 2033
- Table 32: Global Liquid Egg Mixtures Volume K Forecast, by Application 2020 & 2033
- Table 33: Global Liquid Egg Mixtures Revenue undefined Forecast, by Type 2020 & 2033
- Table 34: Global Liquid Egg Mixtures Volume K Forecast, by Type 2020 & 2033
- Table 35: Global Liquid Egg Mixtures Revenue undefined Forecast, by Country 2020 & 2033
- Table 36: Global Liquid Egg Mixtures Volume K Forecast, by Country 2020 & 2033
- Table 37: United Kingdom Liquid Egg Mixtures Revenue (undefined) Forecast, by Application 2020 & 2033
- Table 38: United Kingdom Liquid Egg Mixtures Volume (K) Forecast, by Application 2020 & 2033
- Table 39: Germany Liquid Egg Mixtures Revenue (undefined) Forecast, by Application 2020 & 2033
- Table 40: Germany Liquid Egg Mixtures Volume (K) Forecast, by Application 2020 & 2033
- Table 41: France Liquid Egg Mixtures Revenue (undefined) Forecast, by Application 2020 & 2033
- Table 42: France Liquid Egg Mixtures Volume (K) Forecast, by Application 2020 & 2033
- Table 43: Italy Liquid Egg Mixtures Revenue (undefined) Forecast, by Application 2020 & 2033
- Table 44: Italy Liquid Egg Mixtures Volume (K) Forecast, by Application 2020 & 2033
- Table 45: Spain Liquid Egg Mixtures Revenue (undefined) Forecast, by Application 2020 & 2033
- Table 46: Spain Liquid Egg Mixtures Volume (K) Forecast, by Application 2020 & 2033
- Table 47: Russia Liquid Egg Mixtures Revenue (undefined) Forecast, by Application 2020 & 2033
- Table 48: Russia Liquid Egg Mixtures Volume (K) Forecast, by Application 2020 & 2033
- Table 49: Benelux Liquid Egg Mixtures Revenue (undefined) Forecast, by Application 2020 & 2033
- Table 50: Benelux Liquid Egg Mixtures Volume (K) Forecast, by Application 2020 & 2033
- Table 51: Nordics Liquid Egg Mixtures Revenue (undefined) Forecast, by Application 2020 & 2033
- Table 52: Nordics Liquid Egg Mixtures Volume (K) Forecast, by Application 2020 & 2033
- Table 53: Rest of Europe Liquid Egg Mixtures Revenue (undefined) Forecast, by Application 2020 & 2033
- Table 54: Rest of Europe Liquid Egg Mixtures Volume (K) Forecast, by Application 2020 & 2033
- Table 55: Global Liquid Egg Mixtures Revenue undefined Forecast, by Application 2020 & 2033
- Table 56: Global Liquid Egg Mixtures Volume K Forecast, by Application 2020 & 2033
- Table 57: Global Liquid Egg Mixtures Revenue undefined Forecast, by Type 2020 & 2033
- Table 58: Global Liquid Egg Mixtures Volume K Forecast, by Type 2020 & 2033
- Table 59: Global Liquid Egg Mixtures Revenue undefined Forecast, by Country 2020 & 2033
- Table 60: Global Liquid Egg Mixtures Volume K Forecast, by Country 2020 & 2033
- Table 61: Turkey Liquid Egg Mixtures Revenue (undefined) Forecast, by Application 2020 & 2033
- Table 62: Turkey Liquid Egg Mixtures Volume (K) Forecast, by Application 2020 & 2033
- Table 63: Israel Liquid Egg Mixtures Revenue (undefined) Forecast, by Application 2020 & 2033
- Table 64: Israel Liquid Egg Mixtures Volume (K) Forecast, by Application 2020 & 2033
- Table 65: GCC Liquid Egg Mixtures Revenue (undefined) Forecast, by Application 2020 & 2033
- Table 66: GCC Liquid Egg Mixtures Volume (K) Forecast, by Application 2020 & 2033
- Table 67: North Africa Liquid Egg Mixtures Revenue (undefined) Forecast, by Application 2020 & 2033
- Table 68: North Africa Liquid Egg Mixtures Volume (K) Forecast, by Application 2020 & 2033
- Table 69: South Africa Liquid Egg Mixtures Revenue (undefined) Forecast, by Application 2020 & 2033
- Table 70: South Africa Liquid Egg Mixtures Volume (K) Forecast, by Application 2020 & 2033
- Table 71: Rest of Middle East & Africa Liquid Egg Mixtures Revenue (undefined) Forecast, by Application 2020 & 2033
- Table 72: Rest of Middle East & Africa Liquid Egg Mixtures Volume (K) Forecast, by Application 2020 & 2033
- Table 73: Global Liquid Egg Mixtures Revenue undefined Forecast, by Application 2020 & 2033
- Table 74: Global Liquid Egg Mixtures Volume K Forecast, by Application 2020 & 2033
- Table 75: Global Liquid Egg Mixtures Revenue undefined Forecast, by Type 2020 & 2033
- Table 76: Global Liquid Egg Mixtures Volume K Forecast, by Type 2020 & 2033
- Table 77: Global Liquid Egg Mixtures Revenue undefined Forecast, by Country 2020 & 2033
- Table 78: Global Liquid Egg Mixtures Volume K Forecast, by Country 2020 & 2033
- Table 79: China Liquid Egg Mixtures Revenue (undefined) Forecast, by Application 2020 & 2033
- Table 80: China Liquid Egg Mixtures Volume (K) Forecast, by Application 2020 & 2033
- Table 81: India Liquid Egg Mixtures Revenue (undefined) Forecast, by Application 2020 & 2033
- Table 82: India Liquid Egg Mixtures Volume (K) Forecast, by Application 2020 & 2033
- Table 83: Japan Liquid Egg Mixtures Revenue (undefined) Forecast, by Application 2020 & 2033
- Table 84: Japan Liquid Egg Mixtures Volume (K) Forecast, by Application 2020 & 2033
- Table 85: South Korea Liquid Egg Mixtures Revenue (undefined) Forecast, by Application 2020 & 2033
- Table 86: South Korea Liquid Egg Mixtures Volume (K) Forecast, by Application 2020 & 2033
- Table 87: ASEAN Liquid Egg Mixtures Revenue (undefined) Forecast, by Application 2020 & 2033
- Table 88: ASEAN Liquid Egg Mixtures Volume (K) Forecast, by Application 2020 & 2033
- Table 89: Oceania Liquid Egg Mixtures Revenue (undefined) Forecast, by Application 2020 & 2033
- Table 90: Oceania Liquid Egg Mixtures Volume (K) Forecast, by Application 2020 & 2033
- Table 91: Rest of Asia Pacific Liquid Egg Mixtures Revenue (undefined) Forecast, by Application 2020 & 2033
- Table 92: Rest of Asia Pacific Liquid Egg Mixtures Volume (K) Forecast, by Application 2020 & 2033
Frequently Asked Questions
1. What is the projected Compound Annual Growth Rate (CAGR) of the Liquid Egg Mixtures?
The projected CAGR is approximately 6.4%.
2. Which companies are prominent players in the Liquid Egg Mixtures?
Key companies in the market include Ovovita, Crystal Lake, Wilcox Family Farms, Wabash Valley, Cooper Farms, Michael Foods, Cargill, EggSolutions, Newburg Egg, Global Food Group, Willamette Egg Farms, Scholle IPN, Siegel Egg.
3. What are the main segments of the Liquid Egg Mixtures?
The market segments include Application, Type.
4. Can you provide details about the market size?
The market size is estimated to be USD XXX N/A as of 2022.
5. What are some drivers contributing to market growth?
N/A
6. What are the notable trends driving market growth?
N/A
7. Are there any restraints impacting market growth?
N/A
8. Can you provide examples of recent developments in the market?
N/A
9. What pricing options are available for accessing the report?
Pricing options include single-user, multi-user, and enterprise licenses priced at USD 3950.00, USD 5925.00, and USD 7900.00 respectively.
10. Is the market size provided in terms of value or volume?
The market size is provided in terms of value, measured in N/A and volume, measured in K.
11. Are there any specific market keywords associated with the report?
Yes, the market keyword associated with the report is "Liquid Egg Mixtures," which aids in identifying and referencing the specific market segment covered.
12. How do I determine which pricing option suits my needs best?
The pricing options vary based on user requirements and access needs. Individual users may opt for single-user licenses, while businesses requiring broader access may choose multi-user or enterprise licenses for cost-effective access to the report.
13. Are there any additional resources or data provided in the Liquid Egg Mixtures report?
While the report offers comprehensive insights, it's advisable to review the specific contents or supplementary materials provided to ascertain if additional resources or data are available.
14. How can I stay updated on further developments or reports in the Liquid Egg Mixtures?
To stay informed about further developments, trends, and reports in the Liquid Egg Mixtures, consider subscribing to industry newsletters, following relevant companies and organizations, or regularly checking reputable industry news sources and publications.
Methodology
Step 1 - Identification of Relevant Samples Size from Population Database


Step 2 - Approaches for Defining Global Market Size (Value, Volume* & Price*)

Note*: In applicable scenarios
Step 3 - Data Sources
Primary Research
- Web Analytics
- Survey Reports
- Research Institute
- Latest Research Reports
- Opinion Leaders
Secondary Research
- Annual Reports
- White Paper
- Latest Press Release
- Industry Association
- Paid Database
- Investor Presentations

Step 4 - Data Triangulation
Involves using different sources of information in order to increase the validity of a study
These sources are likely to be stakeholders in a program - participants, other researchers, program staff, other community members, and so on.
Then we put all data in single framework & apply various statistical tools to find out the dynamic on the market.
During the analysis stage, feedback from the stakeholder groups would be compared to determine areas of agreement as well as areas of divergence