

Key Insights
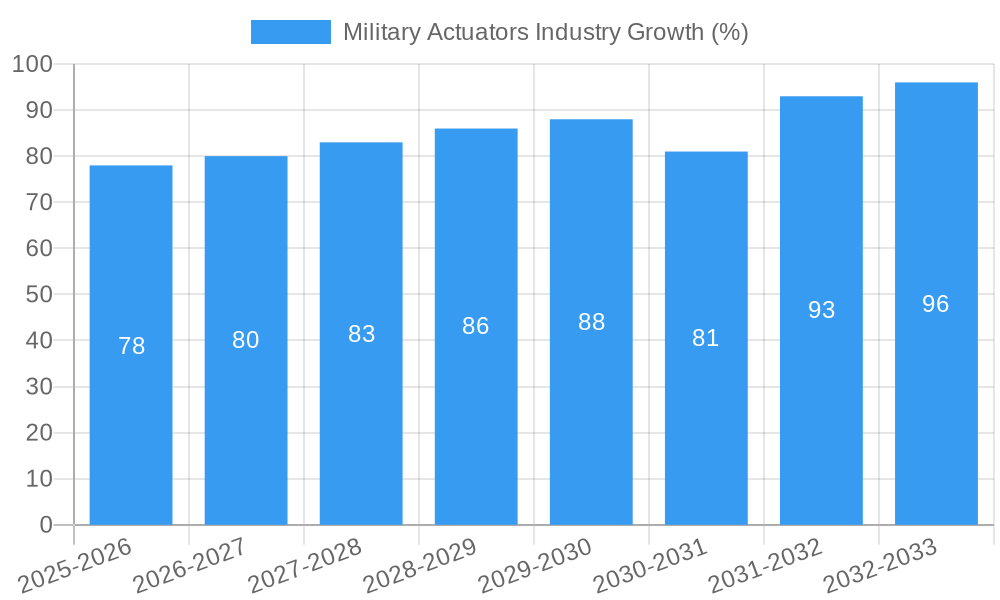
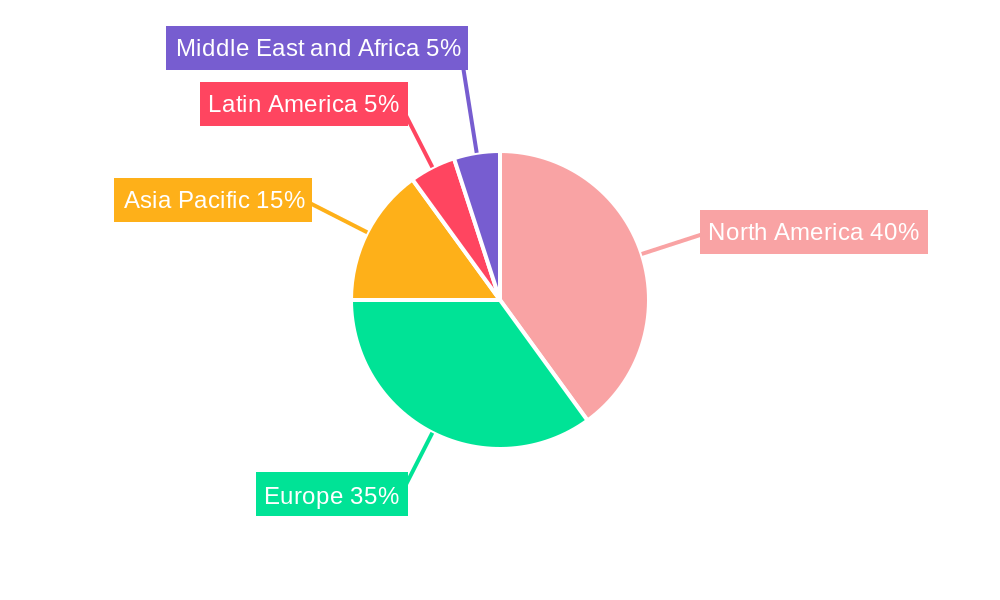
The Military Actuators market, valued at approximately $2.5 billion in 2025, is projected to experience steady growth, driven primarily by increasing defense budgets globally and the modernization of military platforms. The market's Compound Annual Growth Rate (CAGR) of 3.14% from 2019-2033 indicates a consistent expansion, fueled by technological advancements in actuator types, such as the integration of electric and hydraulic systems for improved precision and efficiency in military applications. Demand for enhanced control systems in unmanned aerial vehicles (UAVs), advanced missile systems, and next-generation combat vehicles significantly contributes to market growth. While challenges exist, such as stringent quality and reliability standards for military-grade equipment, and fluctuating geopolitical factors that can impact defense spending, the long-term outlook remains positive due to continuous innovation and the ongoing need for advanced actuator technologies in modern military hardware. The segmentation highlights the significant roles of linear and rotary actuators, with mechanical and hydraulic systems currently dominating the market, while electric and pneumatic systems are poised for greater adoption due to advancements in power efficiency and control precision. Geographic distribution shows a concentration of market share in North America and Europe, but the Asia-Pacific region is projected to witness substantial growth in the coming years driven by increased defense modernization initiatives in countries like China and India.
The competitive landscape is characterized by both established players like Raytheon Technologies, AMETEK, and Moog, and specialized smaller companies focused on niche applications. These companies are investing heavily in research and development to improve actuator performance, durability, and integration capabilities. Future growth will be influenced by factors such as the increasing adoption of autonomous systems, the development of more sophisticated weapons systems, and the emphasis on reducing weight and increasing efficiency in military platforms. The continued development and adoption of hybrid actuator technologies, which combine the benefits of different actuator types, will likely be a key driver in shaping the market landscape during the forecast period.
Military Actuators Industry Market Report: 2019-2033
This comprehensive report provides an in-depth analysis of the Military Actuators market, covering market dynamics, growth trends, regional analysis, product landscape, key players, and future outlook. The report covers the period from 2019 to 2033, with 2025 as the base year and forecast period extending to 2033. The study segments the market by type (Linear, Rotary), system (Mechanical, Hydraulic, Electrical, Pneumatic), and application (Land, Air, Sea), offering granular insights into this crucial defense sector.

Military Actuators Industry Market Dynamics & Structure
The military actuators market, valued at xx million units in 2024, exhibits a moderately concentrated structure with a few dominant players and several niche players. Technological innovation, driven by the need for enhanced precision, durability, and miniaturization in military applications, is a key driver. Stringent regulatory frameworks regarding safety and performance standards significantly influence market dynamics. Competition from alternative technologies, such as advanced materials and smart actuators, poses both a challenge and an opportunity for established players. The end-user demographics are primarily government defense departments and military contractors globally. The historical period (2019-2024) witnessed a modest number of M&A activities, with approximately xx deals, primarily focused on consolidating technology and expanding geographic reach. This trend is expected to continue with a predicted increase to xx deals during the forecast period (2025-2033).
- Market Concentration: Moderately concentrated, with top 5 players holding approximately xx% market share in 2024.
- Technological Innovation: Focus on miniaturization, improved precision, and enhanced durability.
- Regulatory Landscape: Stringent safety and performance standards.
- Competitive Substitutes: Advanced materials, smart actuators.
- M&A Activity: xx deals during 2019-2024, with a projected xx deals during 2025-2033.
- Innovation Barriers: High R&D costs, stringent testing and certification requirements.
Military Actuators Industry Growth Trends & Insights
The military actuators market is projected to experience substantial growth, with a CAGR of xx% from 2025 to 2033. This growth is fueled by increasing defense budgets globally, modernization of existing military equipment, and the adoption of advanced technologies in new weapon systems. Technological disruptions, such as the integration of AI and IoT capabilities into actuators, are accelerating market adoption rates. Shifting consumer behavior towards sophisticated and reliable military hardware further contributes to market growth. Market penetration in specific regions and applications is expected to increase significantly. The demand for advanced systems, especially in air and sea applications, is a key driver for the growth of the market. The increasing adoption of unmanned aerial vehicles (UAVs) and unmanned underwater vehicles (UUVs) is expected to boost the demand for miniaturized and highly reliable actuators.
Dominant Regions, Countries, or Segments in Military Actuators Industry
The North American region currently dominates the military actuators market, driven by high defense spending and technological advancements. However, the Asia-Pacific region is projected to witness the fastest growth during the forecast period due to increased military modernization efforts and rising defense budgets in countries like China and India. Within the segments, the electrical actuators segment is experiencing strong growth, fueled by advantages in precision, controllability, and reduced maintenance compared to hydraulic and pneumatic counterparts. The air applications segment holds a significant share and is expected to maintain this position, propelled by the expansion of UAV and missile systems.
Key Regional Drivers:
- North America: High defense spending, technological leadership.
- Asia-Pacific: Increased military modernization efforts, rising defense budgets.
- Europe: Steady defense investments, focus on technological upgrades.
Dominant Segments:
- Type: Electrical actuators are experiencing rapid growth.
- System: Electrical systems are gaining traction over hydraulic and pneumatic systems.
- Application: Air applications dominate the market, driven by UAV and missile growth.
Military Actuators Industry Product Landscape
Military actuators are undergoing significant advancements, incorporating features like improved precision, enhanced reliability, reduced weight, and increased durability. Miniaturization is a crucial trend, enabling integration into smaller and more sophisticated weapon systems. Unique selling propositions include advanced materials, sensor integration, and improved control algorithms. Technological advancements include the integration of smart technologies, allowing for real-time monitoring and predictive maintenance. These features enhance operational efficiency, reduce downtime, and improve overall system performance.
Key Drivers, Barriers & Challenges in Military Actuators Industry
Key Drivers:
- Increasing defense budgets worldwide.
- Modernization of military equipment.
- Growing adoption of advanced technologies in military systems.
- Demand for enhanced precision and reliability.
Challenges and Restraints:
- High R&D costs associated with developing advanced actuators.
- Stringent regulatory requirements and certification processes.
- Supply chain disruptions impacting the availability of critical components.
- Intense competition among established and emerging players.
Emerging Opportunities in Military Actuators Industry
Emerging opportunities lie in the development of lightweight, highly efficient, and energy-saving actuators. The integration of AI and machine learning algorithms holds immense potential for autonomous and adaptive actuator systems. Untapped markets exist in emerging economies with increasing military spending. The adoption of advanced materials for enhanced performance and durability also presents significant opportunities.
Growth Accelerators in the Military Actuators Industry Industry
Long-term growth will be propelled by advancements in material science, leading to the development of lighter, stronger, and more reliable actuators. Strategic partnerships between actuator manufacturers and defense contractors will foster innovation and accelerate market penetration. The expansion into emerging markets and the adoption of innovative business models, such as leasing and service contracts, will drive growth further.
Key Players Shaping the Military Actuators Industry Market
- Raytheon Technologies Corporation
- AMETEK Inc
- Liebherr-International Deutschland GmbH
- Creative Motion Control
- Nook Industries Inc
- Woodward Inc
- Moog Inc
- Beaver Aerospace & Defense Inc
- Kyntronics
- Curtiss-Wright Corporation
- Triumph Group
- Parker Hannifin Corporation
- AUMA Riester GmbH & Co KG
- Cobham Limited
Notable Milestones in Military Actuators Industry Sector
- June 2021: Kyntronics joined the Rockwell Automation Technology Partner program, integrating its SMART Electro-Hydraulic Actuators.
- May 2021: Marotta Controls received full component-level qualification for its custom fin Control Actuation System (CAS) for Lockheed Martin, advancing to high-volume production.
In-Depth Military Actuators Industry Market Outlook
The future of the military actuators market is bright, with continuous advancements in technology promising enhanced performance, reliability, and efficiency. Strategic partnerships and investments in R&D will drive innovation, while expansion into emerging markets and the adoption of new business models will unlock significant growth potential. The market is poised for considerable expansion, fueled by sustained demand from military modernization efforts and the integration of sophisticated actuators into next-generation defense systems.
Military Actuators Industry Segmentation
- 1. Production Analysis
- 2. Consumption Analysis
- 3. Import Market Analysis (Value & Volume)
- 4. Export Market Analysis (Value & Volume)
- 5. Price Trend Analysis
Military Actuators Industry Segmentation By Geography
-
1. North America
- 1.1. United States
- 1.2. Canada
- 1.3. Mexico
-
2. South America
- 2.1. Brazil
- 2.2. Argentina
- 2.3. Rest of South America
-
3. Europe
- 3.1. United Kingdom
- 3.2. Germany
- 3.3. France
- 3.4. Italy
- 3.5. Spain
- 3.6. Russia
- 3.7. Benelux
- 3.8. Nordics
- 3.9. Rest of Europe
-
4. Middle East & Africa
- 4.1. Turkey
- 4.2. Israel
- 4.3. GCC
- 4.4. North Africa
- 4.5. South Africa
- 4.6. Rest of Middle East & Africa
-
5. Asia Pacific
- 5.1. China
- 5.2. India
- 5.3. Japan
- 5.4. South Korea
- 5.5. ASEAN
- 5.6. Oceania
- 5.7. Rest of Asia Pacific
Military Actuators Industry REPORT HIGHLIGHTS
| Aspects | Details |
|---|---|
| Study Period | 2019-2033 |
| Base Year | 2024 |
| Estimated Year | 2025 |
| Forecast Period | 2025-2033 |
| Historical Period | 2019-2024 |
| Growth Rate | CAGR of 3.14% from 2019-2033 |
| Segmentation |
|
Table of Contents
- 1. Introduction
- 1.1. Research Scope
- 1.2. Market Segmentation
- 1.3. Research Methodology
- 1.4. Definitions and Assumptions
- 2. Executive Summary
- 2.1. Introduction
- 3. Market Dynamics
- 3.1. Introduction
- 3.2. Market Drivers
- 3.2.1. ; Increasing Number Of Air Passengers; Use Of Portable Electronic Devices
- 3.3. Market Restrains
- 3.3.1. ; High Cost Of Connectivity Equipments
- 3.4. Market Trends
- 3.4.1. The Land Segment is Anticipated to Witness Highest Growth During the Forecast Period
- 4. Market Factor Analysis
- 4.1. Porters Five Forces
- 4.2. Supply/Value Chain
- 4.3. PESTEL analysis
- 4.4. Market Entropy
- 4.5. Patent/Trademark Analysis
- 5. Global Military Actuators Industry Analysis, Insights and Forecast, 2019-2031
- 5.1. Market Analysis, Insights and Forecast - by Production Analysis
- 5.2. Market Analysis, Insights and Forecast - by Consumption Analysis
- 5.3. Market Analysis, Insights and Forecast - by Import Market Analysis (Value & Volume)
- 5.4. Market Analysis, Insights and Forecast - by Export Market Analysis (Value & Volume)
- 5.5. Market Analysis, Insights and Forecast - by Price Trend Analysis
- 5.6. Market Analysis, Insights and Forecast - by Region
- 5.6.1. North America
- 5.6.2. South America
- 5.6.3. Europe
- 5.6.4. Middle East & Africa
- 5.6.5. Asia Pacific
- 5.1. Market Analysis, Insights and Forecast - by Production Analysis
- 6. North America Military Actuators Industry Analysis, Insights and Forecast, 2019-2031
- 6.1. Market Analysis, Insights and Forecast - by Production Analysis
- 6.2. Market Analysis, Insights and Forecast - by Consumption Analysis
- 6.3. Market Analysis, Insights and Forecast - by Import Market Analysis (Value & Volume)
- 6.4. Market Analysis, Insights and Forecast - by Export Market Analysis (Value & Volume)
- 6.5. Market Analysis, Insights and Forecast - by Price Trend Analysis
- 6.1. Market Analysis, Insights and Forecast - by Production Analysis
- 7. South America Military Actuators Industry Analysis, Insights and Forecast, 2019-2031
- 7.1. Market Analysis, Insights and Forecast - by Production Analysis
- 7.2. Market Analysis, Insights and Forecast - by Consumption Analysis
- 7.3. Market Analysis, Insights and Forecast - by Import Market Analysis (Value & Volume)
- 7.4. Market Analysis, Insights and Forecast - by Export Market Analysis (Value & Volume)
- 7.5. Market Analysis, Insights and Forecast - by Price Trend Analysis
- 7.1. Market Analysis, Insights and Forecast - by Production Analysis
- 8. Europe Military Actuators Industry Analysis, Insights and Forecast, 2019-2031
- 8.1. Market Analysis, Insights and Forecast - by Production Analysis
- 8.2. Market Analysis, Insights and Forecast - by Consumption Analysis
- 8.3. Market Analysis, Insights and Forecast - by Import Market Analysis (Value & Volume)
- 8.4. Market Analysis, Insights and Forecast - by Export Market Analysis (Value & Volume)
- 8.5. Market Analysis, Insights and Forecast - by Price Trend Analysis
- 8.1. Market Analysis, Insights and Forecast - by Production Analysis
- 9. Middle East & Africa Military Actuators Industry Analysis, Insights and Forecast, 2019-2031
- 9.1. Market Analysis, Insights and Forecast - by Production Analysis
- 9.2. Market Analysis, Insights and Forecast - by Consumption Analysis
- 9.3. Market Analysis, Insights and Forecast - by Import Market Analysis (Value & Volume)
- 9.4. Market Analysis, Insights and Forecast - by Export Market Analysis (Value & Volume)
- 9.5. Market Analysis, Insights and Forecast - by Price Trend Analysis
- 9.1. Market Analysis, Insights and Forecast - by Production Analysis
- 10. Asia Pacific Military Actuators Industry Analysis, Insights and Forecast, 2019-2031
- 10.1. Market Analysis, Insights and Forecast - by Production Analysis
- 10.2. Market Analysis, Insights and Forecast - by Consumption Analysis
- 10.3. Market Analysis, Insights and Forecast - by Import Market Analysis (Value & Volume)
- 10.4. Market Analysis, Insights and Forecast - by Export Market Analysis (Value & Volume)
- 10.5. Market Analysis, Insights and Forecast - by Price Trend Analysis
- 10.1. Market Analysis, Insights and Forecast - by Production Analysis
- 11. North America Military Actuators Industry Analysis, Insights and Forecast, 2019-2031
- 11.1. Market Analysis, Insights and Forecast - By Country/Sub-region
- 11.1.1 United States
- 11.1.2 Canada
- 12. Europe Military Actuators Industry Analysis, Insights and Forecast, 2019-2031
- 12.1. Market Analysis, Insights and Forecast - By Country/Sub-region
- 12.1.1 United Kingdom
- 12.1.2 Germany
- 12.1.3 France
- 12.1.4 Russia
- 12.1.5 Rest of Europe
- 13. Asia Pacific Military Actuators Industry Analysis, Insights and Forecast, 2019-2031
- 13.1. Market Analysis, Insights and Forecast - By Country/Sub-region
- 13.1.1 China
- 13.1.2 Japan
- 13.1.3 India
- 13.1.4 South Korea
- 13.1.5 Rest of Asia Pacific
- 14. Latin America Military Actuators Industry Analysis, Insights and Forecast, 2019-2031
- 14.1. Market Analysis, Insights and Forecast - By Country/Sub-region
- 14.1.1 Brazil
- 14.1.2 Rest of Latin America
- 15. Middle East and Africa Military Actuators Industry Analysis, Insights and Forecast, 2019-2031
- 15.1. Market Analysis, Insights and Forecast - By Country/Sub-region
- 15.1.1 United Arab Emirates
- 15.1.2 Saudi Arabia
- 15.1.3 Egypt
- 15.1.4 Turkey
- 15.1.5 Rest of Middle East and Africa
- 16. Competitive Analysis
- 16.1. Global Market Share Analysis 2024
- 16.2. Company Profiles
- 16.2.1 Raytheon Technologies Corporation
- 16.2.1.1. Overview
- 16.2.1.2. Products
- 16.2.1.3. SWOT Analysis
- 16.2.1.4. Recent Developments
- 16.2.1.5. Financials (Based on Availability)
- 16.2.2 AMETEK Inc
- 16.2.2.1. Overview
- 16.2.2.2. Products
- 16.2.2.3. SWOT Analysis
- 16.2.2.4. Recent Developments
- 16.2.2.5. Financials (Based on Availability)
- 16.2.3 Liebherr-International Deutschland GmbH
- 16.2.3.1. Overview
- 16.2.3.2. Products
- 16.2.3.3. SWOT Analysis
- 16.2.3.4. Recent Developments
- 16.2.3.5. Financials (Based on Availability)
- 16.2.4 Creative Motion Control
- 16.2.4.1. Overview
- 16.2.4.2. Products
- 16.2.4.3. SWOT Analysis
- 16.2.4.4. Recent Developments
- 16.2.4.5. Financials (Based on Availability)
- 16.2.5 Nook Industries Inc
- 16.2.5.1. Overview
- 16.2.5.2. Products
- 16.2.5.3. SWOT Analysis
- 16.2.5.4. Recent Developments
- 16.2.5.5. Financials (Based on Availability)
- 16.2.6 Woodward Inc
- 16.2.6.1. Overview
- 16.2.6.2. Products
- 16.2.6.3. SWOT Analysis
- 16.2.6.4. Recent Developments
- 16.2.6.5. Financials (Based on Availability)
- 16.2.7 Moog Inc
- 16.2.7.1. Overview
- 16.2.7.2. Products
- 16.2.7.3. SWOT Analysis
- 16.2.7.4. Recent Developments
- 16.2.7.5. Financials (Based on Availability)
- 16.2.8 Beaver Aerospace & Defense Inc
- 16.2.8.1. Overview
- 16.2.8.2. Products
- 16.2.8.3. SWOT Analysis
- 16.2.8.4. Recent Developments
- 16.2.8.5. Financials (Based on Availability)
- 16.2.9 Kyntronics
- 16.2.9.1. Overview
- 16.2.9.2. Products
- 16.2.9.3. SWOT Analysis
- 16.2.9.4. Recent Developments
- 16.2.9.5. Financials (Based on Availability)
- 16.2.10 Curtiss-Wright Corporation
- 16.2.10.1. Overview
- 16.2.10.2. Products
- 16.2.10.3. SWOT Analysis
- 16.2.10.4. Recent Developments
- 16.2.10.5. Financials (Based on Availability)
- 16.2.11 Triumph Group
- 16.2.11.1. Overview
- 16.2.11.2. Products
- 16.2.11.3. SWOT Analysis
- 16.2.11.4. Recent Developments
- 16.2.11.5. Financials (Based on Availability)
- 16.2.12 Parker Hannifin Corporation
- 16.2.12.1. Overview
- 16.2.12.2. Products
- 16.2.12.3. SWOT Analysis
- 16.2.12.4. Recent Developments
- 16.2.12.5. Financials (Based on Availability)
- 16.2.13 AUMA Riester GmbH & Co KG
- 16.2.13.1. Overview
- 16.2.13.2. Products
- 16.2.13.3. SWOT Analysis
- 16.2.13.4. Recent Developments
- 16.2.13.5. Financials (Based on Availability)
- 16.2.14 Cobham Limite
- 16.2.14.1. Overview
- 16.2.14.2. Products
- 16.2.14.3. SWOT Analysis
- 16.2.14.4. Recent Developments
- 16.2.14.5. Financials (Based on Availability)
- 16.2.1 Raytheon Technologies Corporation
List of Figures
- Figure 1: Global Military Actuators Industry Revenue Breakdown (Million, %) by Region 2024 & 2032
- Figure 2: North America Military Actuators Industry Revenue (Million), by Country 2024 & 2032
- Figure 3: North America Military Actuators Industry Revenue Share (%), by Country 2024 & 2032
- Figure 4: Europe Military Actuators Industry Revenue (Million), by Country 2024 & 2032
- Figure 5: Europe Military Actuators Industry Revenue Share (%), by Country 2024 & 2032
- Figure 6: Asia Pacific Military Actuators Industry Revenue (Million), by Country 2024 & 2032
- Figure 7: Asia Pacific Military Actuators Industry Revenue Share (%), by Country 2024 & 2032
- Figure 8: Latin America Military Actuators Industry Revenue (Million), by Country 2024 & 2032
- Figure 9: Latin America Military Actuators Industry Revenue Share (%), by Country 2024 & 2032
- Figure 10: Middle East and Africa Military Actuators Industry Revenue (Million), by Country 2024 & 2032
- Figure 11: Middle East and Africa Military Actuators Industry Revenue Share (%), by Country 2024 & 2032
- Figure 12: North America Military Actuators Industry Revenue (Million), by Production Analysis 2024 & 2032
- Figure 13: North America Military Actuators Industry Revenue Share (%), by Production Analysis 2024 & 2032
- Figure 14: North America Military Actuators Industry Revenue (Million), by Consumption Analysis 2024 & 2032
- Figure 15: North America Military Actuators Industry Revenue Share (%), by Consumption Analysis 2024 & 2032
- Figure 16: North America Military Actuators Industry Revenue (Million), by Import Market Analysis (Value & Volume) 2024 & 2032
- Figure 17: North America Military Actuators Industry Revenue Share (%), by Import Market Analysis (Value & Volume) 2024 & 2032
- Figure 18: North America Military Actuators Industry Revenue (Million), by Export Market Analysis (Value & Volume) 2024 & 2032
- Figure 19: North America Military Actuators Industry Revenue Share (%), by Export Market Analysis (Value & Volume) 2024 & 2032
- Figure 20: North America Military Actuators Industry Revenue (Million), by Price Trend Analysis 2024 & 2032
- Figure 21: North America Military Actuators Industry Revenue Share (%), by Price Trend Analysis 2024 & 2032
- Figure 22: North America Military Actuators Industry Revenue (Million), by Country 2024 & 2032
- Figure 23: North America Military Actuators Industry Revenue Share (%), by Country 2024 & 2032
- Figure 24: South America Military Actuators Industry Revenue (Million), by Production Analysis 2024 & 2032
- Figure 25: South America Military Actuators Industry Revenue Share (%), by Production Analysis 2024 & 2032
- Figure 26: South America Military Actuators Industry Revenue (Million), by Consumption Analysis 2024 & 2032
- Figure 27: South America Military Actuators Industry Revenue Share (%), by Consumption Analysis 2024 & 2032
- Figure 28: South America Military Actuators Industry Revenue (Million), by Import Market Analysis (Value & Volume) 2024 & 2032
- Figure 29: South America Military Actuators Industry Revenue Share (%), by Import Market Analysis (Value & Volume) 2024 & 2032
- Figure 30: South America Military Actuators Industry Revenue (Million), by Export Market Analysis (Value & Volume) 2024 & 2032
- Figure 31: South America Military Actuators Industry Revenue Share (%), by Export Market Analysis (Value & Volume) 2024 & 2032
- Figure 32: South America Military Actuators Industry Revenue (Million), by Price Trend Analysis 2024 & 2032
- Figure 33: South America Military Actuators Industry Revenue Share (%), by Price Trend Analysis 2024 & 2032
- Figure 34: South America Military Actuators Industry Revenue (Million), by Country 2024 & 2032
- Figure 35: South America Military Actuators Industry Revenue Share (%), by Country 2024 & 2032
- Figure 36: Europe Military Actuators Industry Revenue (Million), by Production Analysis 2024 & 2032
- Figure 37: Europe Military Actuators Industry Revenue Share (%), by Production Analysis 2024 & 2032
- Figure 38: Europe Military Actuators Industry Revenue (Million), by Consumption Analysis 2024 & 2032
- Figure 39: Europe Military Actuators Industry Revenue Share (%), by Consumption Analysis 2024 & 2032
- Figure 40: Europe Military Actuators Industry Revenue (Million), by Import Market Analysis (Value & Volume) 2024 & 2032
- Figure 41: Europe Military Actuators Industry Revenue Share (%), by Import Market Analysis (Value & Volume) 2024 & 2032
- Figure 42: Europe Military Actuators Industry Revenue (Million), by Export Market Analysis (Value & Volume) 2024 & 2032
- Figure 43: Europe Military Actuators Industry Revenue Share (%), by Export Market Analysis (Value & Volume) 2024 & 2032
- Figure 44: Europe Military Actuators Industry Revenue (Million), by Price Trend Analysis 2024 & 2032
- Figure 45: Europe Military Actuators Industry Revenue Share (%), by Price Trend Analysis 2024 & 2032
- Figure 46: Europe Military Actuators Industry Revenue (Million), by Country 2024 & 2032
- Figure 47: Europe Military Actuators Industry Revenue Share (%), by Country 2024 & 2032
- Figure 48: Middle East & Africa Military Actuators Industry Revenue (Million), by Production Analysis 2024 & 2032
- Figure 49: Middle East & Africa Military Actuators Industry Revenue Share (%), by Production Analysis 2024 & 2032
- Figure 50: Middle East & Africa Military Actuators Industry Revenue (Million), by Consumption Analysis 2024 & 2032
- Figure 51: Middle East & Africa Military Actuators Industry Revenue Share (%), by Consumption Analysis 2024 & 2032
- Figure 52: Middle East & Africa Military Actuators Industry Revenue (Million), by Import Market Analysis (Value & Volume) 2024 & 2032
- Figure 53: Middle East & Africa Military Actuators Industry Revenue Share (%), by Import Market Analysis (Value & Volume) 2024 & 2032
- Figure 54: Middle East & Africa Military Actuators Industry Revenue (Million), by Export Market Analysis (Value & Volume) 2024 & 2032
- Figure 55: Middle East & Africa Military Actuators Industry Revenue Share (%), by Export Market Analysis (Value & Volume) 2024 & 2032
- Figure 56: Middle East & Africa Military Actuators Industry Revenue (Million), by Price Trend Analysis 2024 & 2032
- Figure 57: Middle East & Africa Military Actuators Industry Revenue Share (%), by Price Trend Analysis 2024 & 2032
- Figure 58: Middle East & Africa Military Actuators Industry Revenue (Million), by Country 2024 & 2032
- Figure 59: Middle East & Africa Military Actuators Industry Revenue Share (%), by Country 2024 & 2032
- Figure 60: Asia Pacific Military Actuators Industry Revenue (Million), by Production Analysis 2024 & 2032
- Figure 61: Asia Pacific Military Actuators Industry Revenue Share (%), by Production Analysis 2024 & 2032
- Figure 62: Asia Pacific Military Actuators Industry Revenue (Million), by Consumption Analysis 2024 & 2032
- Figure 63: Asia Pacific Military Actuators Industry Revenue Share (%), by Consumption Analysis 2024 & 2032
- Figure 64: Asia Pacific Military Actuators Industry Revenue (Million), by Import Market Analysis (Value & Volume) 2024 & 2032
- Figure 65: Asia Pacific Military Actuators Industry Revenue Share (%), by Import Market Analysis (Value & Volume) 2024 & 2032
- Figure 66: Asia Pacific Military Actuators Industry Revenue (Million), by Export Market Analysis (Value & Volume) 2024 & 2032
- Figure 67: Asia Pacific Military Actuators Industry Revenue Share (%), by Export Market Analysis (Value & Volume) 2024 & 2032
- Figure 68: Asia Pacific Military Actuators Industry Revenue (Million), by Price Trend Analysis 2024 & 2032
- Figure 69: Asia Pacific Military Actuators Industry Revenue Share (%), by Price Trend Analysis 2024 & 2032
- Figure 70: Asia Pacific Military Actuators Industry Revenue (Million), by Country 2024 & 2032
- Figure 71: Asia Pacific Military Actuators Industry Revenue Share (%), by Country 2024 & 2032
List of Tables
- Table 1: Global Military Actuators Industry Revenue Million Forecast, by Region 2019 & 2032
- Table 2: Global Military Actuators Industry Revenue Million Forecast, by Production Analysis 2019 & 2032
- Table 3: Global Military Actuators Industry Revenue Million Forecast, by Consumption Analysis 2019 & 2032
- Table 4: Global Military Actuators Industry Revenue Million Forecast, by Import Market Analysis (Value & Volume) 2019 & 2032
- Table 5: Global Military Actuators Industry Revenue Million Forecast, by Export Market Analysis (Value & Volume) 2019 & 2032
- Table 6: Global Military Actuators Industry Revenue Million Forecast, by Price Trend Analysis 2019 & 2032
- Table 7: Global Military Actuators Industry Revenue Million Forecast, by Region 2019 & 2032
- Table 8: Global Military Actuators Industry Revenue Million Forecast, by Country 2019 & 2032
- Table 9: United States Military Actuators Industry Revenue (Million) Forecast, by Application 2019 & 2032
- Table 10: Canada Military Actuators Industry Revenue (Million) Forecast, by Application 2019 & 2032
- Table 11: Global Military Actuators Industry Revenue Million Forecast, by Country 2019 & 2032
- Table 12: United Kingdom Military Actuators Industry Revenue (Million) Forecast, by Application 2019 & 2032
- Table 13: Germany Military Actuators Industry Revenue (Million) Forecast, by Application 2019 & 2032
- Table 14: France Military Actuators Industry Revenue (Million) Forecast, by Application 2019 & 2032
- Table 15: Russia Military Actuators Industry Revenue (Million) Forecast, by Application 2019 & 2032
- Table 16: Rest of Europe Military Actuators Industry Revenue (Million) Forecast, by Application 2019 & 2032
- Table 17: Global Military Actuators Industry Revenue Million Forecast, by Country 2019 & 2032
- Table 18: China Military Actuators Industry Revenue (Million) Forecast, by Application 2019 & 2032
- Table 19: Japan Military Actuators Industry Revenue (Million) Forecast, by Application 2019 & 2032
- Table 20: India Military Actuators Industry Revenue (Million) Forecast, by Application 2019 & 2032
- Table 21: South Korea Military Actuators Industry Revenue (Million) Forecast, by Application 2019 & 2032
- Table 22: Rest of Asia Pacific Military Actuators Industry Revenue (Million) Forecast, by Application 2019 & 2032
- Table 23: Global Military Actuators Industry Revenue Million Forecast, by Country 2019 & 2032
- Table 24: Brazil Military Actuators Industry Revenue (Million) Forecast, by Application 2019 & 2032
- Table 25: Rest of Latin America Military Actuators Industry Revenue (Million) Forecast, by Application 2019 & 2032
- Table 26: Global Military Actuators Industry Revenue Million Forecast, by Country 2019 & 2032
- Table 27: United Arab Emirates Military Actuators Industry Revenue (Million) Forecast, by Application 2019 & 2032
- Table 28: Saudi Arabia Military Actuators Industry Revenue (Million) Forecast, by Application 2019 & 2032
- Table 29: Egypt Military Actuators Industry Revenue (Million) Forecast, by Application 2019 & 2032
- Table 30: Turkey Military Actuators Industry Revenue (Million) Forecast, by Application 2019 & 2032
- Table 31: Rest of Middle East and Africa Military Actuators Industry Revenue (Million) Forecast, by Application 2019 & 2032
- Table 32: Global Military Actuators Industry Revenue Million Forecast, by Production Analysis 2019 & 2032
- Table 33: Global Military Actuators Industry Revenue Million Forecast, by Consumption Analysis 2019 & 2032
- Table 34: Global Military Actuators Industry Revenue Million Forecast, by Import Market Analysis (Value & Volume) 2019 & 2032
- Table 35: Global Military Actuators Industry Revenue Million Forecast, by Export Market Analysis (Value & Volume) 2019 & 2032
- Table 36: Global Military Actuators Industry Revenue Million Forecast, by Price Trend Analysis 2019 & 2032
- Table 37: Global Military Actuators Industry Revenue Million Forecast, by Country 2019 & 2032
- Table 38: United States Military Actuators Industry Revenue (Million) Forecast, by Application 2019 & 2032
- Table 39: Canada Military Actuators Industry Revenue (Million) Forecast, by Application 2019 & 2032
- Table 40: Mexico Military Actuators Industry Revenue (Million) Forecast, by Application 2019 & 2032
- Table 41: Global Military Actuators Industry Revenue Million Forecast, by Production Analysis 2019 & 2032
- Table 42: Global Military Actuators Industry Revenue Million Forecast, by Consumption Analysis 2019 & 2032
- Table 43: Global Military Actuators Industry Revenue Million Forecast, by Import Market Analysis (Value & Volume) 2019 & 2032
- Table 44: Global Military Actuators Industry Revenue Million Forecast, by Export Market Analysis (Value & Volume) 2019 & 2032
- Table 45: Global Military Actuators Industry Revenue Million Forecast, by Price Trend Analysis 2019 & 2032
- Table 46: Global Military Actuators Industry Revenue Million Forecast, by Country 2019 & 2032
- Table 47: Brazil Military Actuators Industry Revenue (Million) Forecast, by Application 2019 & 2032
- Table 48: Argentina Military Actuators Industry Revenue (Million) Forecast, by Application 2019 & 2032
- Table 49: Rest of South America Military Actuators Industry Revenue (Million) Forecast, by Application 2019 & 2032
- Table 50: Global Military Actuators Industry Revenue Million Forecast, by Production Analysis 2019 & 2032
- Table 51: Global Military Actuators Industry Revenue Million Forecast, by Consumption Analysis 2019 & 2032
- Table 52: Global Military Actuators Industry Revenue Million Forecast, by Import Market Analysis (Value & Volume) 2019 & 2032
- Table 53: Global Military Actuators Industry Revenue Million Forecast, by Export Market Analysis (Value & Volume) 2019 & 2032
- Table 54: Global Military Actuators Industry Revenue Million Forecast, by Price Trend Analysis 2019 & 2032
- Table 55: Global Military Actuators Industry Revenue Million Forecast, by Country 2019 & 2032
- Table 56: United Kingdom Military Actuators Industry Revenue (Million) Forecast, by Application 2019 & 2032
- Table 57: Germany Military Actuators Industry Revenue (Million) Forecast, by Application 2019 & 2032
- Table 58: France Military Actuators Industry Revenue (Million) Forecast, by Application 2019 & 2032
- Table 59: Italy Military Actuators Industry Revenue (Million) Forecast, by Application 2019 & 2032
- Table 60: Spain Military Actuators Industry Revenue (Million) Forecast, by Application 2019 & 2032
- Table 61: Russia Military Actuators Industry Revenue (Million) Forecast, by Application 2019 & 2032
- Table 62: Benelux Military Actuators Industry Revenue (Million) Forecast, by Application 2019 & 2032
- Table 63: Nordics Military Actuators Industry Revenue (Million) Forecast, by Application 2019 & 2032
- Table 64: Rest of Europe Military Actuators Industry Revenue (Million) Forecast, by Application 2019 & 2032
- Table 65: Global Military Actuators Industry Revenue Million Forecast, by Production Analysis 2019 & 2032
- Table 66: Global Military Actuators Industry Revenue Million Forecast, by Consumption Analysis 2019 & 2032
- Table 67: Global Military Actuators Industry Revenue Million Forecast, by Import Market Analysis (Value & Volume) 2019 & 2032
- Table 68: Global Military Actuators Industry Revenue Million Forecast, by Export Market Analysis (Value & Volume) 2019 & 2032
- Table 69: Global Military Actuators Industry Revenue Million Forecast, by Price Trend Analysis 2019 & 2032
- Table 70: Global Military Actuators Industry Revenue Million Forecast, by Country 2019 & 2032
- Table 71: Turkey Military Actuators Industry Revenue (Million) Forecast, by Application 2019 & 2032
- Table 72: Israel Military Actuators Industry Revenue (Million) Forecast, by Application 2019 & 2032
- Table 73: GCC Military Actuators Industry Revenue (Million) Forecast, by Application 2019 & 2032
- Table 74: North Africa Military Actuators Industry Revenue (Million) Forecast, by Application 2019 & 2032
- Table 75: South Africa Military Actuators Industry Revenue (Million) Forecast, by Application 2019 & 2032
- Table 76: Rest of Middle East & Africa Military Actuators Industry Revenue (Million) Forecast, by Application 2019 & 2032
- Table 77: Global Military Actuators Industry Revenue Million Forecast, by Production Analysis 2019 & 2032
- Table 78: Global Military Actuators Industry Revenue Million Forecast, by Consumption Analysis 2019 & 2032
- Table 79: Global Military Actuators Industry Revenue Million Forecast, by Import Market Analysis (Value & Volume) 2019 & 2032
- Table 80: Global Military Actuators Industry Revenue Million Forecast, by Export Market Analysis (Value & Volume) 2019 & 2032
- Table 81: Global Military Actuators Industry Revenue Million Forecast, by Price Trend Analysis 2019 & 2032
- Table 82: Global Military Actuators Industry Revenue Million Forecast, by Country 2019 & 2032
- Table 83: China Military Actuators Industry Revenue (Million) Forecast, by Application 2019 & 2032
- Table 84: India Military Actuators Industry Revenue (Million) Forecast, by Application 2019 & 2032
- Table 85: Japan Military Actuators Industry Revenue (Million) Forecast, by Application 2019 & 2032
- Table 86: South Korea Military Actuators Industry Revenue (Million) Forecast, by Application 2019 & 2032
- Table 87: ASEAN Military Actuators Industry Revenue (Million) Forecast, by Application 2019 & 2032
- Table 88: Oceania Military Actuators Industry Revenue (Million) Forecast, by Application 2019 & 2032
- Table 89: Rest of Asia Pacific Military Actuators Industry Revenue (Million) Forecast, by Application 2019 & 2032
Frequently Asked Questions
1. What is the projected Compound Annual Growth Rate (CAGR) of the Military Actuators Industry?
The projected CAGR is approximately 3.14%.
2. Which companies are prominent players in the Military Actuators Industry?
Key companies in the market include Raytheon Technologies Corporation, AMETEK Inc, Liebherr-International Deutschland GmbH, Creative Motion Control, Nook Industries Inc, Woodward Inc, Moog Inc, Beaver Aerospace & Defense Inc, Kyntronics, Curtiss-Wright Corporation, Triumph Group, Parker Hannifin Corporation, AUMA Riester GmbH & Co KG, Cobham Limite.
3. What are the main segments of the Military Actuators Industry?
The market segments include Production Analysis, Consumption Analysis, Import Market Analysis (Value & Volume), Export Market Analysis (Value & Volume), Price Trend Analysis.
4. Can you provide details about the market size?
The market size is estimated to be USD XX Million as of 2022.
5. What are some drivers contributing to market growth?
; Increasing Number Of Air Passengers; Use Of Portable Electronic Devices.
6. What are the notable trends driving market growth?
The Land Segment is Anticipated to Witness Highest Growth During the Forecast Period.
7. Are there any restraints impacting market growth?
; High Cost Of Connectivity Equipments.
8. Can you provide examples of recent developments in the market?
In June 2021, Kytronics announced that the company joined the Rockwell Automation Technology Partner program, under which the company's SMART Electro-Hydraulic Actuators will be integrated into the program with Rockwell Automation servo motors, drives, and controls.
9. What pricing options are available for accessing the report?
Pricing options include single-user, multi-user, and enterprise licenses priced at USD 4750, USD 5250, and USD 8750 respectively.
10. Is the market size provided in terms of value or volume?
The market size is provided in terms of value, measured in Million.
11. Are there any specific market keywords associated with the report?
Yes, the market keyword associated with the report is "Military Actuators Industry," which aids in identifying and referencing the specific market segment covered.
12. How do I determine which pricing option suits my needs best?
The pricing options vary based on user requirements and access needs. Individual users may opt for single-user licenses, while businesses requiring broader access may choose multi-user or enterprise licenses for cost-effective access to the report.
13. Are there any additional resources or data provided in the Military Actuators Industry report?
While the report offers comprehensive insights, it's advisable to review the specific contents or supplementary materials provided to ascertain if additional resources or data are available.
14. How can I stay updated on further developments or reports in the Military Actuators Industry?
To stay informed about further developments, trends, and reports in the Military Actuators Industry, consider subscribing to industry newsletters, following relevant companies and organizations, or regularly checking reputable industry news sources and publications.
Methodology
Step 1 - Identification of Relevant Samples Size from Population Database


Step 2 - Approaches for Defining Global Market Size (Value, Volume* & Price*)

Note*: In applicable scenarios
Step 3 - Data Sources
Primary Research
- Web Analytics
- Survey Reports
- Research Institute
- Latest Research Reports
- Opinion Leaders
Secondary Research
- Annual Reports
- White Paper
- Latest Press Release
- Industry Association
- Paid Database
- Investor Presentations

Step 4 - Data Triangulation
Involves using different sources of information in order to increase the validity of a study
These sources are likely to be stakeholders in a program - participants, other researchers, program staff, other community members, and so on.
Then we put all data in single framework & apply various statistical tools to find out the dynamic on the market.
During the analysis stage, feedback from the stakeholder groups would be compared to determine areas of agreement as well as areas of divergence
