

Key Insights
The military connectors market is experiencing robust growth, driven by increasing defense budgets globally and the escalating demand for advanced military technologies. The market's expansion is fueled by several key factors: the modernization of existing military hardware, the development of next-generation defense systems (including unmanned aerial vehicles and advanced weaponry), and the rising adoption of sophisticated communication and data transmission systems in military applications. The market is segmented by connector type (circular, rectangular, etc.), application (aerospace, ground vehicles, naval), and material (plastic, metal). Competition is intense, with major players like Amphenol Socapex, TE Connectivity, and Fischer Connectors vying for market share through technological innovation, strategic partnerships, and acquisitions. Technological advancements such as miniaturization, improved durability, and enhanced performance are key drivers shaping market trends. While the market faces restraints like stringent regulatory compliance and the inherent volatility of government spending, the overall outlook remains positive, with continued growth projected throughout the forecast period. The focus is shifting toward lightweight, high-performance connectors capable of withstanding extreme environmental conditions and electromagnetic interference (EMI).
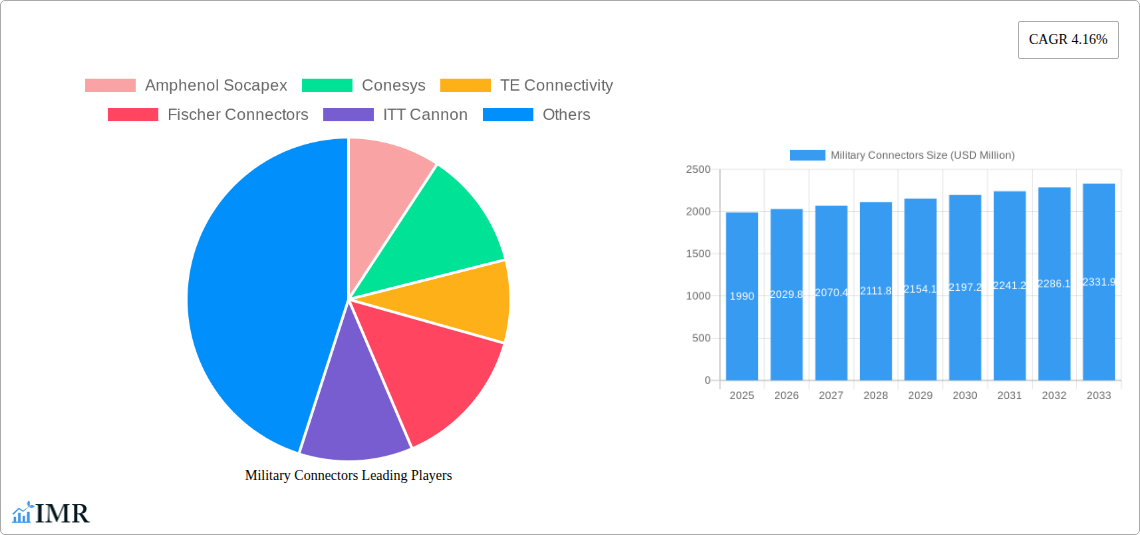
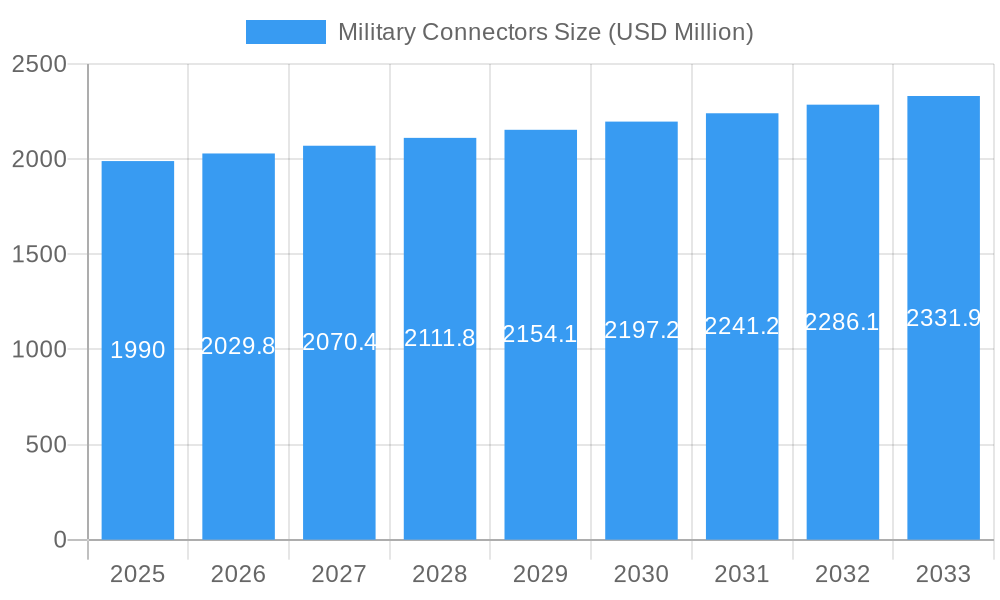
Military Connectors Market Size (In Billion)
The projected Compound Annual Growth Rate (CAGR) and market size necessitate a strategic approach for companies in this sector. Successful players will need to demonstrate expertise in providing ruggedized, reliable solutions tailored to specific military applications. Moreover, successful navigation of the regulatory landscape, maintaining robust supply chains, and investing in research and development to meet evolving technological requirements will be crucial for achieving sustained growth and profitability within this dynamic market. Regional variations exist, with North America and Europe likely to maintain significant market shares due to high defense spending and a strong presence of established manufacturers. However, emerging economies in Asia-Pacific and the Middle East are also anticipated to demonstrate considerable growth in the coming years.
Military Connectors Company Market Share
This comprehensive report provides an in-depth analysis of the Military Connectors market, encompassing market dynamics, growth trends, regional dominance, product landscape, key players, and future outlook. The study period spans from 2019 to 2033, with 2025 serving as the base and estimated year. The report offers invaluable insights for industry professionals, investors, and strategic decision-makers seeking to understand and capitalize on opportunities within this crucial sector. The market size is projected to reach xx million units by 2033.
Military Connectors Market Dynamics & Structure
The Military Connectors market is characterized by a moderately concentrated landscape, with key players such as Amphenol Socapex, TE Connectivity, and ITT Cannon holding significant market share. Technological innovation, driven by the demand for miniaturization, enhanced durability, and improved signal integrity, is a major growth driver. Stringent regulatory frameworks, particularly concerning safety and performance standards, shape market dynamics. Competition from alternative interconnect technologies and the emergence of substitutes presents a challenge. The market is largely driven by defense budgets and military modernization programs, making it susceptible to geopolitical shifts. The historical period (2019-2024) witnessed several M&A activities, with xx deals valued at approximately xx million USD.
- Market Concentration: Moderately concentrated, with top 5 players holding approximately xx% market share in 2025.
- Technological Innovation: Focus on miniaturization, high-speed data transmission, and enhanced environmental resilience.
- Regulatory Landscape: Stringent standards and certifications (e.g., MIL-STD) impacting product development and compliance.
- Competitive Substitutes: Growing competition from fiber optic and wireless technologies.
- M&A Activity: xx deals during 2019-2024, indicating consolidation and strategic expansion.
- End-User Demographics: Primarily driven by defense forces, aerospace, and naval sectors.
Military Connectors Growth Trends & Insights
The Military Connectors market experienced a CAGR of xx% during the historical period (2019-2024), reaching xx million units in 2025. This growth is attributed to increasing defense spending globally, technological advancements leading to higher adoption rates in modern military platforms, and the growing demand for ruggedized and reliable connectors in harsh environments. Technological disruptions, such as the integration of advanced materials and the adoption of smart connectors, are further fueling market expansion. Consumer behavior shifts toward prioritizing performance and reliability are also significantly impacting growth. The forecast period (2025-2033) projects a CAGR of xx%, driven by continued technological innovation and rising global military expenditure. Market penetration is expected to reach xx% by 2033. Detailed analysis utilizing XXX methodology shows a positive correlation between technological advancement and market growth.
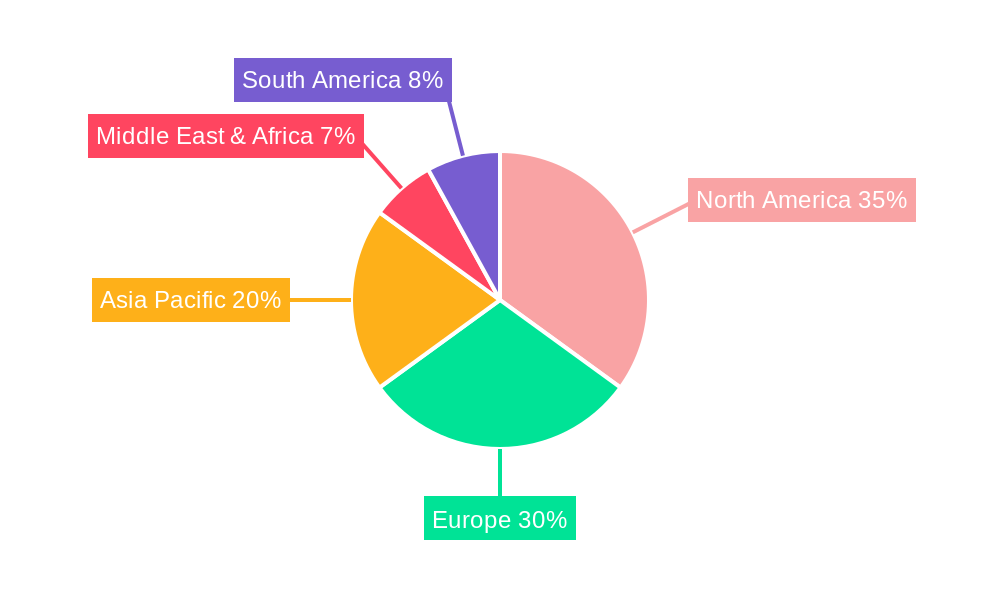
Dominant Regions, Countries, or Segments in Military Connectors
North America currently holds the dominant position in the Military Connectors market, driven by high defense spending and a strong presence of major manufacturers. Europe and Asia-Pacific follow closely, exhibiting significant growth potential due to increasing military modernization efforts and rising defense budgets in several countries. The aerospace and defense segment is the primary driver, followed by naval and land systems applications.
- North America: High defense spending, established manufacturing base, technological advancements.
- Europe: Significant military modernization programs, strong presence of defense contractors.
- Asia-Pacific: Increasing defense budgets, growing demand from emerging economies.
- Aerospace & Defense: Highest market share, driven by demand for sophisticated connectors in advanced aircraft and weapons systems.
- Naval Systems: Strong growth due to investments in naval modernization and fleet expansion.
Military Connectors Product Landscape
Military connectors encompass a range of products, from circular connectors to rectangular connectors, fiber optic connectors, and specialized connectors for specific applications. Innovation focuses on miniaturization, improved signal integrity, enhanced durability, and the integration of smart technologies, such as built-in diagnostics and self-healing capabilities. Unique selling propositions include extreme environmental resilience, shock and vibration resistance, and high-reliability performance. Recent technological advancements have resulted in lighter, smaller, and more efficient connectors.
Key Drivers, Barriers & Challenges in Military Connectors
Key Drivers:
- Increasing defense budgets globally.
- Technological advancements (miniaturization, high-speed data transmission).
- Growing demand for ruggedized and reliable connectors in harsh environments.
- Military modernization programs.
Key Barriers & Challenges:
- Stringent regulatory requirements and certification processes.
- Supply chain disruptions and material cost volatility (xx% impact on production costs in 2024).
- Intense competition from established players and new entrants.
- The high cost of R&D and product development.
Emerging Opportunities in Military Connectors
- Growing adoption of advanced materials (e.g., composites, nanomaterials) for enhanced performance and durability.
- Integration of smart technologies (e.g., embedded sensors, self-diagnostics).
- Development of connectors for next-generation military platforms (e.g., autonomous vehicles, unmanned aerial systems).
- Expansion into emerging markets with growing defense budgets.
Growth Accelerators in the Military Connectors Industry
Strategic partnerships between manufacturers and defense contractors are facilitating technology transfer and fostering innovation. Technological breakthroughs in materials science and electronics are leading to improved connector performance and miniaturization. Government initiatives to promote domestic manufacturing and technological self-reliance are also contributing to market growth. Market expansion into new applications, particularly in emerging technologies, offers significant growth potential.
Key Players Shaping the Military Connectors Market
- Amphenol Socapex
- Conesys
- TE Connectivity
- Fischer Connectors
- ITT Cannon
- Eaton
- Smiths Interconnect
- Glenair
- ODU
- Weald Electronics
- Molex
- Turck
- Rojone
- Ray Service
- Koehlke
- Allied Electronics
- Ept
- ALFA’R
- Omnetics Connector
Notable Milestones in Military Connectors Sector
- 2020: Introduction of a new generation of high-speed, miniaturized connectors by TE Connectivity.
- 2021: Acquisition of a smaller connector manufacturer by Amphenol Socapex.
- 2022: Development of a new environmentally sealed connector technology by Fischer Connectors.
- 2023: Launch of a ruggedized connector series with improved EMI shielding by ITT Cannon.
- 2024: Significant investment in R&D for advanced materials by Smiths Interconnect.
In-Depth Military Connectors Market Outlook
The Military Connectors market is poised for continued growth, driven by sustained investment in military modernization, technological innovation, and expansion into new applications. Strategic partnerships, focused R&D, and the adoption of advanced materials will shape the market landscape. The potential for growth in emerging markets and the integration of smart technologies present significant opportunities for key players and new entrants. The market is expected to experience healthy growth, with xx million units projected by 2033, reflecting strong demand and continuous technological advancement.
Military Connectors Segmentation
-
1. Application
- 1.1. Army
- 1.2. Navy
- 1.3. Air Force
- 1.4. Marines
-
2. Type
- 2.1. Circular Connectors
- 2.2. Rectangular Connectors
- 2.3. Fiber Optic Connectors
Military Connectors Segmentation By Geography
-
1. North America
- 1.1. United States
- 1.2. Canada
- 1.3. Mexico
-
2. South America
- 2.1. Brazil
- 2.2. Argentina
- 2.3. Rest of South America
-
3. Europe
- 3.1. United Kingdom
- 3.2. Germany
- 3.3. France
- 3.4. Italy
- 3.5. Spain
- 3.6. Russia
- 3.7. Benelux
- 3.8. Nordics
- 3.9. Rest of Europe
-
4. Middle East & Africa
- 4.1. Turkey
- 4.2. Israel
- 4.3. GCC
- 4.4. North Africa
- 4.5. South Africa
- 4.6. Rest of Middle East & Africa
-
5. Asia Pacific
- 5.1. China
- 5.2. India
- 5.3. Japan
- 5.4. South Korea
- 5.5. ASEAN
- 5.6. Oceania
- 5.7. Rest of Asia Pacific
Military Connectors Regional Market Share
Geographic Coverage of Military Connectors
Military Connectors REPORT HIGHLIGHTS
| Aspects | Details |
|---|---|
| Study Period | 2020-2034 |
| Base Year | 2025 |
| Estimated Year | 2026 |
| Forecast Period | 2026-2034 |
| Historical Period | 2020-2025 |
| Growth Rate | CAGR of 2% from 2020-2034 |
| Segmentation |
|
Table of Contents
- 1. Introduction
- 1.1. Research Scope
- 1.2. Market Segmentation
- 1.3. Research Objective
- 1.4. Definitions and Assumptions
- 2. Executive Summary
- 2.1. Market Snapshot
- 3. Market Dynamics
- 3.1. Market Drivers
- 3.2. Market Restrains
- 3.3. Market Trends
- 3.4. Market Opportunities
- 4. Market Factor Analysis
- 4.1. Porters Five Forces
- 4.1.1. Bargaining Power of Suppliers
- 4.1.2. Bargaining Power of Buyers
- 4.1.3. Threat of New Entrants
- 4.1.4. Threat of Substitutes
- 4.1.5. Competitive Rivalry
- 4.2. PESTEL analysis
- 4.3. BCG Analysis
- 4.3.1. Stars (High Growth, High Market Share)
- 4.3.2. Cash Cows (Low Growth, High Market Share)
- 4.3.3. Question Mark (High Growth, Low Market Share)
- 4.3.4. Dogs (Low Growth, Low Market Share)
- 4.4. Ansoff Matrix Analysis
- 4.5. Supply Chain Analysis
- 4.6. Regulatory Landscape
- 4.7. Current Market Potential and Opportunity Assessment (TAM–SAM–SOM Framework)
- 4.8. IMR Analyst Note
- 4.1. Porters Five Forces
- 5. Market Analysis, Insights and Forecast 2021-2033
- 5.1. Market Analysis, Insights and Forecast - by Application
- 5.1.1. Army
- 5.1.2. Navy
- 5.1.3. Air Force
- 5.1.4. Marines
- 5.2. Market Analysis, Insights and Forecast - by Type
- 5.2.1. Circular Connectors
- 5.2.2. Rectangular Connectors
- 5.2.3. Fiber Optic Connectors
- 5.3. Market Analysis, Insights and Forecast - by Region
- 5.3.1. North America
- 5.3.2. South America
- 5.3.3. Europe
- 5.3.4. Middle East & Africa
- 5.3.5. Asia Pacific
- 5.1. Market Analysis, Insights and Forecast - by Application
- 6. Global Military Connectors Analysis, Insights and Forecast, 2021-2033
- 6.1. Market Analysis, Insights and Forecast - by Application
- 6.1.1. Army
- 6.1.2. Navy
- 6.1.3. Air Force
- 6.1.4. Marines
- 6.2. Market Analysis, Insights and Forecast - by Type
- 6.2.1. Circular Connectors
- 6.2.2. Rectangular Connectors
- 6.2.3. Fiber Optic Connectors
- 6.1. Market Analysis, Insights and Forecast - by Application
- 7. North America Military Connectors Analysis, Insights and Forecast, 2020-2032
- 7.1. Market Analysis, Insights and Forecast - by Application
- 7.1.1. Army
- 7.1.2. Navy
- 7.1.3. Air Force
- 7.1.4. Marines
- 7.2. Market Analysis, Insights and Forecast - by Type
- 7.2.1. Circular Connectors
- 7.2.2. Rectangular Connectors
- 7.2.3. Fiber Optic Connectors
- 7.1. Market Analysis, Insights and Forecast - by Application
- 8. South America Military Connectors Analysis, Insights and Forecast, 2020-2032
- 8.1. Market Analysis, Insights and Forecast - by Application
- 8.1.1. Army
- 8.1.2. Navy
- 8.1.3. Air Force
- 8.1.4. Marines
- 8.2. Market Analysis, Insights and Forecast - by Type
- 8.2.1. Circular Connectors
- 8.2.2. Rectangular Connectors
- 8.2.3. Fiber Optic Connectors
- 8.1. Market Analysis, Insights and Forecast - by Application
- 9. Europe Military Connectors Analysis, Insights and Forecast, 2020-2032
- 9.1. Market Analysis, Insights and Forecast - by Application
- 9.1.1. Army
- 9.1.2. Navy
- 9.1.3. Air Force
- 9.1.4. Marines
- 9.2. Market Analysis, Insights and Forecast - by Type
- 9.2.1. Circular Connectors
- 9.2.2. Rectangular Connectors
- 9.2.3. Fiber Optic Connectors
- 9.1. Market Analysis, Insights and Forecast - by Application
- 10. Middle East & Africa Military Connectors Analysis, Insights and Forecast, 2020-2032
- 10.1. Market Analysis, Insights and Forecast - by Application
- 10.1.1. Army
- 10.1.2. Navy
- 10.1.3. Air Force
- 10.1.4. Marines
- 10.2. Market Analysis, Insights and Forecast - by Type
- 10.2.1. Circular Connectors
- 10.2.2. Rectangular Connectors
- 10.2.3. Fiber Optic Connectors
- 10.1. Market Analysis, Insights and Forecast - by Application
- 11. Asia Pacific Military Connectors Analysis, Insights and Forecast, 2020-2032
- 11.1. Market Analysis, Insights and Forecast - by Application
- 11.1.1. Army
- 11.1.2. Navy
- 11.1.3. Air Force
- 11.1.4. Marines
- 11.2. Market Analysis, Insights and Forecast - by Type
- 11.2.1. Circular Connectors
- 11.2.2. Rectangular Connectors
- 11.2.3. Fiber Optic Connectors
- 11.1. Market Analysis, Insights and Forecast - by Application
- 12. Competitive Analysis
- 12.1. Company Profiles
- 12.1.1 Amphenol Socapex
- 12.1.1.1. Company Overview
- 12.1.1.2. Products
- 12.1.1.3. Company Financials
- 12.1.1.4. SWOT Analysis
- 12.1.2 Conesys
- 12.1.2.1. Company Overview
- 12.1.2.2. Products
- 12.1.2.3. Company Financials
- 12.1.2.4. SWOT Analysis
- 12.1.3 TE Connectivity
- 12.1.3.1. Company Overview
- 12.1.3.2. Products
- 12.1.3.3. Company Financials
- 12.1.3.4. SWOT Analysis
- 12.1.4 Fischer Connectors
- 12.1.4.1. Company Overview
- 12.1.4.2. Products
- 12.1.4.3. Company Financials
- 12.1.4.4. SWOT Analysis
- 12.1.5 ITT Cannon
- 12.1.5.1. Company Overview
- 12.1.5.2. Products
- 12.1.5.3. Company Financials
- 12.1.5.4. SWOT Analysis
- 12.1.6 Eaton
- 12.1.6.1. Company Overview
- 12.1.6.2. Products
- 12.1.6.3. Company Financials
- 12.1.6.4. SWOT Analysis
- 12.1.7 Smiths Interconnect
- 12.1.7.1. Company Overview
- 12.1.7.2. Products
- 12.1.7.3. Company Financials
- 12.1.7.4. SWOT Analysis
- 12.1.8 Glenair
- 12.1.8.1. Company Overview
- 12.1.8.2. Products
- 12.1.8.3. Company Financials
- 12.1.8.4. SWOT Analysis
- 12.1.9 ODU
- 12.1.9.1. Company Overview
- 12.1.9.2. Products
- 12.1.9.3. Company Financials
- 12.1.9.4. SWOT Analysis
- 12.1.10 Weald Electronics
- 12.1.10.1. Company Overview
- 12.1.10.2. Products
- 12.1.10.3. Company Financials
- 12.1.10.4. SWOT Analysis
- 12.1.11 Molex
- 12.1.11.1. Company Overview
- 12.1.11.2. Products
- 12.1.11.3. Company Financials
- 12.1.11.4. SWOT Analysis
- 12.1.12 Turck
- 12.1.12.1. Company Overview
- 12.1.12.2. Products
- 12.1.12.3. Company Financials
- 12.1.12.4. SWOT Analysis
- 12.1.13 Rojone
- 12.1.13.1. Company Overview
- 12.1.13.2. Products
- 12.1.13.3. Company Financials
- 12.1.13.4. SWOT Analysis
- 12.1.14 Ray Service
- 12.1.14.1. Company Overview
- 12.1.14.2. Products
- 12.1.14.3. Company Financials
- 12.1.14.4. SWOT Analysis
- 12.1.15 Koehlke
- 12.1.15.1. Company Overview
- 12.1.15.2. Products
- 12.1.15.3. Company Financials
- 12.1.15.4. SWOT Analysis
- 12.1.16 Allied Electronics
- 12.1.16.1. Company Overview
- 12.1.16.2. Products
- 12.1.16.3. Company Financials
- 12.1.16.4. SWOT Analysis
- 12.1.17 Ept
- 12.1.17.1. Company Overview
- 12.1.17.2. Products
- 12.1.17.3. Company Financials
- 12.1.17.4. SWOT Analysis
- 12.1.18 ALFA’R
- 12.1.18.1. Company Overview
- 12.1.18.2. Products
- 12.1.18.3. Company Financials
- 12.1.18.4. SWOT Analysis
- 12.1.19 Omnetics Connector
- 12.1.19.1. Company Overview
- 12.1.19.2. Products
- 12.1.19.3. Company Financials
- 12.1.19.4. SWOT Analysis
- 12.1.1 Amphenol Socapex
- 12.2. Market Entropy
- 12.2.1 Company's Key Areas Served
- 12.2.2 Recent Developments
- 12.3. Company Market Share Analysis 2025
- 12.3.1 Top 5 Companies Market Share Analysis
- 12.3.2 Top 3 Companies Market Share Analysis
- 12.4. List of Potential Customers
- 13. Research Methodology
List of Figures
- Figure 1: Global Military Connectors Revenue Breakdown (undefined, %) by Region 2025 & 2033
- Figure 2: North America Military Connectors Revenue (undefined), by Application 2025 & 2033
- Figure 3: North America Military Connectors Revenue Share (%), by Application 2025 & 2033
- Figure 4: North America Military Connectors Revenue (undefined), by Type 2025 & 2033
- Figure 5: North America Military Connectors Revenue Share (%), by Type 2025 & 2033
- Figure 6: North America Military Connectors Revenue (undefined), by Country 2025 & 2033
- Figure 7: North America Military Connectors Revenue Share (%), by Country 2025 & 2033
- Figure 8: South America Military Connectors Revenue (undefined), by Application 2025 & 2033
- Figure 9: South America Military Connectors Revenue Share (%), by Application 2025 & 2033
- Figure 10: South America Military Connectors Revenue (undefined), by Type 2025 & 2033
- Figure 11: South America Military Connectors Revenue Share (%), by Type 2025 & 2033
- Figure 12: South America Military Connectors Revenue (undefined), by Country 2025 & 2033
- Figure 13: South America Military Connectors Revenue Share (%), by Country 2025 & 2033
- Figure 14: Europe Military Connectors Revenue (undefined), by Application 2025 & 2033
- Figure 15: Europe Military Connectors Revenue Share (%), by Application 2025 & 2033
- Figure 16: Europe Military Connectors Revenue (undefined), by Type 2025 & 2033
- Figure 17: Europe Military Connectors Revenue Share (%), by Type 2025 & 2033
- Figure 18: Europe Military Connectors Revenue (undefined), by Country 2025 & 2033
- Figure 19: Europe Military Connectors Revenue Share (%), by Country 2025 & 2033
- Figure 20: Middle East & Africa Military Connectors Revenue (undefined), by Application 2025 & 2033
- Figure 21: Middle East & Africa Military Connectors Revenue Share (%), by Application 2025 & 2033
- Figure 22: Middle East & Africa Military Connectors Revenue (undefined), by Type 2025 & 2033
- Figure 23: Middle East & Africa Military Connectors Revenue Share (%), by Type 2025 & 2033
- Figure 24: Middle East & Africa Military Connectors Revenue (undefined), by Country 2025 & 2033
- Figure 25: Middle East & Africa Military Connectors Revenue Share (%), by Country 2025 & 2033
- Figure 26: Asia Pacific Military Connectors Revenue (undefined), by Application 2025 & 2033
- Figure 27: Asia Pacific Military Connectors Revenue Share (%), by Application 2025 & 2033
- Figure 28: Asia Pacific Military Connectors Revenue (undefined), by Type 2025 & 2033
- Figure 29: Asia Pacific Military Connectors Revenue Share (%), by Type 2025 & 2033
- Figure 30: Asia Pacific Military Connectors Revenue (undefined), by Country 2025 & 2033
- Figure 31: Asia Pacific Military Connectors Revenue Share (%), by Country 2025 & 2033
List of Tables
- Table 1: Global Military Connectors Revenue undefined Forecast, by Application 2020 & 2033
- Table 2: Global Military Connectors Revenue undefined Forecast, by Type 2020 & 2033
- Table 3: Global Military Connectors Revenue undefined Forecast, by Region 2020 & 2033
- Table 4: Global Military Connectors Revenue undefined Forecast, by Application 2020 & 2033
- Table 5: Global Military Connectors Revenue undefined Forecast, by Type 2020 & 2033
- Table 6: Global Military Connectors Revenue undefined Forecast, by Country 2020 & 2033
- Table 7: United States Military Connectors Revenue (undefined) Forecast, by Application 2020 & 2033
- Table 8: Canada Military Connectors Revenue (undefined) Forecast, by Application 2020 & 2033
- Table 9: Mexico Military Connectors Revenue (undefined) Forecast, by Application 2020 & 2033
- Table 10: Global Military Connectors Revenue undefined Forecast, by Application 2020 & 2033
- Table 11: Global Military Connectors Revenue undefined Forecast, by Type 2020 & 2033
- Table 12: Global Military Connectors Revenue undefined Forecast, by Country 2020 & 2033
- Table 13: Brazil Military Connectors Revenue (undefined) Forecast, by Application 2020 & 2033
- Table 14: Argentina Military Connectors Revenue (undefined) Forecast, by Application 2020 & 2033
- Table 15: Rest of South America Military Connectors Revenue (undefined) Forecast, by Application 2020 & 2033
- Table 16: Global Military Connectors Revenue undefined Forecast, by Application 2020 & 2033
- Table 17: Global Military Connectors Revenue undefined Forecast, by Type 2020 & 2033
- Table 18: Global Military Connectors Revenue undefined Forecast, by Country 2020 & 2033
- Table 19: United Kingdom Military Connectors Revenue (undefined) Forecast, by Application 2020 & 2033
- Table 20: Germany Military Connectors Revenue (undefined) Forecast, by Application 2020 & 2033
- Table 21: France Military Connectors Revenue (undefined) Forecast, by Application 2020 & 2033
- Table 22: Italy Military Connectors Revenue (undefined) Forecast, by Application 2020 & 2033
- Table 23: Spain Military Connectors Revenue (undefined) Forecast, by Application 2020 & 2033
- Table 24: Russia Military Connectors Revenue (undefined) Forecast, by Application 2020 & 2033
- Table 25: Benelux Military Connectors Revenue (undefined) Forecast, by Application 2020 & 2033
- Table 26: Nordics Military Connectors Revenue (undefined) Forecast, by Application 2020 & 2033
- Table 27: Rest of Europe Military Connectors Revenue (undefined) Forecast, by Application 2020 & 2033
- Table 28: Global Military Connectors Revenue undefined Forecast, by Application 2020 & 2033
- Table 29: Global Military Connectors Revenue undefined Forecast, by Type 2020 & 2033
- Table 30: Global Military Connectors Revenue undefined Forecast, by Country 2020 & 2033
- Table 31: Turkey Military Connectors Revenue (undefined) Forecast, by Application 2020 & 2033
- Table 32: Israel Military Connectors Revenue (undefined) Forecast, by Application 2020 & 2033
- Table 33: GCC Military Connectors Revenue (undefined) Forecast, by Application 2020 & 2033
- Table 34: North Africa Military Connectors Revenue (undefined) Forecast, by Application 2020 & 2033
- Table 35: South Africa Military Connectors Revenue (undefined) Forecast, by Application 2020 & 2033
- Table 36: Rest of Middle East & Africa Military Connectors Revenue (undefined) Forecast, by Application 2020 & 2033
- Table 37: Global Military Connectors Revenue undefined Forecast, by Application 2020 & 2033
- Table 38: Global Military Connectors Revenue undefined Forecast, by Type 2020 & 2033
- Table 39: Global Military Connectors Revenue undefined Forecast, by Country 2020 & 2033
- Table 40: China Military Connectors Revenue (undefined) Forecast, by Application 2020 & 2033
- Table 41: India Military Connectors Revenue (undefined) Forecast, by Application 2020 & 2033
- Table 42: Japan Military Connectors Revenue (undefined) Forecast, by Application 2020 & 2033
- Table 43: South Korea Military Connectors Revenue (undefined) Forecast, by Application 2020 & 2033
- Table 44: ASEAN Military Connectors Revenue (undefined) Forecast, by Application 2020 & 2033
- Table 45: Oceania Military Connectors Revenue (undefined) Forecast, by Application 2020 & 2033
- Table 46: Rest of Asia Pacific Military Connectors Revenue (undefined) Forecast, by Application 2020 & 2033
Frequently Asked Questions
1. What is the projected Compound Annual Growth Rate (CAGR) of the Military Connectors?
The projected CAGR is approximately 2%.
2. Which companies are prominent players in the Military Connectors?
Key companies in the market include Amphenol Socapex, Conesys, TE Connectivity, Fischer Connectors, ITT Cannon, Eaton, Smiths Interconnect, Glenair, ODU, Weald Electronics, Molex, Turck, Rojone, Ray Service, Koehlke, Allied Electronics, Ept, ALFA’R, Omnetics Connector.
3. What are the main segments of the Military Connectors?
The market segments include Application, Type.
4. Can you provide details about the market size?
The market size is estimated to be USD XXX N/A as of 2022.
5. What are some drivers contributing to market growth?
N/A
6. What are the notable trends driving market growth?
N/A
7. Are there any restraints impacting market growth?
N/A
8. Can you provide examples of recent developments in the market?
N/A
9. What pricing options are available for accessing the report?
Pricing options include single-user, multi-user, and enterprise licenses priced at USD 2900.00, USD 4350.00, and USD 5800.00 respectively.
10. Is the market size provided in terms of value or volume?
The market size is provided in terms of value, measured in N/A.
11. Are there any specific market keywords associated with the report?
Yes, the market keyword associated with the report is "Military Connectors," which aids in identifying and referencing the specific market segment covered.
12. How do I determine which pricing option suits my needs best?
The pricing options vary based on user requirements and access needs. Individual users may opt for single-user licenses, while businesses requiring broader access may choose multi-user or enterprise licenses for cost-effective access to the report.
13. Are there any additional resources or data provided in the Military Connectors report?
While the report offers comprehensive insights, it's advisable to review the specific contents or supplementary materials provided to ascertain if additional resources or data are available.
14. How can I stay updated on further developments or reports in the Military Connectors?
To stay informed about further developments, trends, and reports in the Military Connectors, consider subscribing to industry newsletters, following relevant companies and organizations, or regularly checking reputable industry news sources and publications.
Methodology
Step 1 - Identification of Relevant Samples Size from Population Database


Step 2 - Approaches for Defining Global Market Size (Value, Volume* & Price*)

Note*: In applicable scenarios
Step 3 - Data Sources
Primary Research
- Web Analytics
- Survey Reports
- Research Institute
- Latest Research Reports
- Opinion Leaders
Secondary Research
- Annual Reports
- White Paper
- Latest Press Release
- Industry Association
- Paid Database
- Investor Presentations

Step 4 - Data Triangulation
Involves using different sources of information in order to increase the validity of a study
These sources are likely to be stakeholders in a program - participants, other researchers, program staff, other community members, and so on.
Then we put all data in single framework & apply various statistical tools to find out the dynamic on the market.
During the analysis stage, feedback from the stakeholder groups would be compared to determine areas of agreement as well as areas of divergence