

Key Insights
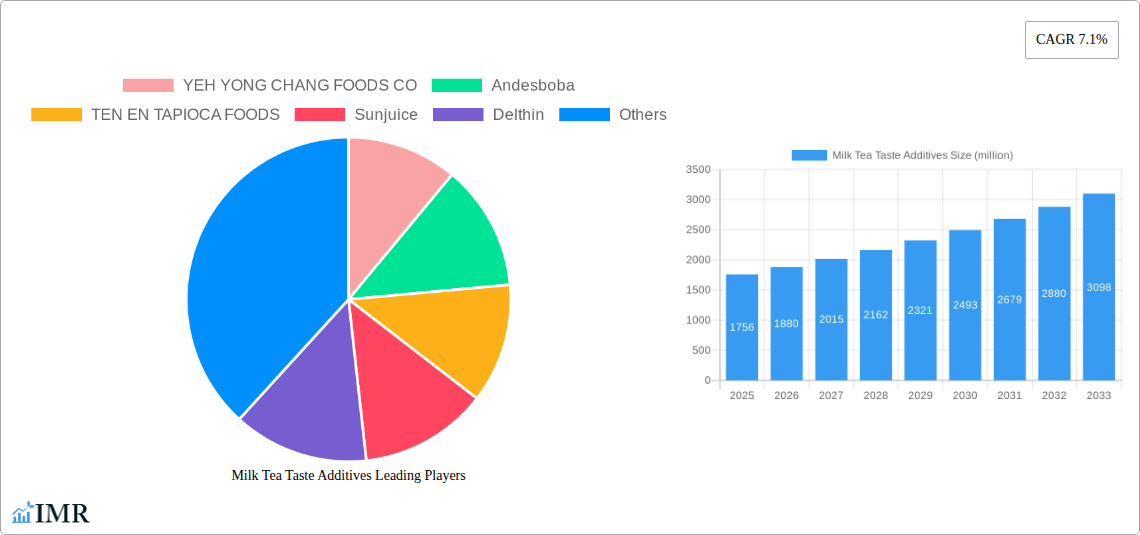
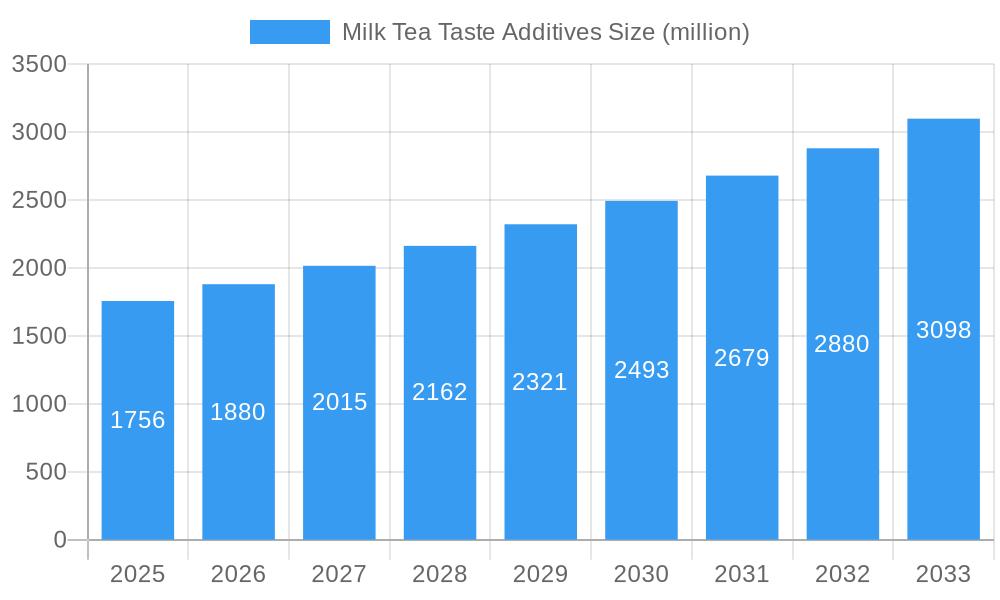
The global milk tea taste additives market, valued at $1756 million in 2025, is projected to experience robust growth, driven by the escalating popularity of milk tea and the increasing demand for diverse flavor profiles. The Compound Annual Growth Rate (CAGR) of 7.1% from 2019 to 2033 indicates a significant expansion opportunity. This growth is fueled by several key factors. Firstly, the rising disposable incomes in developing economies, particularly in Asia, are boosting consumer spending on beverages, including premium milk teas. Secondly, the innovative introduction of new and exciting flavors, catering to evolving consumer preferences, is a significant market driver. This includes the use of natural and organic ingredients to meet the growing health-conscious consumer segment. Furthermore, the expanding food service industry, including cafes, tea shops, and restaurants, provides significant distribution channels for these additives. However, potential market restraints include fluctuating raw material prices and the emergence of substitute beverages.
Milk Tea Taste Additives Market Size (In Billion)
Competition within the market is intense, with key players like Yeh Yong Chang Foods Co, Andesboba, and Ten En Tapioca Foods vying for market share through product diversification and strategic partnerships. The market is segmented by product type (e.g., powders, liquids, syrups), flavor profile (e.g., fruit, caramel, chocolate), and distribution channel (e.g., direct sales, wholesale). Regional variations in consumer preferences and market maturity influence market growth, with Asia-Pacific expected to dominate due to high milk tea consumption rates. Strategic collaborations, technological advancements in flavor creation, and targeted marketing efforts towards specific demographics are expected to shape the future of this dynamic market. The forecast period (2025-2033) presents significant growth potential for businesses that can adapt to changing consumer trends and maintain innovative product offerings.
Milk Tea Taste Additives Company Market Share
Milk Tea Taste Additives Market Report: 2019-2033
This comprehensive report provides an in-depth analysis of the Milk Tea Taste Additives market, encompassing historical data (2019-2024), current estimates (2025), and future projections (2025-2033). The report segments the market by key players (YEH YONG CHANG FOODS CO, Andesboba, TEN EN TAPIOCA FOODS, Sunjuice, Delthin, HUASANG, WUXI BAISIWEI FOOD INDUSTRY, Hubei Homeyard Food, Leading Food Group, D.CO INTERNATIONAL FOOD, BOYBIO, DOKING) and explores the dynamics shaping this rapidly evolving industry. This report is crucial for industry professionals, investors, and anyone seeking to understand the growth trajectory of the milk tea and beverage additive market. This report caters to both the parent market (beverage additives) and child market (milk tea additives) providing holistic insights.
Milk Tea Taste Additives Market Dynamics & Structure
The Milk Tea Taste Additives market is characterized by moderate concentration, with a few major players holding significant market share, estimated at 60% in 2025. Technological innovation, particularly in flavor profiles and natural ingredient sourcing, is a key driver. Stringent regulatory frameworks concerning food safety and labeling influence product development and market entry. Competitive substitutes, such as fruit purees and syrups, exert pressure on market share. The end-user demographics are primarily young adults and millennials with a preference for customizable and aesthetically pleasing beverages. M&A activity remains moderate, with an estimated xx million-unit deal volume in the historical period, suggesting consolidation opportunities.
- Market Concentration: 60% controlled by top players in 2025.
- Technological Innovation: Focus on natural, healthier options and unique flavor profiles.
- Regulatory Framework: Stringent food safety and labeling regulations.
- Competitive Substitutes: Fruit purees, syrups, and other flavoring agents.
- End-User Demographics: Predominantly young adults (18-35 years).
- M&A Activity: xx million-unit deal volume (2019-2024), indicating potential consolidation.
- Innovation Barriers: High R&D costs and regulatory compliance requirements.
Milk Tea Taste Additives Growth Trends & Insights
The Milk Tea Taste Additives market has experienced robust growth over the historical period (2019-2024), with a CAGR of xx%. This growth is attributed to the increasing popularity of milk tea, fueled by consumer demand for diverse flavors and customized beverages. Market penetration is high in major Asian markets, with increasing adoption in Western regions. Technological disruptions, such as the introduction of innovative flavor delivery systems and advanced processing techniques, are enhancing product quality and efficiency. Consumer behavior shifts towards healthier options and natural ingredients are also impacting market trends. The estimated market size in 2025 is xx million units, projected to reach xx million units by 2033, with a forecast CAGR of xx%.
Dominant Regions, Countries, or Segments in Milk Tea Taste Additives
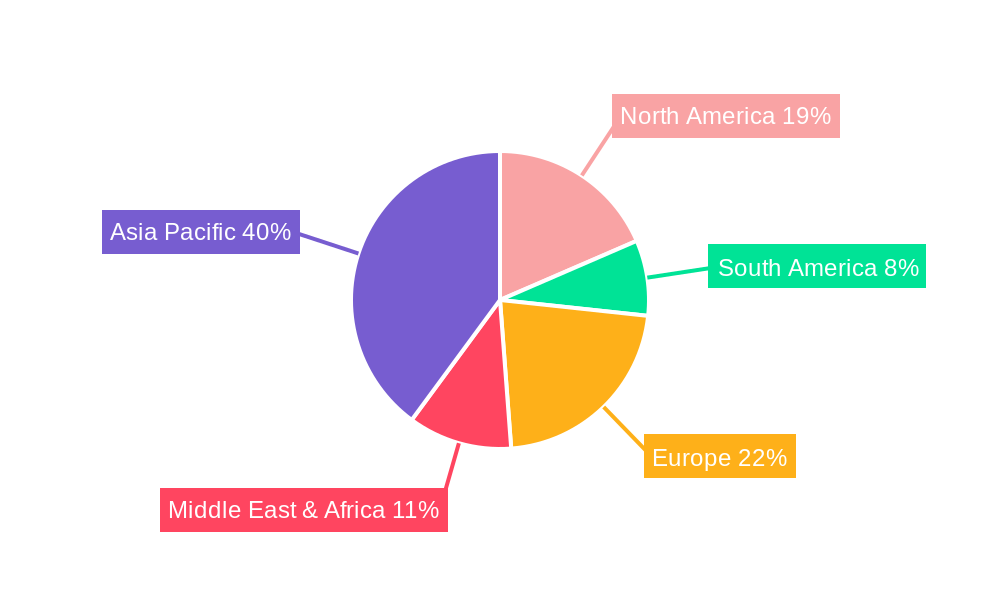
Asia, particularly China and Taiwan, dominates the Milk Tea Taste Additives market, holding approximately 75% of the global market share in 2025. This dominance is driven by the high per capita consumption of milk tea, strong economic growth, and well-established supply chains. Other regions, including North America and Europe, exhibit significant growth potential due to rising milk tea popularity and increasing consumer disposable incomes.
- Key Drivers in Asia: High milk tea consumption, robust economic growth, and established supply chains.
- Growth Potential in North America & Europe: Rising milk tea popularity and increasing consumer disposable incomes.
- Market Share (2025): Asia (75%), North America (15%), Europe (10%).
Milk Tea Taste Additives Product Landscape
The product landscape is diverse, encompassing a wide range of flavors, formats (powder, liquid concentrates), and ingredient types (natural, artificial). Innovation focuses on natural and organic options, unique flavor combinations, and convenient packaging. Key selling propositions include enhanced flavor profiles, ease of use, and cost-effectiveness. Technological advancements are improving flavor stability, shelf life, and overall product quality.
Key Drivers, Barriers & Challenges in Milk Tea Taste Additives
Key Drivers: Rising milk tea consumption, increasing demand for customized beverages, and technological advancements in flavor creation.
Challenges: Fluctuations in raw material prices, stringent regulatory compliance, and intense competition from existing and new market entrants. Supply chain disruptions can cause significant price volatility and impact production. Estimated loss in revenue due to supply chain issues in 2024 was xx million units.
Emerging Opportunities in Milk Tea Taste Additives
Emerging opportunities lie in expanding into untapped markets in Africa and South America, developing innovative flavors tailored to local preferences, and catering to the growing demand for healthy and functional beverages. Plant-based milk tea additives and personalized flavor blends are significant areas for future growth.
Growth Accelerators in the Milk Tea Taste Additives Industry
Strategic partnerships between flavor manufacturers and beverage companies, coupled with investments in R&D and sustainable sourcing practices, are vital growth catalysts. Technological advancements, such as AI-driven flavor development and personalized flavor creation, will further accelerate market expansion.
Key Players Shaping the Milk Tea Taste Additives Market
- YEH YONG CHANG FOODS CO
- Andesboba
- TEN EN TAPIOCA FOODS
- Sunjuice
- Delthin
- HUASANG
- WUXI BAISIWEI FOOD INDUSTRY
- Hubei Homeyard Food
- Leading Food Group
- D.CO INTERNATIONAL FOOD
- BOYBIO
- DOKING
Notable Milestones in Milk Tea Taste Additives Sector
- 2020: Introduction of a new line of natural fruit-based additives by WUXI BAISIWEI FOOD INDUSTRY.
- 2021: Partnership between YEH YONG CHANG FOODS CO and a major beverage company to develop customized flavor profiles.
- 2022: Regulatory changes impacting labeling requirements for artificial sweeteners in several key markets.
- 2023: Launch of a plant-based milk tea additive line by BOYBIO.
In-Depth Milk Tea Taste Additives Market Outlook
The Milk Tea Taste Additives market is poised for continued growth, driven by evolving consumer preferences and technological innovations. Opportunities exist in developing novel flavors, catering to health-conscious consumers, and expanding into new geographical markets. Strategic partnerships and R&D investments will play a crucial role in shaping the future of this dynamic industry. The market is expected to reach xx million units by 2033, presenting significant opportunities for both established players and new entrants.
Milk Tea Taste Additives Segmentation
-
1. Application
- 1.1. Wholesale
- 1.2. Retail
-
2. Type
- 2.1. Tapioca Balls
- 2.2. Jelly Topings
- 2.3. Cereal
- 2.4. Agar Jelly Ball
- 2.5. Others
Milk Tea Taste Additives Segmentation By Geography
-
1. North America
- 1.1. United States
- 1.2. Canada
- 1.3. Mexico
-
2. South America
- 2.1. Brazil
- 2.2. Argentina
- 2.3. Rest of South America
-
3. Europe
- 3.1. United Kingdom
- 3.2. Germany
- 3.3. France
- 3.4. Italy
- 3.5. Spain
- 3.6. Russia
- 3.7. Benelux
- 3.8. Nordics
- 3.9. Rest of Europe
-
4. Middle East & Africa
- 4.1. Turkey
- 4.2. Israel
- 4.3. GCC
- 4.4. North Africa
- 4.5. South Africa
- 4.6. Rest of Middle East & Africa
-
5. Asia Pacific
- 5.1. China
- 5.2. India
- 5.3. Japan
- 5.4. South Korea
- 5.5. ASEAN
- 5.6. Oceania
- 5.7. Rest of Asia Pacific
Milk Tea Taste Additives Regional Market Share
Geographic Coverage of Milk Tea Taste Additives
Milk Tea Taste Additives REPORT HIGHLIGHTS
| Aspects | Details |
|---|---|
| Study Period | 2020-2034 |
| Base Year | 2025 |
| Estimated Year | 2026 |
| Forecast Period | 2026-2034 |
| Historical Period | 2020-2025 |
| Growth Rate | CAGR of 7.1% from 2020-2034 |
| Segmentation |
|
Table of Contents
- 1. Introduction
- 1.1. Research Scope
- 1.2. Market Segmentation
- 1.3. Research Objective
- 1.4. Definitions and Assumptions
- 2. Executive Summary
- 2.1. Market Snapshot
- 3. Market Dynamics
- 3.1. Market Drivers
- 3.2. Market Restrains
- 3.3. Market Trends
- 3.4. Market Opportunities
- 4. Market Factor Analysis
- 4.1. Porters Five Forces
- 4.1.1. Bargaining Power of Suppliers
- 4.1.2. Bargaining Power of Buyers
- 4.1.3. Threat of New Entrants
- 4.1.4. Threat of Substitutes
- 4.1.5. Competitive Rivalry
- 4.2. PESTEL analysis
- 4.3. BCG Analysis
- 4.3.1. Stars (High Growth, High Market Share)
- 4.3.2. Cash Cows (Low Growth, High Market Share)
- 4.3.3. Question Mark (High Growth, Low Market Share)
- 4.3.4. Dogs (Low Growth, Low Market Share)
- 4.4. Ansoff Matrix Analysis
- 4.5. Supply Chain Analysis
- 4.6. Regulatory Landscape
- 4.7. Current Market Potential and Opportunity Assessment (TAM–SAM–SOM Framework)
- 4.8. IMR Analyst Note
- 4.1. Porters Five Forces
- 5. Market Analysis, Insights and Forecast 2021-2033
- 5.1. Market Analysis, Insights and Forecast - by Application
- 5.1.1. Wholesale
- 5.1.2. Retail
- 5.2. Market Analysis, Insights and Forecast - by Type
- 5.2.1. Tapioca Balls
- 5.2.2. Jelly Topings
- 5.2.3. Cereal
- 5.2.4. Agar Jelly Ball
- 5.2.5. Others
- 5.3. Market Analysis, Insights and Forecast - by Region
- 5.3.1. North America
- 5.3.2. South America
- 5.3.3. Europe
- 5.3.4. Middle East & Africa
- 5.3.5. Asia Pacific
- 5.1. Market Analysis, Insights and Forecast - by Application
- 6. Global Milk Tea Taste Additives Analysis, Insights and Forecast, 2021-2033
- 6.1. Market Analysis, Insights and Forecast - by Application
- 6.1.1. Wholesale
- 6.1.2. Retail
- 6.2. Market Analysis, Insights and Forecast - by Type
- 6.2.1. Tapioca Balls
- 6.2.2. Jelly Topings
- 6.2.3. Cereal
- 6.2.4. Agar Jelly Ball
- 6.2.5. Others
- 6.1. Market Analysis, Insights and Forecast - by Application
- 7. North America Milk Tea Taste Additives Analysis, Insights and Forecast, 2020-2032
- 7.1. Market Analysis, Insights and Forecast - by Application
- 7.1.1. Wholesale
- 7.1.2. Retail
- 7.2. Market Analysis, Insights and Forecast - by Type
- 7.2.1. Tapioca Balls
- 7.2.2. Jelly Topings
- 7.2.3. Cereal
- 7.2.4. Agar Jelly Ball
- 7.2.5. Others
- 7.1. Market Analysis, Insights and Forecast - by Application
- 8. South America Milk Tea Taste Additives Analysis, Insights and Forecast, 2020-2032
- 8.1. Market Analysis, Insights and Forecast - by Application
- 8.1.1. Wholesale
- 8.1.2. Retail
- 8.2. Market Analysis, Insights and Forecast - by Type
- 8.2.1. Tapioca Balls
- 8.2.2. Jelly Topings
- 8.2.3. Cereal
- 8.2.4. Agar Jelly Ball
- 8.2.5. Others
- 8.1. Market Analysis, Insights and Forecast - by Application
- 9. Europe Milk Tea Taste Additives Analysis, Insights and Forecast, 2020-2032
- 9.1. Market Analysis, Insights and Forecast - by Application
- 9.1.1. Wholesale
- 9.1.2. Retail
- 9.2. Market Analysis, Insights and Forecast - by Type
- 9.2.1. Tapioca Balls
- 9.2.2. Jelly Topings
- 9.2.3. Cereal
- 9.2.4. Agar Jelly Ball
- 9.2.5. Others
- 9.1. Market Analysis, Insights and Forecast - by Application
- 10. Middle East & Africa Milk Tea Taste Additives Analysis, Insights and Forecast, 2020-2032
- 10.1. Market Analysis, Insights and Forecast - by Application
- 10.1.1. Wholesale
- 10.1.2. Retail
- 10.2. Market Analysis, Insights and Forecast - by Type
- 10.2.1. Tapioca Balls
- 10.2.2. Jelly Topings
- 10.2.3. Cereal
- 10.2.4. Agar Jelly Ball
- 10.2.5. Others
- 10.1. Market Analysis, Insights and Forecast - by Application
- 11. Asia Pacific Milk Tea Taste Additives Analysis, Insights and Forecast, 2020-2032
- 11.1. Market Analysis, Insights and Forecast - by Application
- 11.1.1. Wholesale
- 11.1.2. Retail
- 11.2. Market Analysis, Insights and Forecast - by Type
- 11.2.1. Tapioca Balls
- 11.2.2. Jelly Topings
- 11.2.3. Cereal
- 11.2.4. Agar Jelly Ball
- 11.2.5. Others
- 11.1. Market Analysis, Insights and Forecast - by Application
- 12. Competitive Analysis
- 12.1. Company Profiles
- 12.1.1 YEH YONG CHANG FOODS CO
- 12.1.1.1. Company Overview
- 12.1.1.2. Products
- 12.1.1.3. Company Financials
- 12.1.1.4. SWOT Analysis
- 12.1.2 Andesboba
- 12.1.2.1. Company Overview
- 12.1.2.2. Products
- 12.1.2.3. Company Financials
- 12.1.2.4. SWOT Analysis
- 12.1.3 TEN EN TAPIOCA FOODS
- 12.1.3.1. Company Overview
- 12.1.3.2. Products
- 12.1.3.3. Company Financials
- 12.1.3.4. SWOT Analysis
- 12.1.4 Sunjuice
- 12.1.4.1. Company Overview
- 12.1.4.2. Products
- 12.1.4.3. Company Financials
- 12.1.4.4. SWOT Analysis
- 12.1.5 Delthin
- 12.1.5.1. Company Overview
- 12.1.5.2. Products
- 12.1.5.3. Company Financials
- 12.1.5.4. SWOT Analysis
- 12.1.6 HUASANG
- 12.1.6.1. Company Overview
- 12.1.6.2. Products
- 12.1.6.3. Company Financials
- 12.1.6.4. SWOT Analysis
- 12.1.7 WUXI BAISIWEI FOOD INDUSTRY
- 12.1.7.1. Company Overview
- 12.1.7.2. Products
- 12.1.7.3. Company Financials
- 12.1.7.4. SWOT Analysis
- 12.1.8 Hubei Homeyard Food
- 12.1.8.1. Company Overview
- 12.1.8.2. Products
- 12.1.8.3. Company Financials
- 12.1.8.4. SWOT Analysis
- 12.1.9 Leading Food Group
- 12.1.9.1. Company Overview
- 12.1.9.2. Products
- 12.1.9.3. Company Financials
- 12.1.9.4. SWOT Analysis
- 12.1.10 D.CO INTERNATIONAL FOOD
- 12.1.10.1. Company Overview
- 12.1.10.2. Products
- 12.1.10.3. Company Financials
- 12.1.10.4. SWOT Analysis
- 12.1.11 BOYBIO
- 12.1.11.1. Company Overview
- 12.1.11.2. Products
- 12.1.11.3. Company Financials
- 12.1.11.4. SWOT Analysis
- 12.1.12 DOKING
- 12.1.12.1. Company Overview
- 12.1.12.2. Products
- 12.1.12.3. Company Financials
- 12.1.12.4. SWOT Analysis
- 12.1.1 YEH YONG CHANG FOODS CO
- 12.2. Market Entropy
- 12.2.1 Company's Key Areas Served
- 12.2.2 Recent Developments
- 12.3. Company Market Share Analysis 2025
- 12.3.1 Top 5 Companies Market Share Analysis
- 12.3.2 Top 3 Companies Market Share Analysis
- 12.4. List of Potential Customers
- 13. Research Methodology
List of Figures
- Figure 1: Global Milk Tea Taste Additives Revenue Breakdown (undefined, %) by Region 2025 & 2033
- Figure 2: North America Milk Tea Taste Additives Revenue (undefined), by Application 2025 & 2033
- Figure 3: North America Milk Tea Taste Additives Revenue Share (%), by Application 2025 & 2033
- Figure 4: North America Milk Tea Taste Additives Revenue (undefined), by Type 2025 & 2033
- Figure 5: North America Milk Tea Taste Additives Revenue Share (%), by Type 2025 & 2033
- Figure 6: North America Milk Tea Taste Additives Revenue (undefined), by Country 2025 & 2033
- Figure 7: North America Milk Tea Taste Additives Revenue Share (%), by Country 2025 & 2033
- Figure 8: South America Milk Tea Taste Additives Revenue (undefined), by Application 2025 & 2033
- Figure 9: South America Milk Tea Taste Additives Revenue Share (%), by Application 2025 & 2033
- Figure 10: South America Milk Tea Taste Additives Revenue (undefined), by Type 2025 & 2033
- Figure 11: South America Milk Tea Taste Additives Revenue Share (%), by Type 2025 & 2033
- Figure 12: South America Milk Tea Taste Additives Revenue (undefined), by Country 2025 & 2033
- Figure 13: South America Milk Tea Taste Additives Revenue Share (%), by Country 2025 & 2033
- Figure 14: Europe Milk Tea Taste Additives Revenue (undefined), by Application 2025 & 2033
- Figure 15: Europe Milk Tea Taste Additives Revenue Share (%), by Application 2025 & 2033
- Figure 16: Europe Milk Tea Taste Additives Revenue (undefined), by Type 2025 & 2033
- Figure 17: Europe Milk Tea Taste Additives Revenue Share (%), by Type 2025 & 2033
- Figure 18: Europe Milk Tea Taste Additives Revenue (undefined), by Country 2025 & 2033
- Figure 19: Europe Milk Tea Taste Additives Revenue Share (%), by Country 2025 & 2033
- Figure 20: Middle East & Africa Milk Tea Taste Additives Revenue (undefined), by Application 2025 & 2033
- Figure 21: Middle East & Africa Milk Tea Taste Additives Revenue Share (%), by Application 2025 & 2033
- Figure 22: Middle East & Africa Milk Tea Taste Additives Revenue (undefined), by Type 2025 & 2033
- Figure 23: Middle East & Africa Milk Tea Taste Additives Revenue Share (%), by Type 2025 & 2033
- Figure 24: Middle East & Africa Milk Tea Taste Additives Revenue (undefined), by Country 2025 & 2033
- Figure 25: Middle East & Africa Milk Tea Taste Additives Revenue Share (%), by Country 2025 & 2033
- Figure 26: Asia Pacific Milk Tea Taste Additives Revenue (undefined), by Application 2025 & 2033
- Figure 27: Asia Pacific Milk Tea Taste Additives Revenue Share (%), by Application 2025 & 2033
- Figure 28: Asia Pacific Milk Tea Taste Additives Revenue (undefined), by Type 2025 & 2033
- Figure 29: Asia Pacific Milk Tea Taste Additives Revenue Share (%), by Type 2025 & 2033
- Figure 30: Asia Pacific Milk Tea Taste Additives Revenue (undefined), by Country 2025 & 2033
- Figure 31: Asia Pacific Milk Tea Taste Additives Revenue Share (%), by Country 2025 & 2033
List of Tables
- Table 1: Global Milk Tea Taste Additives Revenue undefined Forecast, by Application 2020 & 2033
- Table 2: Global Milk Tea Taste Additives Revenue undefined Forecast, by Type 2020 & 2033
- Table 3: Global Milk Tea Taste Additives Revenue undefined Forecast, by Region 2020 & 2033
- Table 4: Global Milk Tea Taste Additives Revenue undefined Forecast, by Application 2020 & 2033
- Table 5: Global Milk Tea Taste Additives Revenue undefined Forecast, by Type 2020 & 2033
- Table 6: Global Milk Tea Taste Additives Revenue undefined Forecast, by Country 2020 & 2033
- Table 7: United States Milk Tea Taste Additives Revenue (undefined) Forecast, by Application 2020 & 2033
- Table 8: Canada Milk Tea Taste Additives Revenue (undefined) Forecast, by Application 2020 & 2033
- Table 9: Mexico Milk Tea Taste Additives Revenue (undefined) Forecast, by Application 2020 & 2033
- Table 10: Global Milk Tea Taste Additives Revenue undefined Forecast, by Application 2020 & 2033
- Table 11: Global Milk Tea Taste Additives Revenue undefined Forecast, by Type 2020 & 2033
- Table 12: Global Milk Tea Taste Additives Revenue undefined Forecast, by Country 2020 & 2033
- Table 13: Brazil Milk Tea Taste Additives Revenue (undefined) Forecast, by Application 2020 & 2033
- Table 14: Argentina Milk Tea Taste Additives Revenue (undefined) Forecast, by Application 2020 & 2033
- Table 15: Rest of South America Milk Tea Taste Additives Revenue (undefined) Forecast, by Application 2020 & 2033
- Table 16: Global Milk Tea Taste Additives Revenue undefined Forecast, by Application 2020 & 2033
- Table 17: Global Milk Tea Taste Additives Revenue undefined Forecast, by Type 2020 & 2033
- Table 18: Global Milk Tea Taste Additives Revenue undefined Forecast, by Country 2020 & 2033
- Table 19: United Kingdom Milk Tea Taste Additives Revenue (undefined) Forecast, by Application 2020 & 2033
- Table 20: Germany Milk Tea Taste Additives Revenue (undefined) Forecast, by Application 2020 & 2033
- Table 21: France Milk Tea Taste Additives Revenue (undefined) Forecast, by Application 2020 & 2033
- Table 22: Italy Milk Tea Taste Additives Revenue (undefined) Forecast, by Application 2020 & 2033
- Table 23: Spain Milk Tea Taste Additives Revenue (undefined) Forecast, by Application 2020 & 2033
- Table 24: Russia Milk Tea Taste Additives Revenue (undefined) Forecast, by Application 2020 & 2033
- Table 25: Benelux Milk Tea Taste Additives Revenue (undefined) Forecast, by Application 2020 & 2033
- Table 26: Nordics Milk Tea Taste Additives Revenue (undefined) Forecast, by Application 2020 & 2033
- Table 27: Rest of Europe Milk Tea Taste Additives Revenue (undefined) Forecast, by Application 2020 & 2033
- Table 28: Global Milk Tea Taste Additives Revenue undefined Forecast, by Application 2020 & 2033
- Table 29: Global Milk Tea Taste Additives Revenue undefined Forecast, by Type 2020 & 2033
- Table 30: Global Milk Tea Taste Additives Revenue undefined Forecast, by Country 2020 & 2033
- Table 31: Turkey Milk Tea Taste Additives Revenue (undefined) Forecast, by Application 2020 & 2033
- Table 32: Israel Milk Tea Taste Additives Revenue (undefined) Forecast, by Application 2020 & 2033
- Table 33: GCC Milk Tea Taste Additives Revenue (undefined) Forecast, by Application 2020 & 2033
- Table 34: North Africa Milk Tea Taste Additives Revenue (undefined) Forecast, by Application 2020 & 2033
- Table 35: South Africa Milk Tea Taste Additives Revenue (undefined) Forecast, by Application 2020 & 2033
- Table 36: Rest of Middle East & Africa Milk Tea Taste Additives Revenue (undefined) Forecast, by Application 2020 & 2033
- Table 37: Global Milk Tea Taste Additives Revenue undefined Forecast, by Application 2020 & 2033
- Table 38: Global Milk Tea Taste Additives Revenue undefined Forecast, by Type 2020 & 2033
- Table 39: Global Milk Tea Taste Additives Revenue undefined Forecast, by Country 2020 & 2033
- Table 40: China Milk Tea Taste Additives Revenue (undefined) Forecast, by Application 2020 & 2033
- Table 41: India Milk Tea Taste Additives Revenue (undefined) Forecast, by Application 2020 & 2033
- Table 42: Japan Milk Tea Taste Additives Revenue (undefined) Forecast, by Application 2020 & 2033
- Table 43: South Korea Milk Tea Taste Additives Revenue (undefined) Forecast, by Application 2020 & 2033
- Table 44: ASEAN Milk Tea Taste Additives Revenue (undefined) Forecast, by Application 2020 & 2033
- Table 45: Oceania Milk Tea Taste Additives Revenue (undefined) Forecast, by Application 2020 & 2033
- Table 46: Rest of Asia Pacific Milk Tea Taste Additives Revenue (undefined) Forecast, by Application 2020 & 2033
Frequently Asked Questions
1. What is the projected Compound Annual Growth Rate (CAGR) of the Milk Tea Taste Additives?
The projected CAGR is approximately 7.1%.
2. Which companies are prominent players in the Milk Tea Taste Additives?
Key companies in the market include YEH YONG CHANG FOODS CO, Andesboba, TEN EN TAPIOCA FOODS, Sunjuice, Delthin, HUASANG, WUXI BAISIWEI FOOD INDUSTRY, Hubei Homeyard Food, Leading Food Group, D.CO INTERNATIONAL FOOD, BOYBIO, DOKING.
3. What are the main segments of the Milk Tea Taste Additives?
The market segments include Application, Type.
4. Can you provide details about the market size?
The market size is estimated to be USD XXX N/A as of 2022.
5. What are some drivers contributing to market growth?
N/A
6. What are the notable trends driving market growth?
N/A
7. Are there any restraints impacting market growth?
N/A
8. Can you provide examples of recent developments in the market?
N/A
9. What pricing options are available for accessing the report?
Pricing options include single-user, multi-user, and enterprise licenses priced at USD 2900.00, USD 4350.00, and USD 5800.00 respectively.
10. Is the market size provided in terms of value or volume?
The market size is provided in terms of value, measured in N/A.
11. Are there any specific market keywords associated with the report?
Yes, the market keyword associated with the report is "Milk Tea Taste Additives," which aids in identifying and referencing the specific market segment covered.
12. How do I determine which pricing option suits my needs best?
The pricing options vary based on user requirements and access needs. Individual users may opt for single-user licenses, while businesses requiring broader access may choose multi-user or enterprise licenses for cost-effective access to the report.
13. Are there any additional resources or data provided in the Milk Tea Taste Additives report?
While the report offers comprehensive insights, it's advisable to review the specific contents or supplementary materials provided to ascertain if additional resources or data are available.
14. How can I stay updated on further developments or reports in the Milk Tea Taste Additives?
To stay informed about further developments, trends, and reports in the Milk Tea Taste Additives, consider subscribing to industry newsletters, following relevant companies and organizations, or regularly checking reputable industry news sources and publications.
Methodology
Step 1 - Identification of Relevant Samples Size from Population Database


Step 2 - Approaches for Defining Global Market Size (Value, Volume* & Price*)

Note*: In applicable scenarios
Step 3 - Data Sources
Primary Research
- Web Analytics
- Survey Reports
- Research Institute
- Latest Research Reports
- Opinion Leaders
Secondary Research
- Annual Reports
- White Paper
- Latest Press Release
- Industry Association
- Paid Database
- Investor Presentations

Step 4 - Data Triangulation
Involves using different sources of information in order to increase the validity of a study
These sources are likely to be stakeholders in a program - participants, other researchers, program staff, other community members, and so on.
Then we put all data in single framework & apply various statistical tools to find out the dynamic on the market.
During the analysis stage, feedback from the stakeholder groups would be compared to determine areas of agreement as well as areas of divergence