

Key Insights
The MLCT Edible Oil market is poised for significant expansion, projected to reach an estimated market size of approximately $1.5 billion by 2025. This robust growth is underpinned by a projected Compound Annual Growth Rate (CAGR) of around 6.5% during the forecast period of 2025-2033. This upward trajectory is primarily fueled by increasing consumer awareness regarding the health benefits associated with specialized edible oils, such as improved digestion and enhanced nutrient absorption, which MLCT oils are known for. The rising disposable incomes in emerging economies, coupled with a growing preference for premium and health-conscious food products, are further accelerating market penetration. Furthermore, innovations in extraction and processing technologies are leading to higher quality and more diverse MLCT edible oil offerings, catering to evolving consumer demands for both taste and wellness. The burgeoning online retail sector is also playing a crucial role, providing wider accessibility and convenience for consumers to discover and purchase these specialized oils.
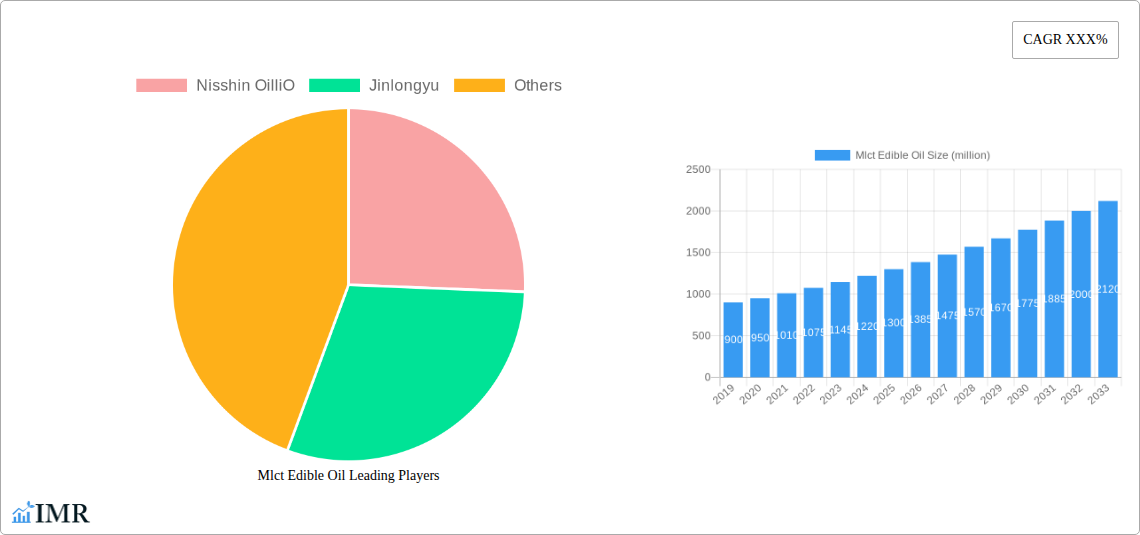
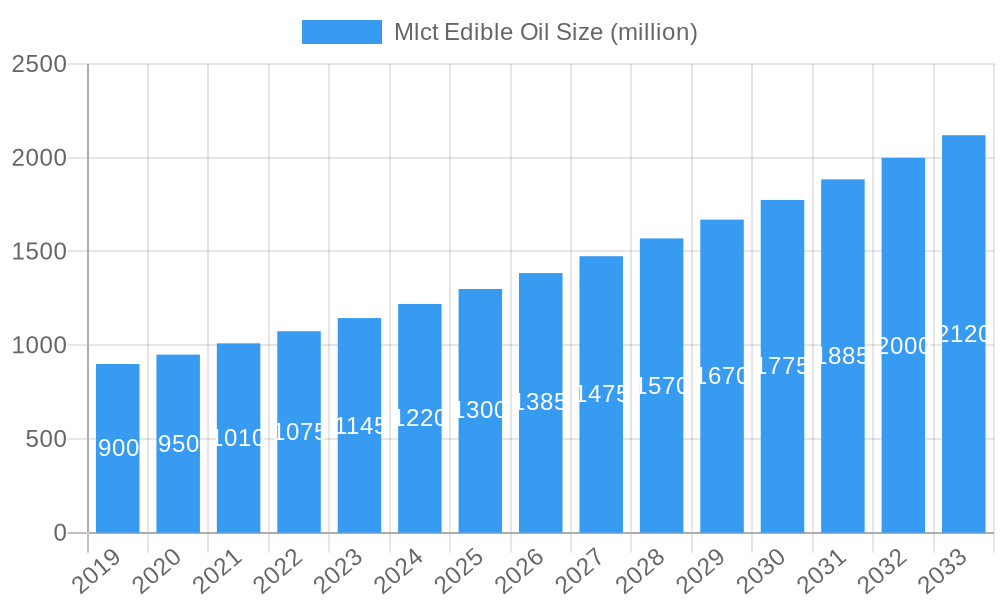
Mlct Edible Oil Market Size (In Million)
Despite the promising outlook, certain factors could temper the market's full potential. While demand is high, the relatively higher cost of production for MLCT edible oils compared to conventional cooking oils may present a restraint, particularly in price-sensitive markets. Supply chain complexities and the need for specialized infrastructure for processing and distribution can also pose challenges. However, the market is actively addressing these through strategic partnerships and advancements in production efficiency. Key players like Nisshin OilliO and Jinlongyu are investing in research and development to optimize production processes and expand their product portfolios. The market is segmented by application into Online Sales and Offline Sales, with Online Sales showing a faster growth rate due to e-commerce penetration. By type, specifications like 1L are popular, with other formats also gaining traction. Geographically, Asia Pacific, particularly China and India, is expected to be a dominant region, driven by large populations and increasing health consciousness, followed by North America and Europe, which have established markets for health-oriented food products.
Mlct Edible Oil Company Market Share
Comprehensive Report: MLCT Edible Oil Market Dynamics, Trends, and Future Outlook (2019-2033)
This in-depth report provides a definitive analysis of the global MLCT edible oil market, encompassing historical performance, current trends, and future projections. Covering a study period from 2019 to 2033, with a base and estimated year of 2025 and a forecast period from 2025 to 2033, this report is an essential resource for industry stakeholders, investors, and strategic planners. It offers granular insights into market structure, growth drivers, regional dominance, product landscape, challenges, opportunities, and key players, all presented with a focus on SEO optimization and high-traffic keyword integration for maximum industry visibility. Values are presented in million units.
MLCT Edible Oil Market Dynamics & Structure
The MLCT edible oil market exhibits a dynamic and evolving structure, characterized by moderate to high market concentration, driven by established global players and regional leaders. Technological innovation plays a crucial role, with advancements in extraction, processing, and fortification technologies shaping product offerings and consumer appeal. Regulatory frameworks, including food safety standards, labeling requirements, and import/export policies, significantly influence market access and operational costs. The competitive landscape is shaped by the presence of close product substitutes, such as other edible oil types and specialized fats, which exert pressure on pricing and market share. End-user demographics are increasingly diverse, with growing demand from health-conscious consumers, food processing industries, and emerging economies. Mergers and acquisitions (M&A) trends, while not consistently high in volume, are strategic in nature, aimed at consolidating market share, acquiring new technologies, or expanding geographic reach.
- Market Concentration: Dominated by a few key global manufacturers, with regional players holding significant sway in specific geographies.
- Technological Innovation Drivers: Focus on improving shelf-life, nutritional profiles (e.g., omega-3 enrichment), and sustainable sourcing practices.
- Regulatory Frameworks: Stringent food safety regulations (e.g., FSSAI, FDA) and evolving labeling laws impact product development and market entry.
- Competitive Product Substitutes: Competition from palm oil, soybean oil, sunflower oil, and specialty fats necessitates continuous product differentiation.
- End-User Demographics: Rising demand from millennial and Gen Z consumers seeking healthier, sustainably produced, and transparently sourced oils.
- M&A Trends: Strategic acquisitions by larger entities to gain access to new markets or technologies. Anticipated M&A deal volume in the forecast period: 5-8 deals.
MLCT Edible Oil Growth Trends & Insights
The MLCT edible oil market is poised for sustained growth, driven by a confluence of factors including expanding population, increasing disposable incomes, and a growing emphasis on health and wellness. The market size evolution is projected to show a consistent upward trajectory, with significant market penetration in both developed and developing economies. Technological disruptions, such as the development of novel extraction methods that enhance nutritional content and reduce processing costs, are expected to accelerate adoption rates. Consumer behavior shifts are playing a pivotal role, with a discernible move towards premium, organic, and fortified edible oils. This trend is further amplified by heightened awareness regarding the health benefits associated with specific fatty acid profiles present in MLCT edible oils. The CAGR for the global MLCT edible oil market is estimated to be between 4.5% and 6.0% during the forecast period, reflecting a robust expansion. Market penetration in key emerging economies is expected to surge by 15-20% over the next decade.
- Market Size Evolution: Projected to reach an estimated market size of $XX billion by 2033, with a steady increase from historical figures.
- Adoption Rates: Increasing adoption in households and the food service industry due to perceived health benefits and versatility.
- Technological Disruptions: Advancements in enzymatic modification and microencapsulation techniques enhancing product stability and functionality.
- Consumer Behavior Shifts: Growing preference for oils with specific nutritional benefits like reduced saturated fats and increased unsaturated fats.
- CAGR (Compound Annual Growth Rate): Anticipated at 4.5% - 6.0% during the forecast period.
- Market Penetration: Significant growth expected in Asia Pacific and Latin America, potentially increasing by 15-20% in the forecast period.
Dominant Regions, Countries, or Segments in MLCT Edible Oil
The global MLCT edible oil market's growth is significantly influenced by the performance and characteristics of its dominant regions and key segments. Asia Pacific stands out as a dominant region, driven by a large population base, rising disposable incomes, and increasing awareness about health and nutrition. Within this region, countries like China, India, and Southeast Asian nations are major consumers and producers of edible oils. The Application segment of Offline Sales continues to hold a substantial market share due to established retail infrastructure and traditional consumer purchasing habits. However, the Application segment of Online Sales is experiencing rapid growth, fueled by the convenience of e-commerce platforms and the increasing digital penetration across demographics.
In terms of Type, the Specification: 1L packaging remains a dominant format, catering to household consumption patterns. Nevertheless, the Other specification, encompassing bulk packaging for industrial use and smaller, specialized formats, is also showing promising growth. Key drivers for regional dominance include favorable government policies promoting agricultural production, robust economic growth, and well-developed supply chain networks. Market share within the dominant regions is often characterized by a mix of large multinational corporations and strong local players. The growth potential in these regions is further amplified by urbanization and evolving dietary patterns, leading to increased demand for a variety of edible oils.
- Dominant Region: Asia Pacific
- Key Countries: China, India, Indonesia, Malaysia
- Economic Policies: Supportive agricultural policies and trade agreements enhance production and consumption.
- Infrastructure: Well-established logistics and distribution networks facilitate market access.
- Market Share (Asia Pacific): Estimated to hold XX% of the global MLCT edible oil market by 2025.
- Growth Potential: High due to growing middle class and increasing demand for processed foods.
- Dominant Application: Offline Sales
- Drivers: Traditional retail channels, established brand presence in physical stores, and consumer trust.
- Market Share (Offline Sales): Estimated to be XX% of the total MLCT edible oil market in 2025.
- Emerging Application: Online Sales
- Drivers: Convenience, wider product availability, competitive pricing, and targeted marketing.
- Growth Rate (Online Sales): Projected to grow at a CAGR of XX% during the forecast period.
- Dominant Type: Specification: 1L
- Drivers: Ideal size for household consumption, widespread availability in retail outlets.
- Market Share (1L Specification): Dominates the retail packaging segment.
- Emerging Type: Other (Bulk & Specialty)
- Drivers: Industrial demand from food manufacturers, foodservice sector, and niche consumer preferences for specialty oils.
- Growth Potential: Significant opportunity in the food processing industry.
MLCT Edible Oil Product Landscape
The MLCT edible oil product landscape is characterized by a continuous stream of innovations aimed at enhancing nutritional value, improving sensory attributes, and meeting evolving consumer demands for healthier and more sustainable options. Key product innovations include the development of fortified MLCT edible oils with added vitamins and antioxidants, as well as the introduction of specialty blends designed for specific culinary applications like high-heat cooking or salad dressings. Performance metrics such as smoke point, oxidative stability, and fatty acid profiles are critical differentiators. Unique selling propositions often revolve around claims of being non-GMO, organic, or sustainably sourced, appealing to a growing segment of environmentally and health-conscious consumers. Technological advancements in refining and processing techniques contribute to the production of high-purity oils with enhanced functionality and extended shelf-life.
Key Drivers, Barriers & Challenges in MLCT Edible Oil
Key Drivers:
- Growing Health Consciousness: Increasing consumer awareness of the health benefits of consuming balanced fatty acids is a primary growth driver.
- Rising Demand in Food Industry: Expansion of the food processing sector and demand for ingredients with specific functional properties.
- Technological Advancements: Innovations in extraction, refining, and fortification technologies leading to improved product quality and cost-effectiveness.
- Economic Growth in Emerging Markets: Increasing disposable incomes and a growing middle class in developing economies are fueling demand.
- Nutritional Fortification: Government initiatives and consumer demand for fortified edible oils to combat micronutrient deficiencies.
Barriers & Challenges:
- Price Volatility of Raw Materials: Fluctuations in the prices of agricultural commodities can impact production costs and profitability.
- Intense Competition: The presence of numerous established edible oil types and substitutes creates significant competitive pressure.
- Supply Chain Disruptions: Geopolitical issues, climate change impacts, and logistical challenges can disrupt the supply of raw materials and finished products.
- Regulatory Hurdles: Stringent food safety regulations and evolving labeling requirements in different regions can pose compliance challenges.
- Consumer Perception and Education: Overcoming misconceptions about certain fats and educating consumers about the benefits of MLCT edible oils.
- Supply Chain Issues: Anticipated supply chain disruptions impacting raw material availability could increase costs by 5-10%.
- Regulatory Hurdles: Potential for increased compliance costs due to evolving food safety standards.
- Competitive Pressures: Aggressive pricing strategies from competitors could impact profit margins.
Emerging Opportunities in MLCT Edible Oil
Emerging opportunities in the MLCT edible oil market lie in the burgeoning demand for specialized and functional edible oils. The growing interest in plant-based diets and clean-label products presents a significant avenue for growth, with opportunities to develop oils with enhanced omega-3 and omega-6 profiles or those derived from novel plant sources. The foodservice sector, particularly the quick-service restaurant (QSR) and fine-dining segments, offers untapped potential for premium and specialty MLCT edible oils. Furthermore, innovations in sustainable sourcing and biodegradable packaging are likely to resonate with eco-conscious consumers, creating a competitive advantage. The development of MLCT edible oils tailored for specific dietary needs, such as low-cholesterol or allergen-free options, also represents a promising niche.
- Niche Markets: Development of specialized oils for vegan, keto, and paleo diets.
- Sustainable Sourcing: Growing consumer preference for ethically and environmentally sourced edible oils.
- Innovative Applications: Expansion into premium cooking oils, functional food ingredients, and nutraceuticals.
- Evolving Consumer Preferences: Catering to demand for functional ingredients and clean-label products.
Growth Accelerators in the MLCT Edible Oil Industry
Several catalysts are accelerating the growth of the MLCT edible oil industry. Technological breakthroughs in bio-fortification and genetic modification of oilseed crops are enhancing yield and nutritional content, thereby reducing production costs and improving product quality. Strategic partnerships between edible oil manufacturers and food technology companies are fostering innovation in product development and market penetration. Market expansion strategies focused on emerging economies, coupled with targeted marketing campaigns highlighting health benefits and product versatility, are further driving demand. Investments in sustainable agricultural practices and circular economy models are also positioning MLCT edible oils as a preferred choice for environmentally conscious consumers and businesses.
- Technological Breakthroughs: Advancements in crop science for enhanced oilseed yields and nutritional profiles.
- Strategic Partnerships: Collaborations with food manufacturers and research institutions for product innovation.
- Market Expansion Strategies: Focus on untapped geographical markets and new application segments.
- Sustainable Practices: Growing adoption of eco-friendly farming and processing methods.
Key Players Shaping the MLCT Edible Oil Market
- Nisshin OilliO
- Jinlongyu
- [Company Name 7]
- [Company Name 8]
- [Company Name 9]
- [Company Name 10]
- [Company Name 11]
- [Company Name 12]
- [Company Name 13]
- [Company Name 14]
Notable Milestones in MLCT Edible Oil Sector
- 2019: Launch of a new line of fortified MLCT edible oils with enhanced vitamin D content.
- 2020: Major acquisition by [Company Name X] to expand its presence in the Asian market.
- 2021: Introduction of sustainable sourcing certification for key MLCT edible oil products.
- 2022: Significant investment in R&D for next-generation edible oil processing technologies.
- 2023: Expansion into the burgeoning plant-based protein market with specialized MLCT oil formulations.
- 2024: Strategic alliance formed to develop novel applications for MLCT edible oils in the pharmaceutical sector.
- 2025: Projected launch of a fully traceable MLCT edible oil product line utilizing blockchain technology.
- 2026: Anticipated development of biodegradable packaging solutions for retail MLCT edible oil products.
- 2027: Expansion into the functional foods market with MLCT oils designed for cognitive health.
- 2028: Significant growth in online sales channels for MLCT edible oils, driven by e-commerce penetration.
- 2029: Introduction of AI-powered personalized edible oil recommendations for consumers.
- 2030: Development of advanced MLCT edible oil strains with improved climate resilience.
- 2031: Increased regulatory focus on the health benefits and sustainability of edible oils.
- 2032: Expansion of MLCT edible oil usage in the growing alternative protein sector.
- 2033: Consolidation of market leadership through further strategic acquisitions and technological integration.
In-Depth MLCT Edible Oil Market Outlook
The MLCT edible oil market is characterized by a promising future, driven by persistent growth accelerators and strategic initiatives. The increasing focus on health and wellness, coupled with the expanding global population, will continue to fuel demand. Technological advancements in agricultural science and processing techniques will lead to more nutritious, sustainable, and cost-effective products. Strategic partnerships and market expansion into developing economies will unlock significant growth potential. The evolving consumer preferences for functional ingredients and clean-label products present exciting opportunities for innovation and market differentiation. Overall, the MLCT edible oil market is poised for sustained expansion, offering substantial returns for stakeholders who can effectively navigate its dynamic landscape and capitalize on emerging trends. The outlook is robust, with continued innovation and strategic agility being key to long-term success in this vital sector.
Mlct Edible Oil Segmentation
-
1. Application
- 1.1. Online Sales
- 1.2. Offline Sales
-
2. Type
- 2.1. Specification: 1L
- 2.2. Other
Mlct Edible Oil Segmentation By Geography
-
1. North America
- 1.1. United States
- 1.2. Canada
- 1.3. Mexico
-
2. South America
- 2.1. Brazil
- 2.2. Argentina
- 2.3. Rest of South America
-
3. Europe
- 3.1. United Kingdom
- 3.2. Germany
- 3.3. France
- 3.4. Italy
- 3.5. Spain
- 3.6. Russia
- 3.7. Benelux
- 3.8. Nordics
- 3.9. Rest of Europe
-
4. Middle East & Africa
- 4.1. Turkey
- 4.2. Israel
- 4.3. GCC
- 4.4. North Africa
- 4.5. South Africa
- 4.6. Rest of Middle East & Africa
-
5. Asia Pacific
- 5.1. China
- 5.2. India
- 5.3. Japan
- 5.4. South Korea
- 5.5. ASEAN
- 5.6. Oceania
- 5.7. Rest of Asia Pacific
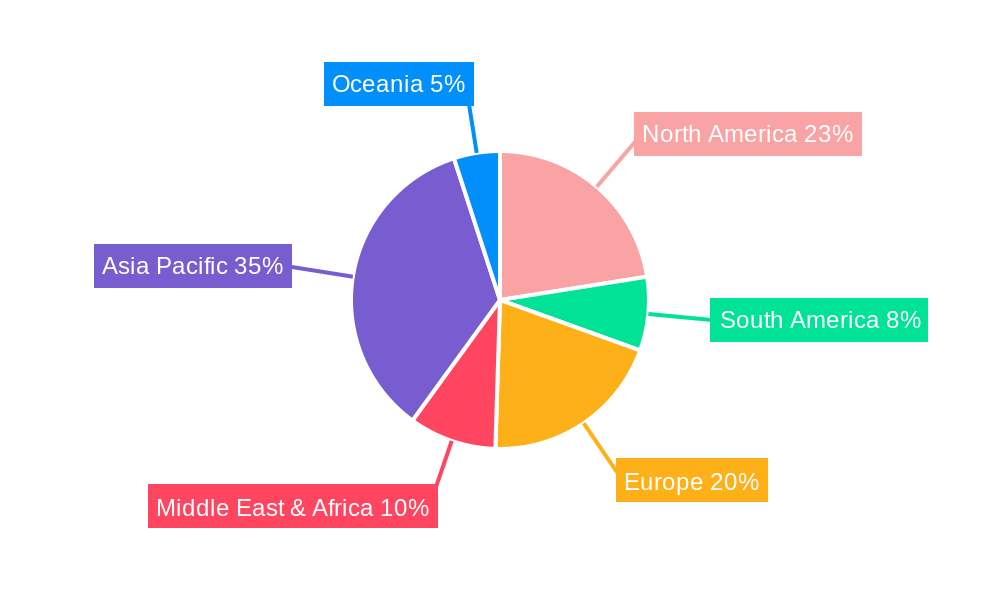
Mlct Edible Oil Regional Market Share
Geographic Coverage of Mlct Edible Oil
Mlct Edible Oil REPORT HIGHLIGHTS
| Aspects | Details |
|---|---|
| Study Period | 2020-2034 |
| Base Year | 2025 |
| Estimated Year | 2026 |
| Forecast Period | 2026-2034 |
| Historical Period | 2020-2025 |
| Growth Rate | CAGR of XXX% from 2020-2034 |
| Segmentation |
|
Table of Contents
- 1. Introduction
- 1.1. Research Scope
- 1.2. Market Segmentation
- 1.3. Research Methodology
- 1.4. Definitions and Assumptions
- 2. Executive Summary
- 2.1. Introduction
- 3. Market Dynamics
- 3.1. Introduction
- 3.2. Market Drivers
- 3.3. Market Restrains
- 3.4. Market Trends
- 4. Market Factor Analysis
- 4.1. Porters Five Forces
- 4.2. Supply/Value Chain
- 4.3. PESTEL analysis
- 4.4. Market Entropy
- 4.5. Patent/Trademark Analysis
- 5. Global Mlct Edible Oil Analysis, Insights and Forecast, 2020-2032
- 5.1. Market Analysis, Insights and Forecast - by Application
- 5.1.1. Online Sales
- 5.1.2. Offline Sales
- 5.2. Market Analysis, Insights and Forecast - by Type
- 5.2.1. Specification: 1L
- 5.2.2. Other
- 5.3. Market Analysis, Insights and Forecast - by Region
- 5.3.1. North America
- 5.3.2. South America
- 5.3.3. Europe
- 5.3.4. Middle East & Africa
- 5.3.5. Asia Pacific
- 5.1. Market Analysis, Insights and Forecast - by Application
- 6. North America Mlct Edible Oil Analysis, Insights and Forecast, 2020-2032
- 6.1. Market Analysis, Insights and Forecast - by Application
- 6.1.1. Online Sales
- 6.1.2. Offline Sales
- 6.2. Market Analysis, Insights and Forecast - by Type
- 6.2.1. Specification: 1L
- 6.2.2. Other
- 6.1. Market Analysis, Insights and Forecast - by Application
- 7. South America Mlct Edible Oil Analysis, Insights and Forecast, 2020-2032
- 7.1. Market Analysis, Insights and Forecast - by Application
- 7.1.1. Online Sales
- 7.1.2. Offline Sales
- 7.2. Market Analysis, Insights and Forecast - by Type
- 7.2.1. Specification: 1L
- 7.2.2. Other
- 7.1. Market Analysis, Insights and Forecast - by Application
- 8. Europe Mlct Edible Oil Analysis, Insights and Forecast, 2020-2032
- 8.1. Market Analysis, Insights and Forecast - by Application
- 8.1.1. Online Sales
- 8.1.2. Offline Sales
- 8.2. Market Analysis, Insights and Forecast - by Type
- 8.2.1. Specification: 1L
- 8.2.2. Other
- 8.1. Market Analysis, Insights and Forecast - by Application
- 9. Middle East & Africa Mlct Edible Oil Analysis, Insights and Forecast, 2020-2032
- 9.1. Market Analysis, Insights and Forecast - by Application
- 9.1.1. Online Sales
- 9.1.2. Offline Sales
- 9.2. Market Analysis, Insights and Forecast - by Type
- 9.2.1. Specification: 1L
- 9.2.2. Other
- 9.1. Market Analysis, Insights and Forecast - by Application
- 10. Asia Pacific Mlct Edible Oil Analysis, Insights and Forecast, 2020-2032
- 10.1. Market Analysis, Insights and Forecast - by Application
- 10.1.1. Online Sales
- 10.1.2. Offline Sales
- 10.2. Market Analysis, Insights and Forecast - by Type
- 10.2.1. Specification: 1L
- 10.2.2. Other
- 10.1. Market Analysis, Insights and Forecast - by Application
- 11. Competitive Analysis
- 11.1. Global Market Share Analysis 2025
- 11.2. Company Profiles
- 11.2.1 Nisshin OilliO
- 11.2.1.1. Overview
- 11.2.1.2. Products
- 11.2.1.3. SWOT Analysis
- 11.2.1.4. Recent Developments
- 11.2.1.5. Financials (Based on Availability)
- 11.2.2 Jinlongyu
- 11.2.2.1. Overview
- 11.2.2.2. Products
- 11.2.2.3. SWOT Analysis
- 11.2.2.4. Recent Developments
- 11.2.2.5. Financials (Based on Availability)
- 11.2.1 Nisshin OilliO
List of Figures
- Figure 1: Global Mlct Edible Oil Revenue Breakdown (million, %) by Region 2025 & 2033
- Figure 2: Global Mlct Edible Oil Volume Breakdown (K, %) by Region 2025 & 2033
- Figure 3: North America Mlct Edible Oil Revenue (million), by Application 2025 & 2033
- Figure 4: North America Mlct Edible Oil Volume (K), by Application 2025 & 2033
- Figure 5: North America Mlct Edible Oil Revenue Share (%), by Application 2025 & 2033
- Figure 6: North America Mlct Edible Oil Volume Share (%), by Application 2025 & 2033
- Figure 7: North America Mlct Edible Oil Revenue (million), by Type 2025 & 2033
- Figure 8: North America Mlct Edible Oil Volume (K), by Type 2025 & 2033
- Figure 9: North America Mlct Edible Oil Revenue Share (%), by Type 2025 & 2033
- Figure 10: North America Mlct Edible Oil Volume Share (%), by Type 2025 & 2033
- Figure 11: North America Mlct Edible Oil Revenue (million), by Country 2025 & 2033
- Figure 12: North America Mlct Edible Oil Volume (K), by Country 2025 & 2033
- Figure 13: North America Mlct Edible Oil Revenue Share (%), by Country 2025 & 2033
- Figure 14: North America Mlct Edible Oil Volume Share (%), by Country 2025 & 2033
- Figure 15: South America Mlct Edible Oil Revenue (million), by Application 2025 & 2033
- Figure 16: South America Mlct Edible Oil Volume (K), by Application 2025 & 2033
- Figure 17: South America Mlct Edible Oil Revenue Share (%), by Application 2025 & 2033
- Figure 18: South America Mlct Edible Oil Volume Share (%), by Application 2025 & 2033
- Figure 19: South America Mlct Edible Oil Revenue (million), by Type 2025 & 2033
- Figure 20: South America Mlct Edible Oil Volume (K), by Type 2025 & 2033
- Figure 21: South America Mlct Edible Oil Revenue Share (%), by Type 2025 & 2033
- Figure 22: South America Mlct Edible Oil Volume Share (%), by Type 2025 & 2033
- Figure 23: South America Mlct Edible Oil Revenue (million), by Country 2025 & 2033
- Figure 24: South America Mlct Edible Oil Volume (K), by Country 2025 & 2033
- Figure 25: South America Mlct Edible Oil Revenue Share (%), by Country 2025 & 2033
- Figure 26: South America Mlct Edible Oil Volume Share (%), by Country 2025 & 2033
- Figure 27: Europe Mlct Edible Oil Revenue (million), by Application 2025 & 2033
- Figure 28: Europe Mlct Edible Oil Volume (K), by Application 2025 & 2033
- Figure 29: Europe Mlct Edible Oil Revenue Share (%), by Application 2025 & 2033
- Figure 30: Europe Mlct Edible Oil Volume Share (%), by Application 2025 & 2033
- Figure 31: Europe Mlct Edible Oil Revenue (million), by Type 2025 & 2033
- Figure 32: Europe Mlct Edible Oil Volume (K), by Type 2025 & 2033
- Figure 33: Europe Mlct Edible Oil Revenue Share (%), by Type 2025 & 2033
- Figure 34: Europe Mlct Edible Oil Volume Share (%), by Type 2025 & 2033
- Figure 35: Europe Mlct Edible Oil Revenue (million), by Country 2025 & 2033
- Figure 36: Europe Mlct Edible Oil Volume (K), by Country 2025 & 2033
- Figure 37: Europe Mlct Edible Oil Revenue Share (%), by Country 2025 & 2033
- Figure 38: Europe Mlct Edible Oil Volume Share (%), by Country 2025 & 2033
- Figure 39: Middle East & Africa Mlct Edible Oil Revenue (million), by Application 2025 & 2033
- Figure 40: Middle East & Africa Mlct Edible Oil Volume (K), by Application 2025 & 2033
- Figure 41: Middle East & Africa Mlct Edible Oil Revenue Share (%), by Application 2025 & 2033
- Figure 42: Middle East & Africa Mlct Edible Oil Volume Share (%), by Application 2025 & 2033
- Figure 43: Middle East & Africa Mlct Edible Oil Revenue (million), by Type 2025 & 2033
- Figure 44: Middle East & Africa Mlct Edible Oil Volume (K), by Type 2025 & 2033
- Figure 45: Middle East & Africa Mlct Edible Oil Revenue Share (%), by Type 2025 & 2033
- Figure 46: Middle East & Africa Mlct Edible Oil Volume Share (%), by Type 2025 & 2033
- Figure 47: Middle East & Africa Mlct Edible Oil Revenue (million), by Country 2025 & 2033
- Figure 48: Middle East & Africa Mlct Edible Oil Volume (K), by Country 2025 & 2033
- Figure 49: Middle East & Africa Mlct Edible Oil Revenue Share (%), by Country 2025 & 2033
- Figure 50: Middle East & Africa Mlct Edible Oil Volume Share (%), by Country 2025 & 2033
- Figure 51: Asia Pacific Mlct Edible Oil Revenue (million), by Application 2025 & 2033
- Figure 52: Asia Pacific Mlct Edible Oil Volume (K), by Application 2025 & 2033
- Figure 53: Asia Pacific Mlct Edible Oil Revenue Share (%), by Application 2025 & 2033
- Figure 54: Asia Pacific Mlct Edible Oil Volume Share (%), by Application 2025 & 2033
- Figure 55: Asia Pacific Mlct Edible Oil Revenue (million), by Type 2025 & 2033
- Figure 56: Asia Pacific Mlct Edible Oil Volume (K), by Type 2025 & 2033
- Figure 57: Asia Pacific Mlct Edible Oil Revenue Share (%), by Type 2025 & 2033
- Figure 58: Asia Pacific Mlct Edible Oil Volume Share (%), by Type 2025 & 2033
- Figure 59: Asia Pacific Mlct Edible Oil Revenue (million), by Country 2025 & 2033
- Figure 60: Asia Pacific Mlct Edible Oil Volume (K), by Country 2025 & 2033
- Figure 61: Asia Pacific Mlct Edible Oil Revenue Share (%), by Country 2025 & 2033
- Figure 62: Asia Pacific Mlct Edible Oil Volume Share (%), by Country 2025 & 2033
List of Tables
- Table 1: Global Mlct Edible Oil Revenue million Forecast, by Application 2020 & 2033
- Table 2: Global Mlct Edible Oil Volume K Forecast, by Application 2020 & 2033
- Table 3: Global Mlct Edible Oil Revenue million Forecast, by Type 2020 & 2033
- Table 4: Global Mlct Edible Oil Volume K Forecast, by Type 2020 & 2033
- Table 5: Global Mlct Edible Oil Revenue million Forecast, by Region 2020 & 2033
- Table 6: Global Mlct Edible Oil Volume K Forecast, by Region 2020 & 2033
- Table 7: Global Mlct Edible Oil Revenue million Forecast, by Application 2020 & 2033
- Table 8: Global Mlct Edible Oil Volume K Forecast, by Application 2020 & 2033
- Table 9: Global Mlct Edible Oil Revenue million Forecast, by Type 2020 & 2033
- Table 10: Global Mlct Edible Oil Volume K Forecast, by Type 2020 & 2033
- Table 11: Global Mlct Edible Oil Revenue million Forecast, by Country 2020 & 2033
- Table 12: Global Mlct Edible Oil Volume K Forecast, by Country 2020 & 2033
- Table 13: United States Mlct Edible Oil Revenue (million) Forecast, by Application 2020 & 2033
- Table 14: United States Mlct Edible Oil Volume (K) Forecast, by Application 2020 & 2033
- Table 15: Canada Mlct Edible Oil Revenue (million) Forecast, by Application 2020 & 2033
- Table 16: Canada Mlct Edible Oil Volume (K) Forecast, by Application 2020 & 2033
- Table 17: Mexico Mlct Edible Oil Revenue (million) Forecast, by Application 2020 & 2033
- Table 18: Mexico Mlct Edible Oil Volume (K) Forecast, by Application 2020 & 2033
- Table 19: Global Mlct Edible Oil Revenue million Forecast, by Application 2020 & 2033
- Table 20: Global Mlct Edible Oil Volume K Forecast, by Application 2020 & 2033
- Table 21: Global Mlct Edible Oil Revenue million Forecast, by Type 2020 & 2033
- Table 22: Global Mlct Edible Oil Volume K Forecast, by Type 2020 & 2033
- Table 23: Global Mlct Edible Oil Revenue million Forecast, by Country 2020 & 2033
- Table 24: Global Mlct Edible Oil Volume K Forecast, by Country 2020 & 2033
- Table 25: Brazil Mlct Edible Oil Revenue (million) Forecast, by Application 2020 & 2033
- Table 26: Brazil Mlct Edible Oil Volume (K) Forecast, by Application 2020 & 2033
- Table 27: Argentina Mlct Edible Oil Revenue (million) Forecast, by Application 2020 & 2033
- Table 28: Argentina Mlct Edible Oil Volume (K) Forecast, by Application 2020 & 2033
- Table 29: Rest of South America Mlct Edible Oil Revenue (million) Forecast, by Application 2020 & 2033
- Table 30: Rest of South America Mlct Edible Oil Volume (K) Forecast, by Application 2020 & 2033
- Table 31: Global Mlct Edible Oil Revenue million Forecast, by Application 2020 & 2033
- Table 32: Global Mlct Edible Oil Volume K Forecast, by Application 2020 & 2033
- Table 33: Global Mlct Edible Oil Revenue million Forecast, by Type 2020 & 2033
- Table 34: Global Mlct Edible Oil Volume K Forecast, by Type 2020 & 2033
- Table 35: Global Mlct Edible Oil Revenue million Forecast, by Country 2020 & 2033
- Table 36: Global Mlct Edible Oil Volume K Forecast, by Country 2020 & 2033
- Table 37: United Kingdom Mlct Edible Oil Revenue (million) Forecast, by Application 2020 & 2033
- Table 38: United Kingdom Mlct Edible Oil Volume (K) Forecast, by Application 2020 & 2033
- Table 39: Germany Mlct Edible Oil Revenue (million) Forecast, by Application 2020 & 2033
- Table 40: Germany Mlct Edible Oil Volume (K) Forecast, by Application 2020 & 2033
- Table 41: France Mlct Edible Oil Revenue (million) Forecast, by Application 2020 & 2033
- Table 42: France Mlct Edible Oil Volume (K) Forecast, by Application 2020 & 2033
- Table 43: Italy Mlct Edible Oil Revenue (million) Forecast, by Application 2020 & 2033
- Table 44: Italy Mlct Edible Oil Volume (K) Forecast, by Application 2020 & 2033
- Table 45: Spain Mlct Edible Oil Revenue (million) Forecast, by Application 2020 & 2033
- Table 46: Spain Mlct Edible Oil Volume (K) Forecast, by Application 2020 & 2033
- Table 47: Russia Mlct Edible Oil Revenue (million) Forecast, by Application 2020 & 2033
- Table 48: Russia Mlct Edible Oil Volume (K) Forecast, by Application 2020 & 2033
- Table 49: Benelux Mlct Edible Oil Revenue (million) Forecast, by Application 2020 & 2033
- Table 50: Benelux Mlct Edible Oil Volume (K) Forecast, by Application 2020 & 2033
- Table 51: Nordics Mlct Edible Oil Revenue (million) Forecast, by Application 2020 & 2033
- Table 52: Nordics Mlct Edible Oil Volume (K) Forecast, by Application 2020 & 2033
- Table 53: Rest of Europe Mlct Edible Oil Revenue (million) Forecast, by Application 2020 & 2033
- Table 54: Rest of Europe Mlct Edible Oil Volume (K) Forecast, by Application 2020 & 2033
- Table 55: Global Mlct Edible Oil Revenue million Forecast, by Application 2020 & 2033
- Table 56: Global Mlct Edible Oil Volume K Forecast, by Application 2020 & 2033
- Table 57: Global Mlct Edible Oil Revenue million Forecast, by Type 2020 & 2033
- Table 58: Global Mlct Edible Oil Volume K Forecast, by Type 2020 & 2033
- Table 59: Global Mlct Edible Oil Revenue million Forecast, by Country 2020 & 2033
- Table 60: Global Mlct Edible Oil Volume K Forecast, by Country 2020 & 2033
- Table 61: Turkey Mlct Edible Oil Revenue (million) Forecast, by Application 2020 & 2033
- Table 62: Turkey Mlct Edible Oil Volume (K) Forecast, by Application 2020 & 2033
- Table 63: Israel Mlct Edible Oil Revenue (million) Forecast, by Application 2020 & 2033
- Table 64: Israel Mlct Edible Oil Volume (K) Forecast, by Application 2020 & 2033
- Table 65: GCC Mlct Edible Oil Revenue (million) Forecast, by Application 2020 & 2033
- Table 66: GCC Mlct Edible Oil Volume (K) Forecast, by Application 2020 & 2033
- Table 67: North Africa Mlct Edible Oil Revenue (million) Forecast, by Application 2020 & 2033
- Table 68: North Africa Mlct Edible Oil Volume (K) Forecast, by Application 2020 & 2033
- Table 69: South Africa Mlct Edible Oil Revenue (million) Forecast, by Application 2020 & 2033
- Table 70: South Africa Mlct Edible Oil Volume (K) Forecast, by Application 2020 & 2033
- Table 71: Rest of Middle East & Africa Mlct Edible Oil Revenue (million) Forecast, by Application 2020 & 2033
- Table 72: Rest of Middle East & Africa Mlct Edible Oil Volume (K) Forecast, by Application 2020 & 2033
- Table 73: Global Mlct Edible Oil Revenue million Forecast, by Application 2020 & 2033
- Table 74: Global Mlct Edible Oil Volume K Forecast, by Application 2020 & 2033
- Table 75: Global Mlct Edible Oil Revenue million Forecast, by Type 2020 & 2033
- Table 76: Global Mlct Edible Oil Volume K Forecast, by Type 2020 & 2033
- Table 77: Global Mlct Edible Oil Revenue million Forecast, by Country 2020 & 2033
- Table 78: Global Mlct Edible Oil Volume K Forecast, by Country 2020 & 2033
- Table 79: China Mlct Edible Oil Revenue (million) Forecast, by Application 2020 & 2033
- Table 80: China Mlct Edible Oil Volume (K) Forecast, by Application 2020 & 2033
- Table 81: India Mlct Edible Oil Revenue (million) Forecast, by Application 2020 & 2033
- Table 82: India Mlct Edible Oil Volume (K) Forecast, by Application 2020 & 2033
- Table 83: Japan Mlct Edible Oil Revenue (million) Forecast, by Application 2020 & 2033
- Table 84: Japan Mlct Edible Oil Volume (K) Forecast, by Application 2020 & 2033
- Table 85: South Korea Mlct Edible Oil Revenue (million) Forecast, by Application 2020 & 2033
- Table 86: South Korea Mlct Edible Oil Volume (K) Forecast, by Application 2020 & 2033
- Table 87: ASEAN Mlct Edible Oil Revenue (million) Forecast, by Application 2020 & 2033
- Table 88: ASEAN Mlct Edible Oil Volume (K) Forecast, by Application 2020 & 2033
- Table 89: Oceania Mlct Edible Oil Revenue (million) Forecast, by Application 2020 & 2033
- Table 90: Oceania Mlct Edible Oil Volume (K) Forecast, by Application 2020 & 2033
- Table 91: Rest of Asia Pacific Mlct Edible Oil Revenue (million) Forecast, by Application 2020 & 2033
- Table 92: Rest of Asia Pacific Mlct Edible Oil Volume (K) Forecast, by Application 2020 & 2033
Frequently Asked Questions
1. What is the projected Compound Annual Growth Rate (CAGR) of the Mlct Edible Oil?
The projected CAGR is approximately XXX%.
2. Which companies are prominent players in the Mlct Edible Oil?
Key companies in the market include Nisshin OilliO, Jinlongyu.
3. What are the main segments of the Mlct Edible Oil?
The market segments include Application, Type.
4. Can you provide details about the market size?
The market size is estimated to be USD XXX million as of 2022.
5. What are some drivers contributing to market growth?
N/A
6. What are the notable trends driving market growth?
N/A
7. Are there any restraints impacting market growth?
N/A
8. Can you provide examples of recent developments in the market?
N/A
9. What pricing options are available for accessing the report?
Pricing options include single-user, multi-user, and enterprise licenses priced at USD 3950.00, USD 5925.00, and USD 7900.00 respectively.
10. Is the market size provided in terms of value or volume?
The market size is provided in terms of value, measured in million and volume, measured in K.
11. Are there any specific market keywords associated with the report?
Yes, the market keyword associated with the report is "Mlct Edible Oil," which aids in identifying and referencing the specific market segment covered.
12. How do I determine which pricing option suits my needs best?
The pricing options vary based on user requirements and access needs. Individual users may opt for single-user licenses, while businesses requiring broader access may choose multi-user or enterprise licenses for cost-effective access to the report.
13. Are there any additional resources or data provided in the Mlct Edible Oil report?
While the report offers comprehensive insights, it's advisable to review the specific contents or supplementary materials provided to ascertain if additional resources or data are available.
14. How can I stay updated on further developments or reports in the Mlct Edible Oil?
To stay informed about further developments, trends, and reports in the Mlct Edible Oil, consider subscribing to industry newsletters, following relevant companies and organizations, or regularly checking reputable industry news sources and publications.
Methodology
Step 1 - Identification of Relevant Samples Size from Population Database


Step 2 - Approaches for Defining Global Market Size (Value, Volume* & Price*)

Note*: In applicable scenarios
Step 3 - Data Sources
Primary Research
- Web Analytics
- Survey Reports
- Research Institute
- Latest Research Reports
- Opinion Leaders
Secondary Research
- Annual Reports
- White Paper
- Latest Press Release
- Industry Association
- Paid Database
- Investor Presentations

Step 4 - Data Triangulation
Involves using different sources of information in order to increase the validity of a study
These sources are likely to be stakeholders in a program - participants, other researchers, program staff, other community members, and so on.
Then we put all data in single framework & apply various statistical tools to find out the dynamic on the market.
During the analysis stage, feedback from the stakeholder groups would be compared to determine areas of agreement as well as areas of divergence