

Key Insights
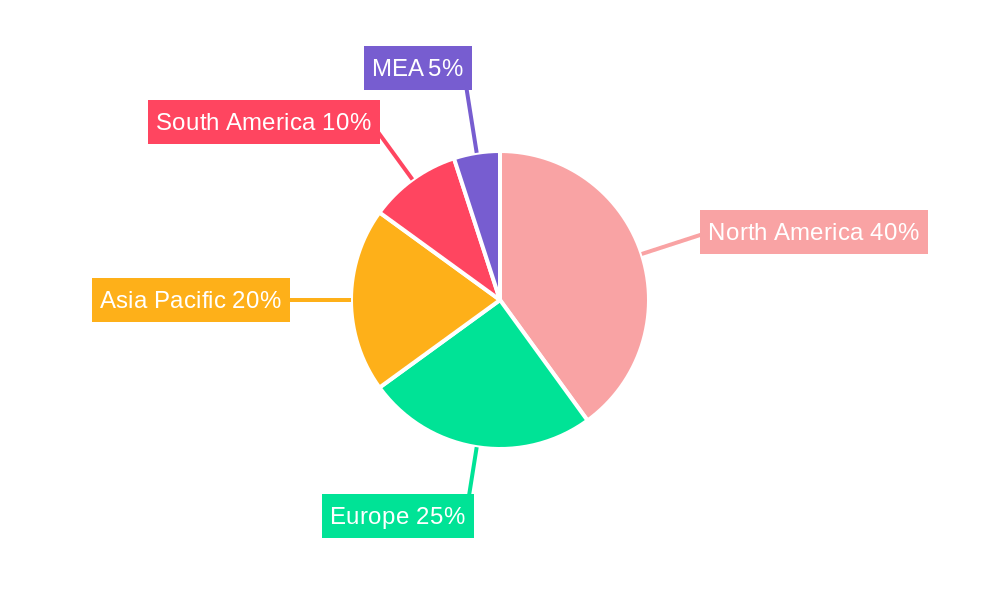
The Molten Salt Thermal Energy Storage (MSTES) market is poised for significant expansion, driven by the global imperative for dependable and efficient energy storage to integrate intermittent renewable energy sources such as solar and wind power. Key growth catalysts include government-led renewable energy promotion, decreasing MSTES technology costs, and innovations in molten salt chemistry enhancing thermal stability and efficiency. Dominant technologies, including parabolic troughs, Fresnel reflectors, and power towers, offer distinct advantages in scalability, cost-effectiveness, and application versatility. While North America currently leads market share due to substantial renewable energy infrastructure investment and favorable policies, the Asia-Pacific region is anticipated to experience the most rapid growth, propelled by expanding solar and wind capacity and rising energy demand in China and India. The current market size is valued at $2.22 billion in the base year 2025, with a projected Compound Annual Growth Rate (CAGR) of 9.8%, indicating substantial market evolution through 2033.
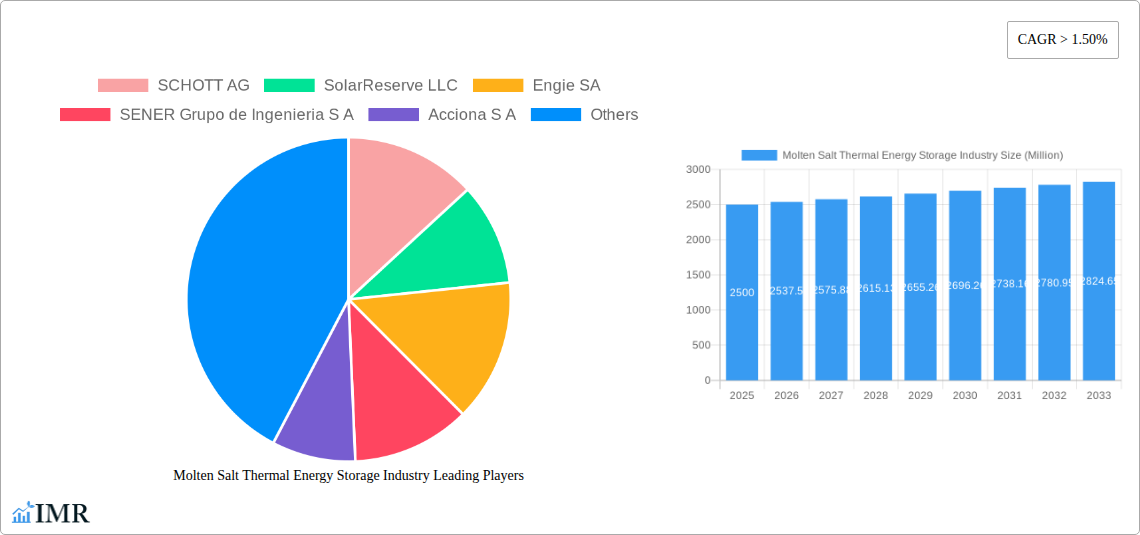
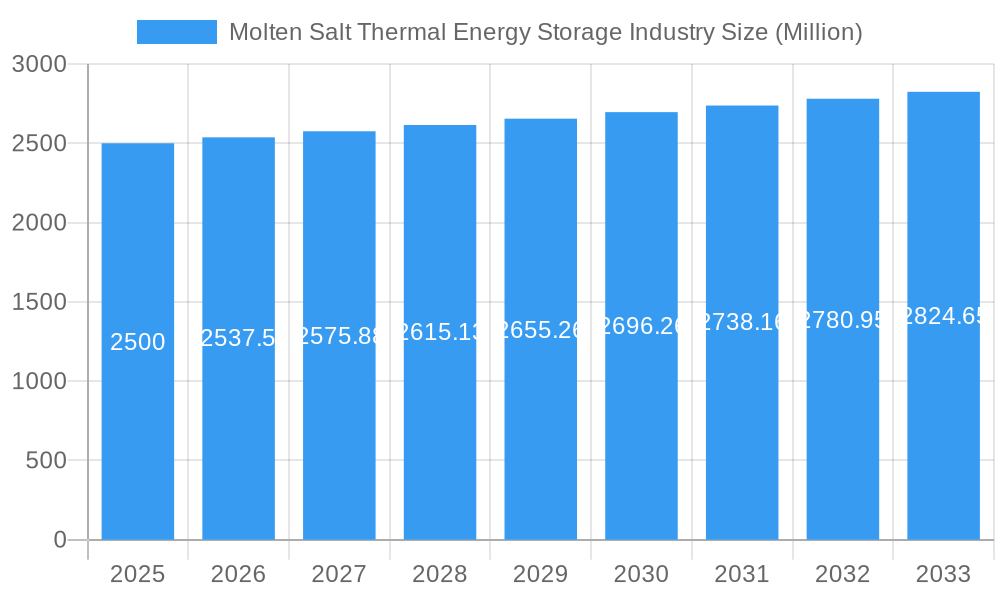
Molten Salt Thermal Energy Storage Industry Market Size (In Billion)
However, challenges persist, primarily high initial capital expenditure hindering widespread adoption, particularly in developing economies. Continued technological advancements are necessary to bolster the long-term durability and reduce maintenance needs of molten salt systems. Addressing these hurdles through strategic collaborations, dedicated research and development, and supportive regulatory environments will be instrumental in realizing the full potential of the MSTES market and accelerating the transition to a sustainable energy future. The competitive environment features established entities such as SCHOTT AG, SolarReserve LLC, and Engie SA, alongside agile, innovative emerging companies, fostering continuous innovation and cost optimization for end-users and enhanced market penetration.
Molten Salt Thermal Energy Storage Industry Company Market Share
Molten Salt Thermal Energy Storage Industry: A Comprehensive Market Report (2019-2033)
This comprehensive report provides an in-depth analysis of the Molten Salt Thermal Energy Storage (MSTS) industry, encompassing market dynamics, growth trends, regional insights, and competitive landscapes. It offers valuable insights for industry professionals, investors, and researchers seeking to understand and capitalize on the burgeoning opportunities within this crucial sector of renewable energy. The report covers the parent market of renewable energy storage and the child market of thermal energy storage specifically using molten salt technology. We project a market value of xx Million by 2033.
Molten Salt Thermal Energy Storage Industry Market Dynamics & Structure
The Molten Salt Thermal Energy Storage (MSTS) market is characterized by moderate concentration, with key players like SCHOTT AG, SolarReserve LLC, Engie SA, SENER Grupo de Ingenieria S A, Acciona S A, Abengoa SA, Yara International ASA, and BrightSource Energy Inc. driving innovation and market share. The industry is experiencing significant technological advancements, primarily focused on enhancing efficiency, reducing costs, and expanding applications. Stringent environmental regulations and the growing need for grid stability are strong catalysts. However, high initial investment costs and the need for specialized materials present key challenges. The historical period (2019-2024) saw a steady growth rate, driven by government incentives and increasing renewable energy adoption. The forecast period (2025-2033) projects continued expansion, fueled by technological advancements and increasing demand for reliable energy storage solutions.
- Market Concentration: Moderately concentrated, with a few dominant players holding significant market share. (Estimated xx% market share for top 5 players in 2025).
- Technological Innovation: Focus on improving efficiency, reducing costs, and developing higher-temperature molten salts.
- Regulatory Frameworks: Government policies and incentives are playing a crucial role in driving market adoption.
- Competitive Product Substitutes: Competition exists from other energy storage technologies, such as batteries and pumped hydro.
- End-User Demographics: Primary end-users include power plants, industrial facilities, and utilities.
- M&A Trends: A moderate number of mergers and acquisitions (M&A) have occurred, indicating industry consolidation and growth. (Estimated xx M&A deals between 2019-2024).
Molten Salt Thermal Energy Storage Industry Growth Trends & Insights
The MSTS market witnessed significant growth during the historical period (2019-2024), driven by factors such as increasing renewable energy capacity, government support for renewable energy integration, and the need for reliable energy storage solutions. The market size is expected to experience substantial growth throughout the forecast period (2025-2033). This growth is being propelled by continuous technological advancements, decreasing costs, and expanding applications across diverse sectors. Adoption rates are projected to increase steadily, driven by favorable government policies and declining capital costs. Consumer behavior is shifting towards sustainable energy solutions, further boosting market demand.
- Market Size Evolution: From xx Million in 2019 to xx Million in 2024, projecting to xx Million by 2033.
- CAGR (2019-2024): xx%
- CAGR (2025-2033): xx%
- Market Penetration: Growing steadily, with increasing adoption by utilities and industrial sectors.
Dominant Regions, Countries, or Segments in Molten Salt Thermal Energy Storage Industry
The MSTS market is geographically diverse, with significant growth potential across multiple regions. However, specific regions are currently leading due to factors such as favorable government policies, robust renewable energy capacity, and strong investment in energy infrastructure. Within the technology segments, parabolic troughs and power towers currently hold the largest market shares, driven by their proven track record and scalability.
Leading Region: The United States currently holds a leading position, due to significant investment in renewable energy and supportive government policies. Other regions showing strong growth are Europe and parts of Asia.
Leading Technology Segment: Parabolic trough systems currently dominate the market due to their mature technology and lower cost compared to other MSTS technologies.
Key Drivers:
- Economic Policies: Government incentives and subsidies are playing a crucial role in market growth.
- Infrastructure Development: Investments in renewable energy infrastructure are creating demand for reliable energy storage solutions.
- Technological Advancements: Continuous innovation in molten salt technology is driving down costs and enhancing efficiency.
Market Share:
- Parabolic Troughs: xx%
- Fresnel Reflectors: xx%
- Power Tower: xx%
Molten Salt Thermal Energy Storage Industry Product Landscape
MSTS systems are characterized by their ability to store thermal energy in molten salts, which can be later used to generate electricity or provide heat. Technological advancements focus on improving the efficiency and durability of molten salts, reducing costs, and enhancing system integration with renewable energy sources. This includes the development of more cost-effective materials, improved heat transfer mechanisms, and advanced control systems. The unique selling proposition is the ability to provide long-duration energy storage solutions, vital for grid stability and renewable energy integration.
Key Drivers, Barriers & Challenges in Molten Salt Thermal Energy Storage Industry
Key Drivers:
The market is primarily driven by the increasing need for reliable and efficient energy storage solutions to complement intermittent renewable energy sources such as solar and wind power. Furthermore, supportive government policies, including subsidies and tax incentives, are accelerating market growth. Technological advancements, leading to improved efficiency and reduced costs, are also crucial drivers.
Key Barriers and Challenges:
High capital costs associated with initial installation remain a major barrier to widespread adoption. Supply chain issues, particularly concerning the availability of specialized materials for molten salt storage systems, can hinder project implementation. Regulatory hurdles and a lack of standardization can also impede market expansion. Competition from other energy storage technologies is another notable challenge.
Emerging Opportunities in Molten Salt Thermal Energy Storage Industry
Emerging opportunities lie in the integration of MSTS with advanced energy management systems, creating smart grids that optimize energy distribution. Untapped markets in developing economies, with growing renewable energy capacity and the need for stable energy solutions, represent significant growth potential. Innovative applications, such as industrial process heat and district heating, are also expected to drive market growth.
Growth Accelerators in the Molten Salt Thermal Energy Storage Industry
Long-term growth will be accelerated by technological breakthroughs that further reduce costs and improve efficiency of molten salt storage systems. Strategic partnerships between technology providers, energy companies, and governments can facilitate faster market adoption. Expansion into new geographic markets, particularly in regions with high renewable energy penetration, will also significantly contribute to market growth.
Key Players Shaping the Molten Salt Thermal Energy Storage Industry Market
- SCHOTT AG
- SolarReserve LLC
- Engie SA
- SENER Grupo de Ingenieria S A
- Acciona S A
- Abengoa SA
- Yara International ASA
- BrightSource Energy Inc
Notable Milestones in Molten Salt Thermal Energy Storage Industry Sector
- November 2022: Hyme Energy ApS partnered with Bornholms Energi & Forsyning (BEOF) to build a 1 MW/20 MWh molten salt thermal energy storage demonstrator in Denmark, scheduled for completion in 2024. This project showcases the growing interest in MSTS technology and its potential for providing heat, power, and ancillary services to local grids.
In-Depth Molten Salt Thermal Energy Storage Industry Market Outlook
The future of the MSTS market is bright, driven by increasing demand for long-duration energy storage, technological advancements leading to cost reductions, and supportive government policies. Strategic opportunities exist for companies to expand their market reach, develop innovative applications, and forge strategic partnerships to accelerate market adoption. The projected market size indicates substantial growth potential, offering significant returns on investment for industry stakeholders.
Molten Salt Thermal Energy Storage Industry Segmentation
-
1. Technology
- 1.1. Parabolic Troughs
- 1.2. Fresnel Reflector
- 1.3. Power Tower
Molten Salt Thermal Energy Storage Industry Segmentation By Geography
- 1. North America
- 2. Asia Pacific
- 3. Europe
- 4. South America
- 5. Middle East and Africa
Molten Salt Thermal Energy Storage Industry Regional Market Share
Geographic Coverage of Molten Salt Thermal Energy Storage Industry
Molten Salt Thermal Energy Storage Industry REPORT HIGHLIGHTS
| Aspects | Details |
|---|---|
| Study Period | 2020-2034 |
| Base Year | 2025 |
| Estimated Year | 2026 |
| Forecast Period | 2026-2034 |
| Historical Period | 2020-2025 |
| Growth Rate | CAGR of 9.8% from 2020-2034 |
| Segmentation |
|
Table of Contents
- 1. Introduction
- 1.1. Research Scope
- 1.2. Market Segmentation
- 1.3. Research Objective
- 1.4. Definitions and Assumptions
- 2. Executive Summary
- 2.1. Market Snapshot
- 3. Market Dynamics
- 3.1. Market Drivers
- 3.2. Market Restrains
- 3.3. Market Trends
- 3.4. Market Opportunities
- 4. Market Factor Analysis
- 4.1. Porters Five Forces
- 4.1.1. Bargaining Power of Suppliers
- 4.1.2. Bargaining Power of Buyers
- 4.1.3. Threat of New Entrants
- 4.1.4. Threat of Substitutes
- 4.1.5. Competitive Rivalry
- 4.2. PESTEL analysis
- 4.3. BCG Analysis
- 4.3.1. Stars (High Growth, High Market Share)
- 4.3.2. Cash Cows (Low Growth, High Market Share)
- 4.3.3. Question Mark (High Growth, Low Market Share)
- 4.3.4. Dogs (Low Growth, Low Market Share)
- 4.4. Ansoff Matrix Analysis
- 4.5. Supply Chain Analysis
- 4.6. Regulatory Landscape
- 4.7. Current Market Potential and Opportunity Assessment (TAM–SAM–SOM Framework)
- 4.8. IMR Analyst Note
- 4.1. Porters Five Forces
- 5. Market Analysis, Insights and Forecast 2021-2033
- 5.1. Market Analysis, Insights and Forecast - by Technology
- 5.1.1. Parabolic Troughs
- 5.1.2. Fresnel Reflector
- 5.1.3. Power Tower
- 5.2. Market Analysis, Insights and Forecast - by Region
- 5.2.1. North America
- 5.2.2. Asia Pacific
- 5.2.3. Europe
- 5.2.4. South America
- 5.2.5. Middle East and Africa
- 5.1. Market Analysis, Insights and Forecast - by Technology
- 6. Global Molten Salt Thermal Energy Storage Industry Analysis, Insights and Forecast, 2021-2033
- 6.1. Market Analysis, Insights and Forecast - by Technology
- 6.1.1. Parabolic Troughs
- 6.1.2. Fresnel Reflector
- 6.1.3. Power Tower
- 6.1. Market Analysis, Insights and Forecast - by Technology
- 7. North America Molten Salt Thermal Energy Storage Industry Analysis, Insights and Forecast, 2020-2032
- 7.1. Market Analysis, Insights and Forecast - by Technology
- 7.1.1. Parabolic Troughs
- 7.1.2. Fresnel Reflector
- 7.1.3. Power Tower
- 7.1. Market Analysis, Insights and Forecast - by Technology
- 8. Asia Pacific Molten Salt Thermal Energy Storage Industry Analysis, Insights and Forecast, 2020-2032
- 8.1. Market Analysis, Insights and Forecast - by Technology
- 8.1.1. Parabolic Troughs
- 8.1.2. Fresnel Reflector
- 8.1.3. Power Tower
- 8.1. Market Analysis, Insights and Forecast - by Technology
- 9. Europe Molten Salt Thermal Energy Storage Industry Analysis, Insights and Forecast, 2020-2032
- 9.1. Market Analysis, Insights and Forecast - by Technology
- 9.1.1. Parabolic Troughs
- 9.1.2. Fresnel Reflector
- 9.1.3. Power Tower
- 9.1. Market Analysis, Insights and Forecast - by Technology
- 10. South America Molten Salt Thermal Energy Storage Industry Analysis, Insights and Forecast, 2020-2032
- 10.1. Market Analysis, Insights and Forecast - by Technology
- 10.1.1. Parabolic Troughs
- 10.1.2. Fresnel Reflector
- 10.1.3. Power Tower
- 10.1. Market Analysis, Insights and Forecast - by Technology
- 11. Middle East and Africa Molten Salt Thermal Energy Storage Industry Analysis, Insights and Forecast, 2020-2032
- 11.1. Market Analysis, Insights and Forecast - by Technology
- 11.1.1. Parabolic Troughs
- 11.1.2. Fresnel Reflector
- 11.1.3. Power Tower
- 11.1. Market Analysis, Insights and Forecast - by Technology
- 12. Competitive Analysis
- 12.1. Company Profiles
- 12.1.1 SCHOTT AG
- 12.1.1.1. Company Overview
- 12.1.1.2. Products
- 12.1.1.3. Company Financials
- 12.1.1.4. SWOT Analysis
- 12.1.2 SolarReserve LLC
- 12.1.2.1. Company Overview
- 12.1.2.2. Products
- 12.1.2.3. Company Financials
- 12.1.2.4. SWOT Analysis
- 12.1.3 Engie SA
- 12.1.3.1. Company Overview
- 12.1.3.2. Products
- 12.1.3.3. Company Financials
- 12.1.3.4. SWOT Analysis
- 12.1.4 SENER Grupo de Ingenieria S A
- 12.1.4.1. Company Overview
- 12.1.4.2. Products
- 12.1.4.3. Company Financials
- 12.1.4.4. SWOT Analysis
- 12.1.5 Acciona S A
- 12.1.5.1. Company Overview
- 12.1.5.2. Products
- 12.1.5.3. Company Financials
- 12.1.5.4. SWOT Analysis
- 12.1.6 Abengoa SA
- 12.1.6.1. Company Overview
- 12.1.6.2. Products
- 12.1.6.3. Company Financials
- 12.1.6.4. SWOT Analysis
- 12.1.7 Yara International ASA
- 12.1.7.1. Company Overview
- 12.1.7.2. Products
- 12.1.7.3. Company Financials
- 12.1.7.4. SWOT Analysis
- 12.1.8 BrightSource Energy Inc
- 12.1.8.1. Company Overview
- 12.1.8.2. Products
- 12.1.8.3. Company Financials
- 12.1.8.4. SWOT Analysis
- 12.1.1 SCHOTT AG
- 12.2. Market Entropy
- 12.2.1 Company's Key Areas Served
- 12.2.2 Recent Developments
- 12.3. Company Market Share Analysis 2025
- 12.3.1 Top 5 Companies Market Share Analysis
- 12.3.2 Top 3 Companies Market Share Analysis
- 12.4. List of Potential Customers
- 13. Research Methodology
List of Figures
- Figure 1: Global Molten Salt Thermal Energy Storage Industry Revenue Breakdown (billion, %) by Region 2025 & 2033
- Figure 2: North America Molten Salt Thermal Energy Storage Industry Revenue (billion), by Technology 2025 & 2033
- Figure 3: North America Molten Salt Thermal Energy Storage Industry Revenue Share (%), by Technology 2025 & 2033
- Figure 4: North America Molten Salt Thermal Energy Storage Industry Revenue (billion), by Country 2025 & 2033
- Figure 5: North America Molten Salt Thermal Energy Storage Industry Revenue Share (%), by Country 2025 & 2033
- Figure 6: Asia Pacific Molten Salt Thermal Energy Storage Industry Revenue (billion), by Technology 2025 & 2033
- Figure 7: Asia Pacific Molten Salt Thermal Energy Storage Industry Revenue Share (%), by Technology 2025 & 2033
- Figure 8: Asia Pacific Molten Salt Thermal Energy Storage Industry Revenue (billion), by Country 2025 & 2033
- Figure 9: Asia Pacific Molten Salt Thermal Energy Storage Industry Revenue Share (%), by Country 2025 & 2033
- Figure 10: Europe Molten Salt Thermal Energy Storage Industry Revenue (billion), by Technology 2025 & 2033
- Figure 11: Europe Molten Salt Thermal Energy Storage Industry Revenue Share (%), by Technology 2025 & 2033
- Figure 12: Europe Molten Salt Thermal Energy Storage Industry Revenue (billion), by Country 2025 & 2033
- Figure 13: Europe Molten Salt Thermal Energy Storage Industry Revenue Share (%), by Country 2025 & 2033
- Figure 14: South America Molten Salt Thermal Energy Storage Industry Revenue (billion), by Technology 2025 & 2033
- Figure 15: South America Molten Salt Thermal Energy Storage Industry Revenue Share (%), by Technology 2025 & 2033
- Figure 16: South America Molten Salt Thermal Energy Storage Industry Revenue (billion), by Country 2025 & 2033
- Figure 17: South America Molten Salt Thermal Energy Storage Industry Revenue Share (%), by Country 2025 & 2033
- Figure 18: Middle East and Africa Molten Salt Thermal Energy Storage Industry Revenue (billion), by Technology 2025 & 2033
- Figure 19: Middle East and Africa Molten Salt Thermal Energy Storage Industry Revenue Share (%), by Technology 2025 & 2033
- Figure 20: Middle East and Africa Molten Salt Thermal Energy Storage Industry Revenue (billion), by Country 2025 & 2033
- Figure 21: Middle East and Africa Molten Salt Thermal Energy Storage Industry Revenue Share (%), by Country 2025 & 2033
List of Tables
- Table 1: Global Molten Salt Thermal Energy Storage Industry Revenue billion Forecast, by Technology 2020 & 2033
- Table 2: Global Molten Salt Thermal Energy Storage Industry Revenue billion Forecast, by Region 2020 & 2033
- Table 3: Global Molten Salt Thermal Energy Storage Industry Revenue billion Forecast, by Technology 2020 & 2033
- Table 4: Global Molten Salt Thermal Energy Storage Industry Revenue billion Forecast, by Country 2020 & 2033
- Table 5: Global Molten Salt Thermal Energy Storage Industry Revenue billion Forecast, by Technology 2020 & 2033
- Table 6: Global Molten Salt Thermal Energy Storage Industry Revenue billion Forecast, by Country 2020 & 2033
- Table 7: Global Molten Salt Thermal Energy Storage Industry Revenue billion Forecast, by Technology 2020 & 2033
- Table 8: Global Molten Salt Thermal Energy Storage Industry Revenue billion Forecast, by Country 2020 & 2033
- Table 9: Global Molten Salt Thermal Energy Storage Industry Revenue billion Forecast, by Technology 2020 & 2033
- Table 10: Global Molten Salt Thermal Energy Storage Industry Revenue billion Forecast, by Country 2020 & 2033
- Table 11: Global Molten Salt Thermal Energy Storage Industry Revenue billion Forecast, by Technology 2020 & 2033
- Table 12: Global Molten Salt Thermal Energy Storage Industry Revenue billion Forecast, by Country 2020 & 2033
Frequently Asked Questions
1. What is the projected Compound Annual Growth Rate (CAGR) of the Molten Salt Thermal Energy Storage Industry?
The projected CAGR is approximately 9.8%.
2. Which companies are prominent players in the Molten Salt Thermal Energy Storage Industry?
Key companies in the market include SCHOTT AG, SolarReserve LLC, Engie SA, SENER Grupo de Ingenieria S A, Acciona S A, Abengoa SA, Yara International ASA, BrightSource Energy Inc.
3. What are the main segments of the Molten Salt Thermal Energy Storage Industry?
The market segments include Technology.
4. Can you provide details about the market size?
The market size is estimated to be USD 2.22 billion as of 2022.
5. What are some drivers contributing to market growth?
4.; Increasing Investments in Offshore Wind Power Projects4.; Supportive Government Policies.
6. What are the notable trends driving market growth?
Parabolic Trough Segment to Dominate the Market.
7. Are there any restraints impacting market growth?
4.; Increasing Adopting of Alternative Clean Energy Sources (Ex: Solar. Hydro).
8. Can you provide examples of recent developments in the market?
November 2022: Hyme Energy ApS announced that the company is partnering with Bornholms Energi & Forsyning (BEOF) to build its first molten salt thermal energy storage demonstrator on the Danish island of Bornholm. The storage facility is scheduled for completion in 2024 and will have a capacity of 1 MW/20 MWh. It will provide heat, power, and ancillary services to the local network.
9. What pricing options are available for accessing the report?
Pricing options include single-user, multi-user, and enterprise licenses priced at USD 4750, USD 5250, and USD 8750 respectively.
10. Is the market size provided in terms of value or volume?
The market size is provided in terms of value, measured in billion.
11. Are there any specific market keywords associated with the report?
Yes, the market keyword associated with the report is "Molten Salt Thermal Energy Storage Industry," which aids in identifying and referencing the specific market segment covered.
12. How do I determine which pricing option suits my needs best?
The pricing options vary based on user requirements and access needs. Individual users may opt for single-user licenses, while businesses requiring broader access may choose multi-user or enterprise licenses for cost-effective access to the report.
13. Are there any additional resources or data provided in the Molten Salt Thermal Energy Storage Industry report?
While the report offers comprehensive insights, it's advisable to review the specific contents or supplementary materials provided to ascertain if additional resources or data are available.
14. How can I stay updated on further developments or reports in the Molten Salt Thermal Energy Storage Industry?
To stay informed about further developments, trends, and reports in the Molten Salt Thermal Energy Storage Industry, consider subscribing to industry newsletters, following relevant companies and organizations, or regularly checking reputable industry news sources and publications.
Methodology
Step 1 - Identification of Relevant Samples Size from Population Database


Step 2 - Approaches for Defining Global Market Size (Value, Volume* & Price*)

Note*: In applicable scenarios
Step 3 - Data Sources
Primary Research
- Web Analytics
- Survey Reports
- Research Institute
- Latest Research Reports
- Opinion Leaders
Secondary Research
- Annual Reports
- White Paper
- Latest Press Release
- Industry Association
- Paid Database
- Investor Presentations

Step 4 - Data Triangulation
Involves using different sources of information in order to increase the validity of a study
These sources are likely to be stakeholders in a program - participants, other researchers, program staff, other community members, and so on.
Then we put all data in single framework & apply various statistical tools to find out the dynamic on the market.
During the analysis stage, feedback from the stakeholder groups would be compared to determine areas of agreement as well as areas of divergence