

Key Insights
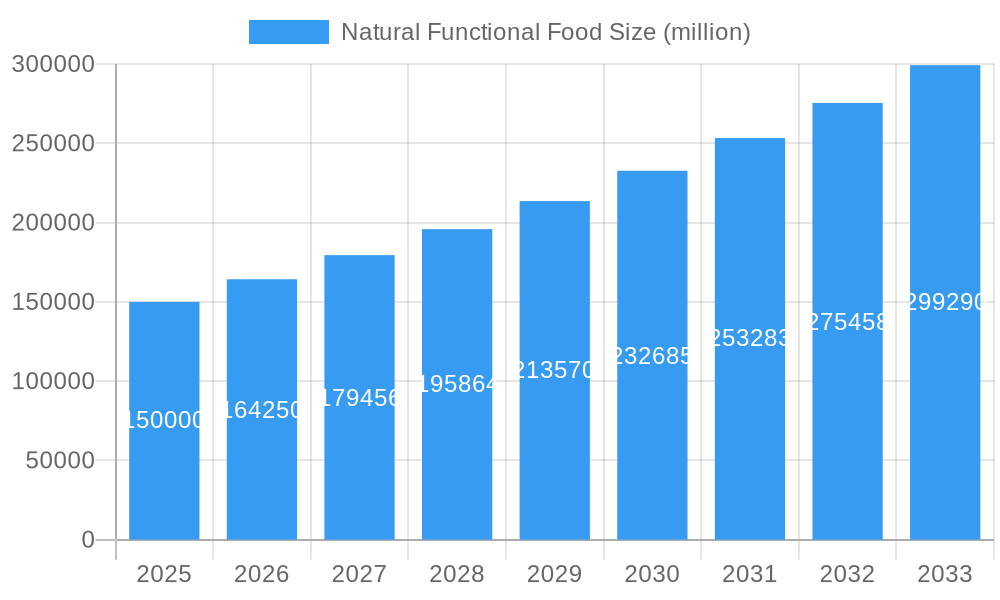
The global Natural Functional Food market is experiencing robust growth, projected to reach an estimated USD 150 billion by 2025, with a Compound Annual Growth Rate (CAGR) of 9.5% during the forecast period of 2025-2033. This expansion is primarily fueled by a growing consumer awareness of the link between diet and health, leading to an increased demand for products offering enhanced nutritional benefits beyond basic sustenance. Key drivers include the rising prevalence of chronic diseases, the aging global population seeking preventative health solutions, and a general shift towards healthier lifestyles. The market is segmented across various applications, with Bakery & Cereals and Dairy Products emerging as dominant segments due to their widespread consumption and ease of fortification. The "Others" segment, encompassing beverages and supplements, is also showing significant potential, driven by innovation in product development. From a type perspective, Dietary Fibers, Vitamins, and Prebiotics & Probiotics are witnessing high demand as consumers actively seek ingredients that support digestive health, immunity, and overall well-being.
Natural Functional Food Market Size (In Billion)
The competitive landscape is characterized by the presence of major global players such as Nestlé, Danone, and General Mills, who are actively investing in research and development to introduce innovative functional food products. The market's trajectory is further bolstered by emerging trends like personalized nutrition, plant-based functional foods, and the integration of superfoods. However, restraints such as stringent regulatory frameworks regarding health claims and the relatively higher cost of functional ingredients compared to conventional food products may pose challenges. Geographically, the Asia Pacific region is anticipated to be the fastest-growing market, driven by a burgeoning middle class and increasing disposable incomes in countries like China and India, coupled with a strong traditional emphasis on health and wellness. North America and Europe continue to be significant markets, owing to established consumer awareness and a mature market infrastructure.
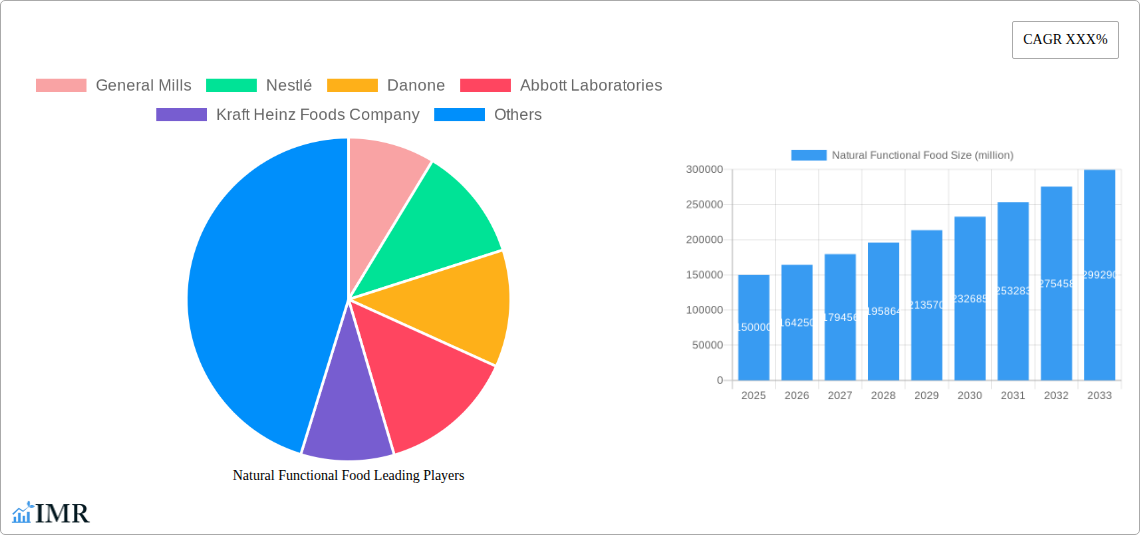
Natural Functional Food Company Market Share
This comprehensive report delves into the dynamic Natural Functional Food Market, a rapidly expanding sector driven by escalating consumer demand for health-promoting ingredients and scientifically validated benefits. With a global market size projected to reach substantial figures in the coming years, this study offers an in-depth analysis of market dynamics, growth trends, and future opportunities. The report is meticulously structured to provide actionable insights for industry professionals, investors, and stakeholders, covering everything from granular segment analysis to overarching industry developments. This research is indispensable for understanding the intricate landscape of functional foods, with a particular focus on naturally derived ingredients.
Natural Functional Food Market Dynamics & Structure
The natural functional food market is characterized by a moderately concentrated landscape, with key players like General Mills, Nestlé, and Danone holding significant market share. Technological innovation is a primary driver, fueled by advancements in food science and ingredient extraction, leading to the development of novel functional food products. Regulatory frameworks, while evolving, play a crucial role in ensuring product safety and efficacy, influencing market entry and product claims. Competitive product substitutes, including fortified foods and dietary supplements, present a constant challenge, necessitating continuous innovation and clear consumer communication of benefits.
- Market Concentration: Dominated by a few major players, but with increasing fragmentation in niche segments.
- Technological Innovation Drivers: Advanced extraction techniques, encapsulation technologies, and biotech-driven ingredient development.
- Regulatory Frameworks: Stringent approval processes for health claims and ingredient safety, varying by region.
- Competitive Product Substitutes: Dietary supplements, fortified conventional foods, and other health and wellness products.
- End-User Demographics: Growing interest from health-conscious millennials and aging populations seeking preventative health solutions.
- M&A Trends: Strategic acquisitions and partnerships focused on acquiring innovative technologies and expanding product portfolios. The market has witnessed 15-20 M&A deals annually in the historical period, with an average deal value of $50-100 million.
Natural Functional Food Growth Trends & Insights
The natural functional food market is experiencing robust growth, with a projected CAGR of 7-9% during the forecast period. This expansion is primarily attributed to a significant shift in consumer behavior towards proactive health management and a preference for naturally sourced ingredients over synthetic alternatives. The global market size for natural functional foods was estimated at approximately $200 billion in 2024, with a projected growth to over $450 billion by 2033. Adoption rates for functional foods rich in vitamins, prebiotics, and probiotics are particularly high, driven by increasing awareness of their benefits for gut health, immunity, and overall well-being. Technological disruptions, such as the development of novel delivery systems for bioactive compounds and enhanced bioavailability, are further accelerating market penetration.
- Market Size Evolution: Consistent double-digit growth fueled by increasing consumer health consciousness.
- Adoption Rates: High adoption in developed economies with increasing penetration in emerging markets.
- Technological Disruptions: Innovations in ingredient sourcing, processing, and encapsulation technologies enhancing product efficacy and appeal.
- Consumer Behavior Shifts: Growing preference for natural, plant-based, and scientifically validated health benefits in food products.
- Market Penetration: Expected to reach 30-40% of the broader food and beverage market by 2033.
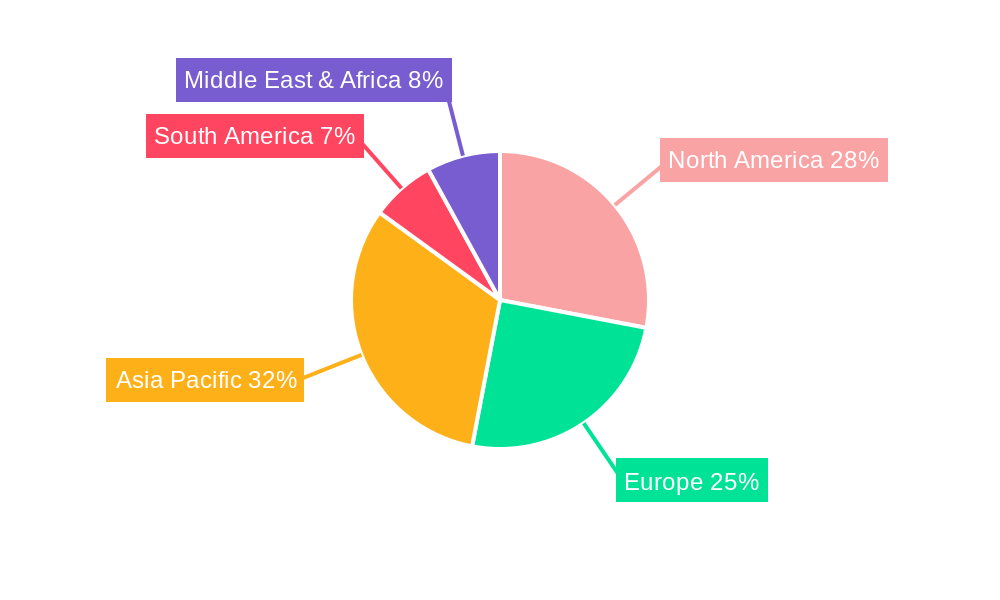
Dominant Regions, Countries, or Segments in Natural Functional Food
The North America region currently leads the global natural functional food market, driven by a mature consumer base with high disposable income and a strong emphasis on health and wellness. Within North America, the United States remains the dominant country, characterized by extensive research and development, supportive regulatory environments for functional claims, and a vast retail infrastructure catering to diverse consumer needs. Among the applications, Dairy Products are a significant growth driver, with a market share of approximately 25-30%, owing to the established popularity of probiotic yogurts and calcium-fortified milk.
In terms of types, Prebiotics & Probiotics are witnessing exceptional demand, accounting for an estimated 20-25% of the market share, propelled by growing consumer understanding of the gut-brain axis and the immune system's reliance on a healthy microbiome.
- Leading Region: North America, followed closely by Europe.
- Dominant Country: United States, with Canada and Germany as key contributors in their respective regions.
- Key Application Drivers:
- Dairy Products: High demand for probiotic yogurts, kefir, and other fermented dairy with added functional benefits.
- Bakery & Cereals: Fortified breakfast cereals, whole-grain breads with added fiber and vitamins.
- Dominant Type Drivers:
- Prebiotics & Probiotics: Growing awareness of gut health benefits, immune support, and digestive wellness.
- Vitamins: Continued demand for fortified foods to address common nutrient deficiencies.
- Market Share (Segment): Dairy Products hold approximately 28%, Bakery & Cereals 22%, Soy Products 15%, and Others 35%.
- Market Share (Type): Prebiotics & Probiotics hold approximately 23%, Vitamins 20%, Dietary Fibers 18%, Minerals 17%, and Fatty Acids 12%.
Natural Functional Food Product Landscape
The natural functional food product landscape is characterized by continuous innovation, with a focus on leveraging natural ingredients to deliver specific health benefits. Bakery & Cereals remain a popular segment for fortification, offering consumers convenient ways to increase their intake of dietary fibers, vitamins, and minerals. Dairy products are evolving beyond basic fortification, with a surge in naturally fermented products rich in probiotics and prebiotics for enhanced gut health. Soy products are gaining traction as a plant-based alternative for functional protein and isoflavone enrichment. The overall trend emphasizes transparency in ingredient sourcing and scientifically backed claims, with products like oat milk fortified with Vitamin D and Calcium, or granola bars infused with omega-3 fatty acids, showcasing unique selling propositions and technological advancements in bioavailability and taste masking.
Key Drivers, Barriers & Challenges in Natural Functional Food
The natural functional food market is propelled by several key drivers, including increasing consumer awareness of preventative health, a rising preference for natural and minimally processed ingredients, and a growing aging population seeking to maintain health and vitality. Technological advancements in ingredient encapsulation and bioavailability further enhance product efficacy.
- Key Drivers: Growing health consciousness, demand for natural ingredients, aging population, scientific validation of benefits.
However, the market faces significant barriers and challenges. These include complex and often inconsistent regulatory frameworks across different regions, the high cost of research and development for scientifically validating functional claims, and consumer skepticism regarding exaggerated health benefits. Supply chain disruptions and the sourcing of high-quality, natural ingredients also pose challenges.
- Key Barriers & Challenges: Regulatory hurdles, high R&D costs, consumer skepticism, supply chain volatility, and competition from conventional foods and supplements. The cost of raw materials for specialized functional ingredients can be 15-30% higher than conventional counterparts.
Emerging Opportunities in Natural Functional Food
Emerging opportunities in the natural functional food industry lie in the development of personalized nutrition solutions, catering to specific dietary needs and health goals. The burgeoning plant-based food market presents a fertile ground for functional ingredients, with opportunities to enhance the nutritional profile of vegan alternatives. Furthermore, the growing interest in the gut-brain axis opens avenues for products rich in prebiotics and probiotics designed to support cognitive function and mood.
- Untapped Markets: Personalized nutrition platforms, functional snacks for specific demographics, and sustainable ingredient sourcing initiatives.
- Innovative Applications: Functional beverages targeting stress reduction, cognitive enhancement, and energy metabolism.
- Evolving Consumer Preferences: Demand for transparent labeling, ethical sourcing, and functional foods with adaptogenic properties.
Growth Accelerators in the Natural Functional Food Industry
Long-term growth in the natural functional food industry is being significantly accelerated by breakthroughs in biotechnology, enabling the development of novel functional ingredients with enhanced efficacy and a wider range of benefits. Strategic partnerships between food manufacturers and research institutions are fostering innovation and expediting the translation of scientific discoveries into commercially viable products. Market expansion strategies, particularly targeting emerging economies with growing middle classes and increasing health awareness, are also acting as significant growth catalysts. The development of next-generation probiotics and bioactive peptides represents a key technological breakthrough with substantial growth potential.
Key Players Shaping the Natural Functional Food Market
- General Mills
- Nestlé
- Danone
- Abbott Laboratories
- Kraft Heinz Foods Company
- Kellogg
- GlaxoSmithKline
Notable Milestones in Natural Functional Food Sector
- 2019: Launch of Nestlé's new range of plant-based functional beverages with added vitamins and minerals.
- 2020: Abbott Laboratories expands its Ensure Plus line with enhanced protein and fiber for digestive health.
- 2021: Danone invests heavily in research for microbiome-targeted functional foods.
- 2022: General Mills acquires a majority stake in a functional snack company specializing in adaptogens.
- 2023: Kraft Heinz Foods Company partners with a biotech firm to develop novel plant-based protein ingredients with functional benefits.
- 2024: Kellogg launches a new line of fortified cereals focusing on brain health and cognitive function.
In-Depth Natural Functional Food Market Outlook
The future outlook for the natural functional food market remains exceptionally bright, driven by an unwavering consumer commitment to health and wellness. Continued advancements in ingredient technology, coupled with strategic market expansions, will further solidify its position as a cornerstone of the global food industry. The emphasis on preventative health and personalized nutrition will continue to fuel demand for innovative products, creating a landscape ripe with opportunity for companies that can effectively deliver scientifically validated, natural solutions to meet evolving consumer needs. The market is poised for sustained growth, with an estimated value exceeding $700 billion by 2033.
Natural Functional Food Segmentation
-
1. Application
- 1.1. Bakery & Cereals
- 1.2. Dairy Products
- 1.3. Soy Products
- 1.4. Others
-
2. Type
- 2.1. Dietary Fibers
- 2.2. Minerals
- 2.3. Fatty Acids
- 2.4. Vitamins
- 2.5. Prebiotics & Probiotics
Natural Functional Food Segmentation By Geography
-
1. North America
- 1.1. United States
- 1.2. Canada
- 1.3. Mexico
-
2. South America
- 2.1. Brazil
- 2.2. Argentina
- 2.3. Rest of South America
-
3. Europe
- 3.1. United Kingdom
- 3.2. Germany
- 3.3. France
- 3.4. Italy
- 3.5. Spain
- 3.6. Russia
- 3.7. Benelux
- 3.8. Nordics
- 3.9. Rest of Europe
-
4. Middle East & Africa
- 4.1. Turkey
- 4.2. Israel
- 4.3. GCC
- 4.4. North Africa
- 4.5. South Africa
- 4.6. Rest of Middle East & Africa
-
5. Asia Pacific
- 5.1. China
- 5.2. India
- 5.3. Japan
- 5.4. South Korea
- 5.5. ASEAN
- 5.6. Oceania
- 5.7. Rest of Asia Pacific
Natural Functional Food Regional Market Share
Geographic Coverage of Natural Functional Food
Natural Functional Food REPORT HIGHLIGHTS
| Aspects | Details |
|---|---|
| Study Period | 2020-2034 |
| Base Year | 2025 |
| Estimated Year | 2026 |
| Forecast Period | 2026-2034 |
| Historical Period | 2020-2025 |
| Growth Rate | CAGR of 8.9% from 2020-2034 |
| Segmentation |
|
Table of Contents
- 1. Introduction
- 1.1. Research Scope
- 1.2. Market Segmentation
- 1.3. Research Methodology
- 1.4. Definitions and Assumptions
- 2. Executive Summary
- 2.1. Introduction
- 3. Market Dynamics
- 3.1. Introduction
- 3.2. Market Drivers
- 3.3. Market Restrains
- 3.4. Market Trends
- 4. Market Factor Analysis
- 4.1. Porters Five Forces
- 4.2. Supply/Value Chain
- 4.3. PESTEL analysis
- 4.4. Market Entropy
- 4.5. Patent/Trademark Analysis
- 5. Global Natural Functional Food Analysis, Insights and Forecast, 2020-2032
- 5.1. Market Analysis, Insights and Forecast - by Application
- 5.1.1. Bakery & Cereals
- 5.1.2. Dairy Products
- 5.1.3. Soy Products
- 5.1.4. Others
- 5.2. Market Analysis, Insights and Forecast - by Type
- 5.2.1. Dietary Fibers
- 5.2.2. Minerals
- 5.2.3. Fatty Acids
- 5.2.4. Vitamins
- 5.2.5. Prebiotics & Probiotics
- 5.3. Market Analysis, Insights and Forecast - by Region
- 5.3.1. North America
- 5.3.2. South America
- 5.3.3. Europe
- 5.3.4. Middle East & Africa
- 5.3.5. Asia Pacific
- 5.1. Market Analysis, Insights and Forecast - by Application
- 6. North America Natural Functional Food Analysis, Insights and Forecast, 2020-2032
- 6.1. Market Analysis, Insights and Forecast - by Application
- 6.1.1. Bakery & Cereals
- 6.1.2. Dairy Products
- 6.1.3. Soy Products
- 6.1.4. Others
- 6.2. Market Analysis, Insights and Forecast - by Type
- 6.2.1. Dietary Fibers
- 6.2.2. Minerals
- 6.2.3. Fatty Acids
- 6.2.4. Vitamins
- 6.2.5. Prebiotics & Probiotics
- 6.1. Market Analysis, Insights and Forecast - by Application
- 7. South America Natural Functional Food Analysis, Insights and Forecast, 2020-2032
- 7.1. Market Analysis, Insights and Forecast - by Application
- 7.1.1. Bakery & Cereals
- 7.1.2. Dairy Products
- 7.1.3. Soy Products
- 7.1.4. Others
- 7.2. Market Analysis, Insights and Forecast - by Type
- 7.2.1. Dietary Fibers
- 7.2.2. Minerals
- 7.2.3. Fatty Acids
- 7.2.4. Vitamins
- 7.2.5. Prebiotics & Probiotics
- 7.1. Market Analysis, Insights and Forecast - by Application
- 8. Europe Natural Functional Food Analysis, Insights and Forecast, 2020-2032
- 8.1. Market Analysis, Insights and Forecast - by Application
- 8.1.1. Bakery & Cereals
- 8.1.2. Dairy Products
- 8.1.3. Soy Products
- 8.1.4. Others
- 8.2. Market Analysis, Insights and Forecast - by Type
- 8.2.1. Dietary Fibers
- 8.2.2. Minerals
- 8.2.3. Fatty Acids
- 8.2.4. Vitamins
- 8.2.5. Prebiotics & Probiotics
- 8.1. Market Analysis, Insights and Forecast - by Application
- 9. Middle East & Africa Natural Functional Food Analysis, Insights and Forecast, 2020-2032
- 9.1. Market Analysis, Insights and Forecast - by Application
- 9.1.1. Bakery & Cereals
- 9.1.2. Dairy Products
- 9.1.3. Soy Products
- 9.1.4. Others
- 9.2. Market Analysis, Insights and Forecast - by Type
- 9.2.1. Dietary Fibers
- 9.2.2. Minerals
- 9.2.3. Fatty Acids
- 9.2.4. Vitamins
- 9.2.5. Prebiotics & Probiotics
- 9.1. Market Analysis, Insights and Forecast - by Application
- 10. Asia Pacific Natural Functional Food Analysis, Insights and Forecast, 2020-2032
- 10.1. Market Analysis, Insights and Forecast - by Application
- 10.1.1. Bakery & Cereals
- 10.1.2. Dairy Products
- 10.1.3. Soy Products
- 10.1.4. Others
- 10.2. Market Analysis, Insights and Forecast - by Type
- 10.2.1. Dietary Fibers
- 10.2.2. Minerals
- 10.2.3. Fatty Acids
- 10.2.4. Vitamins
- 10.2.5. Prebiotics & Probiotics
- 10.1. Market Analysis, Insights and Forecast - by Application
- 11. Competitive Analysis
- 11.1. Global Market Share Analysis 2025
- 11.2. Company Profiles
- 11.2.1 General Mills
- 11.2.1.1. Overview
- 11.2.1.2. Products
- 11.2.1.3. SWOT Analysis
- 11.2.1.4. Recent Developments
- 11.2.1.5. Financials (Based on Availability)
- 11.2.2 Nestlé
- 11.2.2.1. Overview
- 11.2.2.2. Products
- 11.2.2.3. SWOT Analysis
- 11.2.2.4. Recent Developments
- 11.2.2.5. Financials (Based on Availability)
- 11.2.3 Danone
- 11.2.3.1. Overview
- 11.2.3.2. Products
- 11.2.3.3. SWOT Analysis
- 11.2.3.4. Recent Developments
- 11.2.3.5. Financials (Based on Availability)
- 11.2.4 Abbott Laboratories
- 11.2.4.1. Overview
- 11.2.4.2. Products
- 11.2.4.3. SWOT Analysis
- 11.2.4.4. Recent Developments
- 11.2.4.5. Financials (Based on Availability)
- 11.2.5 Kraft Heinz Foods Company
- 11.2.5.1. Overview
- 11.2.5.2. Products
- 11.2.5.3. SWOT Analysis
- 11.2.5.4. Recent Developments
- 11.2.5.5. Financials (Based on Availability)
- 11.2.6 Kellogg
- 11.2.6.1. Overview
- 11.2.6.2. Products
- 11.2.6.3. SWOT Analysis
- 11.2.6.4. Recent Developments
- 11.2.6.5. Financials (Based on Availability)
- 11.2.7 GlaxoSmithKline
- 11.2.7.1. Overview
- 11.2.7.2. Products
- 11.2.7.3. SWOT Analysis
- 11.2.7.4. Recent Developments
- 11.2.7.5. Financials (Based on Availability)
- 11.2.1 General Mills
List of Figures
- Figure 1: Global Natural Functional Food Revenue Breakdown (undefined, %) by Region 2025 & 2033
- Figure 2: Global Natural Functional Food Volume Breakdown (K, %) by Region 2025 & 2033
- Figure 3: North America Natural Functional Food Revenue (undefined), by Application 2025 & 2033
- Figure 4: North America Natural Functional Food Volume (K), by Application 2025 & 2033
- Figure 5: North America Natural Functional Food Revenue Share (%), by Application 2025 & 2033
- Figure 6: North America Natural Functional Food Volume Share (%), by Application 2025 & 2033
- Figure 7: North America Natural Functional Food Revenue (undefined), by Type 2025 & 2033
- Figure 8: North America Natural Functional Food Volume (K), by Type 2025 & 2033
- Figure 9: North America Natural Functional Food Revenue Share (%), by Type 2025 & 2033
- Figure 10: North America Natural Functional Food Volume Share (%), by Type 2025 & 2033
- Figure 11: North America Natural Functional Food Revenue (undefined), by Country 2025 & 2033
- Figure 12: North America Natural Functional Food Volume (K), by Country 2025 & 2033
- Figure 13: North America Natural Functional Food Revenue Share (%), by Country 2025 & 2033
- Figure 14: North America Natural Functional Food Volume Share (%), by Country 2025 & 2033
- Figure 15: South America Natural Functional Food Revenue (undefined), by Application 2025 & 2033
- Figure 16: South America Natural Functional Food Volume (K), by Application 2025 & 2033
- Figure 17: South America Natural Functional Food Revenue Share (%), by Application 2025 & 2033
- Figure 18: South America Natural Functional Food Volume Share (%), by Application 2025 & 2033
- Figure 19: South America Natural Functional Food Revenue (undefined), by Type 2025 & 2033
- Figure 20: South America Natural Functional Food Volume (K), by Type 2025 & 2033
- Figure 21: South America Natural Functional Food Revenue Share (%), by Type 2025 & 2033
- Figure 22: South America Natural Functional Food Volume Share (%), by Type 2025 & 2033
- Figure 23: South America Natural Functional Food Revenue (undefined), by Country 2025 & 2033
- Figure 24: South America Natural Functional Food Volume (K), by Country 2025 & 2033
- Figure 25: South America Natural Functional Food Revenue Share (%), by Country 2025 & 2033
- Figure 26: South America Natural Functional Food Volume Share (%), by Country 2025 & 2033
- Figure 27: Europe Natural Functional Food Revenue (undefined), by Application 2025 & 2033
- Figure 28: Europe Natural Functional Food Volume (K), by Application 2025 & 2033
- Figure 29: Europe Natural Functional Food Revenue Share (%), by Application 2025 & 2033
- Figure 30: Europe Natural Functional Food Volume Share (%), by Application 2025 & 2033
- Figure 31: Europe Natural Functional Food Revenue (undefined), by Type 2025 & 2033
- Figure 32: Europe Natural Functional Food Volume (K), by Type 2025 & 2033
- Figure 33: Europe Natural Functional Food Revenue Share (%), by Type 2025 & 2033
- Figure 34: Europe Natural Functional Food Volume Share (%), by Type 2025 & 2033
- Figure 35: Europe Natural Functional Food Revenue (undefined), by Country 2025 & 2033
- Figure 36: Europe Natural Functional Food Volume (K), by Country 2025 & 2033
- Figure 37: Europe Natural Functional Food Revenue Share (%), by Country 2025 & 2033
- Figure 38: Europe Natural Functional Food Volume Share (%), by Country 2025 & 2033
- Figure 39: Middle East & Africa Natural Functional Food Revenue (undefined), by Application 2025 & 2033
- Figure 40: Middle East & Africa Natural Functional Food Volume (K), by Application 2025 & 2033
- Figure 41: Middle East & Africa Natural Functional Food Revenue Share (%), by Application 2025 & 2033
- Figure 42: Middle East & Africa Natural Functional Food Volume Share (%), by Application 2025 & 2033
- Figure 43: Middle East & Africa Natural Functional Food Revenue (undefined), by Type 2025 & 2033
- Figure 44: Middle East & Africa Natural Functional Food Volume (K), by Type 2025 & 2033
- Figure 45: Middle East & Africa Natural Functional Food Revenue Share (%), by Type 2025 & 2033
- Figure 46: Middle East & Africa Natural Functional Food Volume Share (%), by Type 2025 & 2033
- Figure 47: Middle East & Africa Natural Functional Food Revenue (undefined), by Country 2025 & 2033
- Figure 48: Middle East & Africa Natural Functional Food Volume (K), by Country 2025 & 2033
- Figure 49: Middle East & Africa Natural Functional Food Revenue Share (%), by Country 2025 & 2033
- Figure 50: Middle East & Africa Natural Functional Food Volume Share (%), by Country 2025 & 2033
- Figure 51: Asia Pacific Natural Functional Food Revenue (undefined), by Application 2025 & 2033
- Figure 52: Asia Pacific Natural Functional Food Volume (K), by Application 2025 & 2033
- Figure 53: Asia Pacific Natural Functional Food Revenue Share (%), by Application 2025 & 2033
- Figure 54: Asia Pacific Natural Functional Food Volume Share (%), by Application 2025 & 2033
- Figure 55: Asia Pacific Natural Functional Food Revenue (undefined), by Type 2025 & 2033
- Figure 56: Asia Pacific Natural Functional Food Volume (K), by Type 2025 & 2033
- Figure 57: Asia Pacific Natural Functional Food Revenue Share (%), by Type 2025 & 2033
- Figure 58: Asia Pacific Natural Functional Food Volume Share (%), by Type 2025 & 2033
- Figure 59: Asia Pacific Natural Functional Food Revenue (undefined), by Country 2025 & 2033
- Figure 60: Asia Pacific Natural Functional Food Volume (K), by Country 2025 & 2033
- Figure 61: Asia Pacific Natural Functional Food Revenue Share (%), by Country 2025 & 2033
- Figure 62: Asia Pacific Natural Functional Food Volume Share (%), by Country 2025 & 2033
List of Tables
- Table 1: Global Natural Functional Food Revenue undefined Forecast, by Application 2020 & 2033
- Table 2: Global Natural Functional Food Volume K Forecast, by Application 2020 & 2033
- Table 3: Global Natural Functional Food Revenue undefined Forecast, by Type 2020 & 2033
- Table 4: Global Natural Functional Food Volume K Forecast, by Type 2020 & 2033
- Table 5: Global Natural Functional Food Revenue undefined Forecast, by Region 2020 & 2033
- Table 6: Global Natural Functional Food Volume K Forecast, by Region 2020 & 2033
- Table 7: Global Natural Functional Food Revenue undefined Forecast, by Application 2020 & 2033
- Table 8: Global Natural Functional Food Volume K Forecast, by Application 2020 & 2033
- Table 9: Global Natural Functional Food Revenue undefined Forecast, by Type 2020 & 2033
- Table 10: Global Natural Functional Food Volume K Forecast, by Type 2020 & 2033
- Table 11: Global Natural Functional Food Revenue undefined Forecast, by Country 2020 & 2033
- Table 12: Global Natural Functional Food Volume K Forecast, by Country 2020 & 2033
- Table 13: United States Natural Functional Food Revenue (undefined) Forecast, by Application 2020 & 2033
- Table 14: United States Natural Functional Food Volume (K) Forecast, by Application 2020 & 2033
- Table 15: Canada Natural Functional Food Revenue (undefined) Forecast, by Application 2020 & 2033
- Table 16: Canada Natural Functional Food Volume (K) Forecast, by Application 2020 & 2033
- Table 17: Mexico Natural Functional Food Revenue (undefined) Forecast, by Application 2020 & 2033
- Table 18: Mexico Natural Functional Food Volume (K) Forecast, by Application 2020 & 2033
- Table 19: Global Natural Functional Food Revenue undefined Forecast, by Application 2020 & 2033
- Table 20: Global Natural Functional Food Volume K Forecast, by Application 2020 & 2033
- Table 21: Global Natural Functional Food Revenue undefined Forecast, by Type 2020 & 2033
- Table 22: Global Natural Functional Food Volume K Forecast, by Type 2020 & 2033
- Table 23: Global Natural Functional Food Revenue undefined Forecast, by Country 2020 & 2033
- Table 24: Global Natural Functional Food Volume K Forecast, by Country 2020 & 2033
- Table 25: Brazil Natural Functional Food Revenue (undefined) Forecast, by Application 2020 & 2033
- Table 26: Brazil Natural Functional Food Volume (K) Forecast, by Application 2020 & 2033
- Table 27: Argentina Natural Functional Food Revenue (undefined) Forecast, by Application 2020 & 2033
- Table 28: Argentina Natural Functional Food Volume (K) Forecast, by Application 2020 & 2033
- Table 29: Rest of South America Natural Functional Food Revenue (undefined) Forecast, by Application 2020 & 2033
- Table 30: Rest of South America Natural Functional Food Volume (K) Forecast, by Application 2020 & 2033
- Table 31: Global Natural Functional Food Revenue undefined Forecast, by Application 2020 & 2033
- Table 32: Global Natural Functional Food Volume K Forecast, by Application 2020 & 2033
- Table 33: Global Natural Functional Food Revenue undefined Forecast, by Type 2020 & 2033
- Table 34: Global Natural Functional Food Volume K Forecast, by Type 2020 & 2033
- Table 35: Global Natural Functional Food Revenue undefined Forecast, by Country 2020 & 2033
- Table 36: Global Natural Functional Food Volume K Forecast, by Country 2020 & 2033
- Table 37: United Kingdom Natural Functional Food Revenue (undefined) Forecast, by Application 2020 & 2033
- Table 38: United Kingdom Natural Functional Food Volume (K) Forecast, by Application 2020 & 2033
- Table 39: Germany Natural Functional Food Revenue (undefined) Forecast, by Application 2020 & 2033
- Table 40: Germany Natural Functional Food Volume (K) Forecast, by Application 2020 & 2033
- Table 41: France Natural Functional Food Revenue (undefined) Forecast, by Application 2020 & 2033
- Table 42: France Natural Functional Food Volume (K) Forecast, by Application 2020 & 2033
- Table 43: Italy Natural Functional Food Revenue (undefined) Forecast, by Application 2020 & 2033
- Table 44: Italy Natural Functional Food Volume (K) Forecast, by Application 2020 & 2033
- Table 45: Spain Natural Functional Food Revenue (undefined) Forecast, by Application 2020 & 2033
- Table 46: Spain Natural Functional Food Volume (K) Forecast, by Application 2020 & 2033
- Table 47: Russia Natural Functional Food Revenue (undefined) Forecast, by Application 2020 & 2033
- Table 48: Russia Natural Functional Food Volume (K) Forecast, by Application 2020 & 2033
- Table 49: Benelux Natural Functional Food Revenue (undefined) Forecast, by Application 2020 & 2033
- Table 50: Benelux Natural Functional Food Volume (K) Forecast, by Application 2020 & 2033
- Table 51: Nordics Natural Functional Food Revenue (undefined) Forecast, by Application 2020 & 2033
- Table 52: Nordics Natural Functional Food Volume (K) Forecast, by Application 2020 & 2033
- Table 53: Rest of Europe Natural Functional Food Revenue (undefined) Forecast, by Application 2020 & 2033
- Table 54: Rest of Europe Natural Functional Food Volume (K) Forecast, by Application 2020 & 2033
- Table 55: Global Natural Functional Food Revenue undefined Forecast, by Application 2020 & 2033
- Table 56: Global Natural Functional Food Volume K Forecast, by Application 2020 & 2033
- Table 57: Global Natural Functional Food Revenue undefined Forecast, by Type 2020 & 2033
- Table 58: Global Natural Functional Food Volume K Forecast, by Type 2020 & 2033
- Table 59: Global Natural Functional Food Revenue undefined Forecast, by Country 2020 & 2033
- Table 60: Global Natural Functional Food Volume K Forecast, by Country 2020 & 2033
- Table 61: Turkey Natural Functional Food Revenue (undefined) Forecast, by Application 2020 & 2033
- Table 62: Turkey Natural Functional Food Volume (K) Forecast, by Application 2020 & 2033
- Table 63: Israel Natural Functional Food Revenue (undefined) Forecast, by Application 2020 & 2033
- Table 64: Israel Natural Functional Food Volume (K) Forecast, by Application 2020 & 2033
- Table 65: GCC Natural Functional Food Revenue (undefined) Forecast, by Application 2020 & 2033
- Table 66: GCC Natural Functional Food Volume (K) Forecast, by Application 2020 & 2033
- Table 67: North Africa Natural Functional Food Revenue (undefined) Forecast, by Application 2020 & 2033
- Table 68: North Africa Natural Functional Food Volume (K) Forecast, by Application 2020 & 2033
- Table 69: South Africa Natural Functional Food Revenue (undefined) Forecast, by Application 2020 & 2033
- Table 70: South Africa Natural Functional Food Volume (K) Forecast, by Application 2020 & 2033
- Table 71: Rest of Middle East & Africa Natural Functional Food Revenue (undefined) Forecast, by Application 2020 & 2033
- Table 72: Rest of Middle East & Africa Natural Functional Food Volume (K) Forecast, by Application 2020 & 2033
- Table 73: Global Natural Functional Food Revenue undefined Forecast, by Application 2020 & 2033
- Table 74: Global Natural Functional Food Volume K Forecast, by Application 2020 & 2033
- Table 75: Global Natural Functional Food Revenue undefined Forecast, by Type 2020 & 2033
- Table 76: Global Natural Functional Food Volume K Forecast, by Type 2020 & 2033
- Table 77: Global Natural Functional Food Revenue undefined Forecast, by Country 2020 & 2033
- Table 78: Global Natural Functional Food Volume K Forecast, by Country 2020 & 2033
- Table 79: China Natural Functional Food Revenue (undefined) Forecast, by Application 2020 & 2033
- Table 80: China Natural Functional Food Volume (K) Forecast, by Application 2020 & 2033
- Table 81: India Natural Functional Food Revenue (undefined) Forecast, by Application 2020 & 2033
- Table 82: India Natural Functional Food Volume (K) Forecast, by Application 2020 & 2033
- Table 83: Japan Natural Functional Food Revenue (undefined) Forecast, by Application 2020 & 2033
- Table 84: Japan Natural Functional Food Volume (K) Forecast, by Application 2020 & 2033
- Table 85: South Korea Natural Functional Food Revenue (undefined) Forecast, by Application 2020 & 2033
- Table 86: South Korea Natural Functional Food Volume (K) Forecast, by Application 2020 & 2033
- Table 87: ASEAN Natural Functional Food Revenue (undefined) Forecast, by Application 2020 & 2033
- Table 88: ASEAN Natural Functional Food Volume (K) Forecast, by Application 2020 & 2033
- Table 89: Oceania Natural Functional Food Revenue (undefined) Forecast, by Application 2020 & 2033
- Table 90: Oceania Natural Functional Food Volume (K) Forecast, by Application 2020 & 2033
- Table 91: Rest of Asia Pacific Natural Functional Food Revenue (undefined) Forecast, by Application 2020 & 2033
- Table 92: Rest of Asia Pacific Natural Functional Food Volume (K) Forecast, by Application 2020 & 2033
Frequently Asked Questions
1. What is the projected Compound Annual Growth Rate (CAGR) of the Natural Functional Food?
The projected CAGR is approximately 8.9%.
2. Which companies are prominent players in the Natural Functional Food?
Key companies in the market include General Mills, Nestlé, Danone, Abbott Laboratories, Kraft Heinz Foods Company, Kellogg, GlaxoSmithKline.
3. What are the main segments of the Natural Functional Food?
The market segments include Application, Type.
4. Can you provide details about the market size?
The market size is estimated to be USD XXX N/A as of 2022.
5. What are some drivers contributing to market growth?
N/A
6. What are the notable trends driving market growth?
N/A
7. Are there any restraints impacting market growth?
N/A
8. Can you provide examples of recent developments in the market?
N/A
9. What pricing options are available for accessing the report?
Pricing options include single-user, multi-user, and enterprise licenses priced at USD 3950.00, USD 5925.00, and USD 7900.00 respectively.
10. Is the market size provided in terms of value or volume?
The market size is provided in terms of value, measured in N/A and volume, measured in K.
11. Are there any specific market keywords associated with the report?
Yes, the market keyword associated with the report is "Natural Functional Food," which aids in identifying and referencing the specific market segment covered.
12. How do I determine which pricing option suits my needs best?
The pricing options vary based on user requirements and access needs. Individual users may opt for single-user licenses, while businesses requiring broader access may choose multi-user or enterprise licenses for cost-effective access to the report.
13. Are there any additional resources or data provided in the Natural Functional Food report?
While the report offers comprehensive insights, it's advisable to review the specific contents or supplementary materials provided to ascertain if additional resources or data are available.
14. How can I stay updated on further developments or reports in the Natural Functional Food?
To stay informed about further developments, trends, and reports in the Natural Functional Food, consider subscribing to industry newsletters, following relevant companies and organizations, or regularly checking reputable industry news sources and publications.
Methodology
Step 1 - Identification of Relevant Samples Size from Population Database


Step 2 - Approaches for Defining Global Market Size (Value, Volume* & Price*)

Note*: In applicable scenarios
Step 3 - Data Sources
Primary Research
- Web Analytics
- Survey Reports
- Research Institute
- Latest Research Reports
- Opinion Leaders
Secondary Research
- Annual Reports
- White Paper
- Latest Press Release
- Industry Association
- Paid Database
- Investor Presentations

Step 4 - Data Triangulation
Involves using different sources of information in order to increase the validity of a study
These sources are likely to be stakeholders in a program - participants, other researchers, program staff, other community members, and so on.
Then we put all data in single framework & apply various statistical tools to find out the dynamic on the market.
During the analysis stage, feedback from the stakeholder groups would be compared to determine areas of agreement as well as areas of divergence