

Key Insights
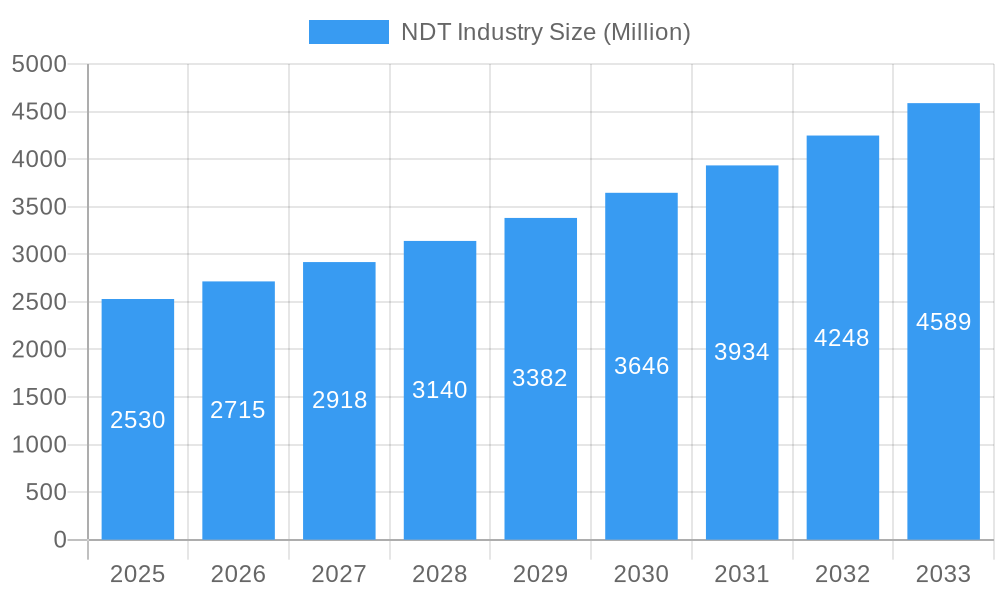
The Non-Destructive Testing (NDT) market, valued at $2.53 billion in 2025, is projected to experience robust growth, driven by increasing demand across diverse sectors. A compound annual growth rate (CAGR) of 7.35% from 2025 to 2033 indicates significant expansion, fueled by several key factors. The rising need for infrastructure maintenance and renewal, particularly in developed nations, is a primary driver. Stringent safety regulations across industries like aerospace, automotive, and energy necessitate rigorous quality control, boosting the adoption of NDT techniques. Furthermore, advancements in testing technologies, including the development of more efficient and portable equipment, are contributing to market expansion. The shift towards automation and digitalization within NDT procedures further enhances productivity and accuracy, making it more appealing to businesses. Growth is expected to be particularly strong in the Asia-Pacific region, driven by rapid industrialization and infrastructure development in countries like China and India. While economic fluctuations can present temporary restraints, the long-term outlook for the NDT market remains positive, driven by the enduring demand for reliable quality assurance and safety measures.
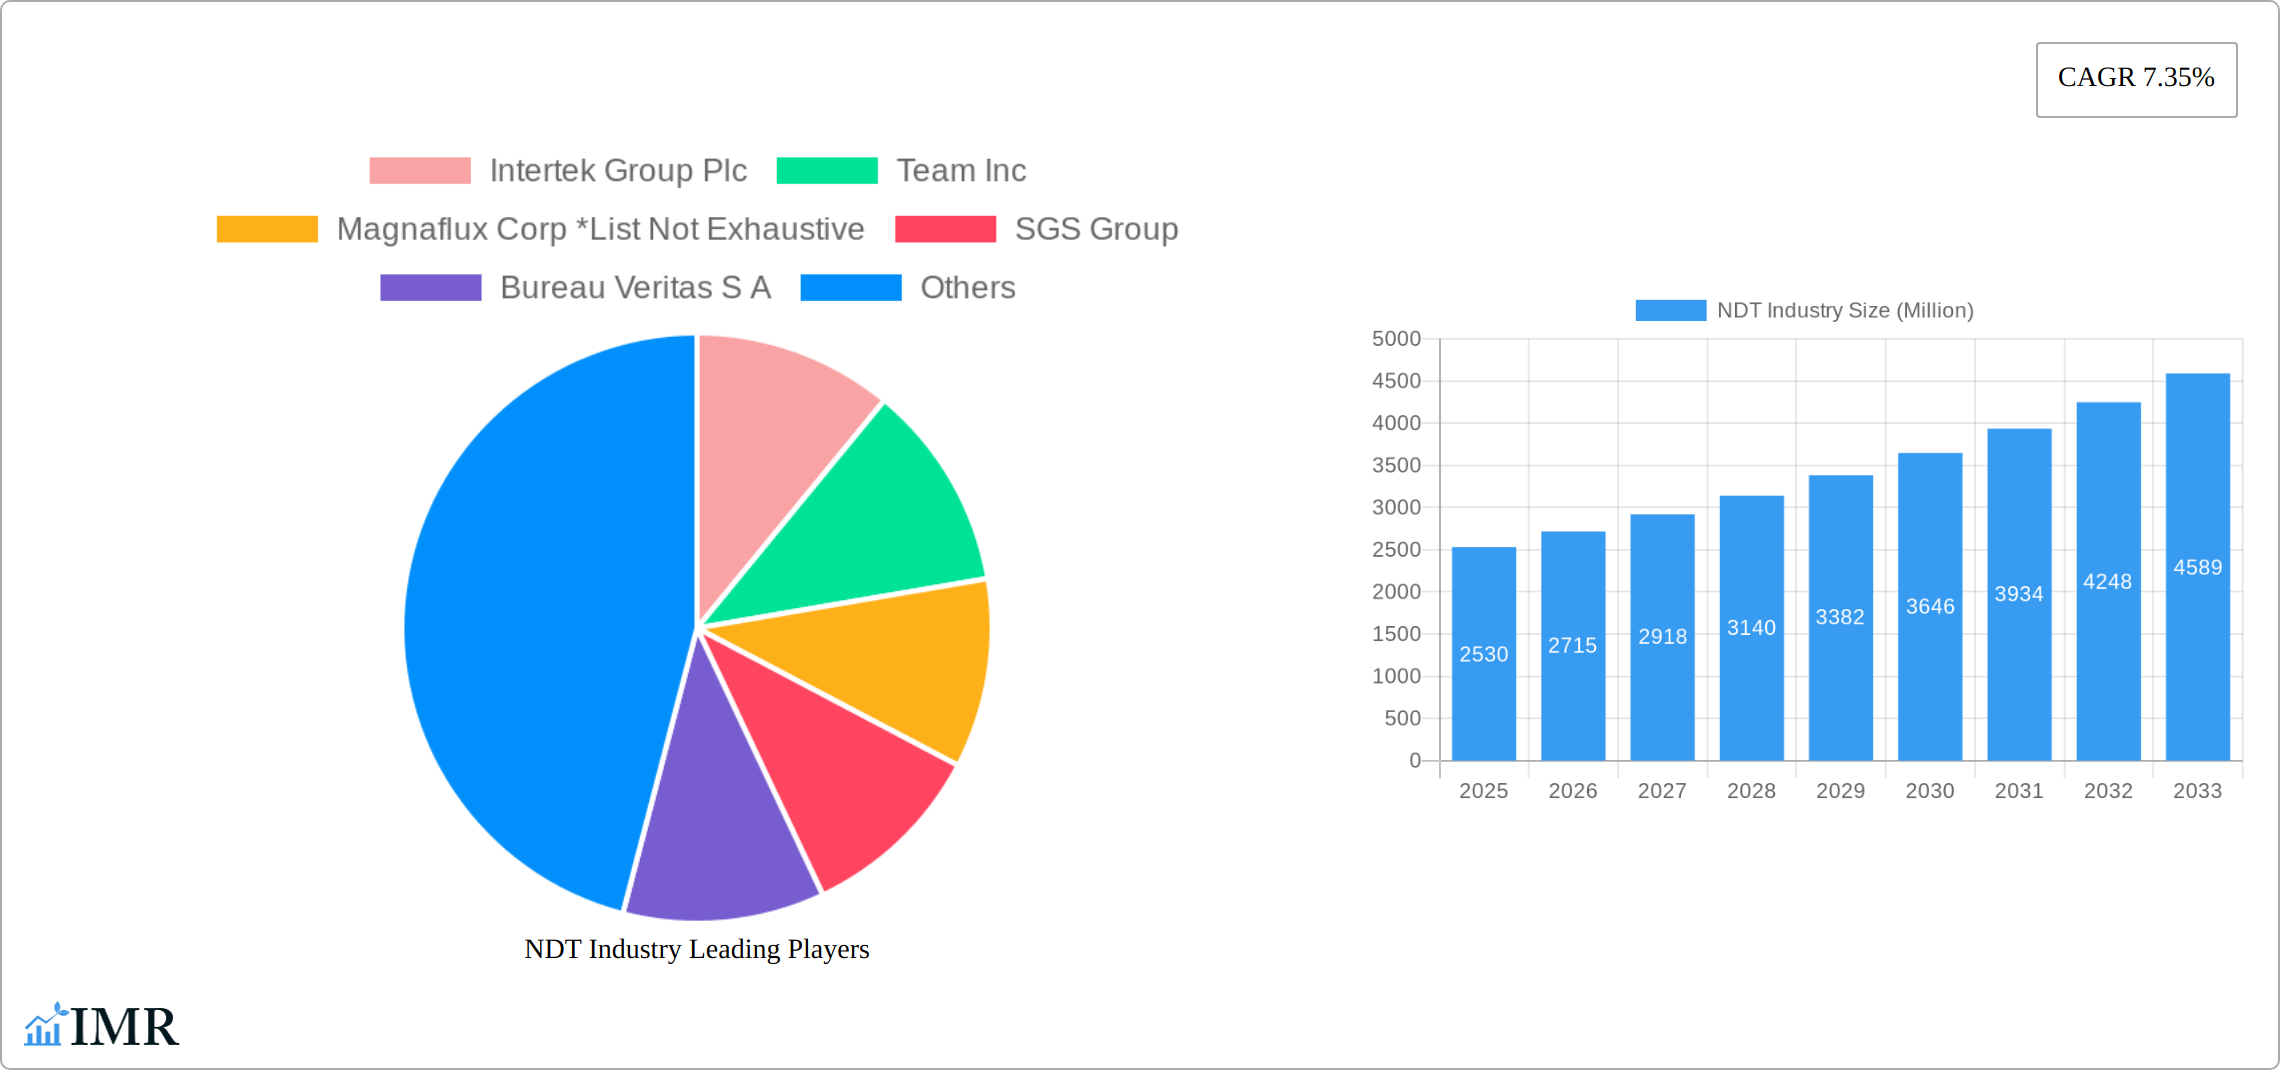
NDT Industry Market Size (In Billion)
The market segmentation highlights significant opportunities across various technologies and end-user industries. Radiography testing, ultrasonic testing, and magnetic particle testing remain dominant technologies, owing to their established reliability and widespread application. However, eddy current testing and other advanced technologies are witnessing notable growth due to their specific advantages in particular applications. The oil & gas, power & energy, and construction sectors are currently the largest consumers of NDT services and equipment, reflecting the critical need for infrastructure inspection and maintenance in these capital-intensive industries. The automotive and aerospace sectors also represent significant growth markets, driven by stringent quality and safety requirements in manufacturing and maintenance. The NDT services segment is predicted to grow at a faster rate compared to the equipment segment, driven by the outsourcing trend and the need for specialized expertise in complex testing applications. Competitive rivalry among established players such as Intertek, SGS, and Bureau Veritas, alongside several regional players, will shape the market dynamics in the coming years. The continued innovation in NDT technologies, along with strategic partnerships and acquisitions, will further influence market consolidation and growth.
NDT Industry Company Market Share
NDT Industry Market Report: 2019-2033
This comprehensive report provides an in-depth analysis of the Non-Destructive Testing (NDT) industry, encompassing market dynamics, growth trends, regional landscapes, key players, and future outlook. The study period covers 2019-2033, with 2025 serving as the base and estimated year. The report segments the market by testing technology (Radiography, Ultrasonic, Magnetic Particle, Liquid Penetrant, Visual Inspection, Eddy Current, and Others), end-user industry (Oil & Gas, Power & Energy, Construction, Automotive & Transportation, Aerospace, Defense, and Others), and type (Services and Equipment). Leading companies such as Intertek Group Plc, Team Inc, Magnaflux Corp, SGS Group, Bureau Veritas S A, and others are profiled, offering valuable insights into the competitive landscape. The report projects a market valued at xx Million in 2025, growing at a CAGR of xx% during 2025-2033.
NDT Industry Market Dynamics & Structure
The Non-Destructive Testing (NDT) market is characterized by a moderate level of concentration, with several prominent global players commanding substantial market shares. This dynamic landscape is continuously shaped by rapid technological innovation, particularly in the realms of automation, sophisticated data analytics, and the integration of Artificial Intelligence (AI). These advancements are not only driving efficiency and accuracy but are also creating new service possibilities within the industry. Furthermore, stringent regulatory frameworks across diverse industrial sectors, emphasizing safety and quality assurance, play a pivotal role in dictating market dynamics and mandating the adoption of NDT practices. While technological progress is a strong tailwind, the market also faces challenges from competitive substitutes, including emerging advanced material testing methods, which can influence market penetration and adoption rates. The end-user demographic for NDT services is exceptionally diverse, encompassing a wide array of sectors, each with its own unique requirements and varying levels of NDT adoption. The industry has also witnessed consistent merger and acquisition (M&A) activity, with a notable number of deals in recent years, predominantly focused on strategic expansion of service portfolios and broadening geographical reach.
- Market Concentration: The NDT market exhibits moderate concentration, with the top 5 leading players collectively holding approximately [Insert Percentage]% of the global market share in 2025.
- Technological Innovation: Key growth drivers include advancements in AI-powered image analysis for enhanced defect detection, the deployment of robotic systems for automated inspections in hazardous environments, and the development of compact, highly portable testing devices for on-site applications.
- Regulatory Frameworks: Increasingly rigorous safety and quality standards, particularly critical in high-stakes sectors such as aerospace, nuclear power, and oil & gas, necessitate and drive the consistent application of NDT methodologies.
- Competitive Substitutes: The emergence and refinement of alternative testing methodologies, while offering potential benefits, also present a competitive challenge that influences overall market growth and the speed of adoption for traditional NDT techniques.
- End-user Demographics: The Oil & Gas sector, Power & Energy, and the Automotive & Transportation industries represent the primary end-users. Adoption rates within these sectors are significantly influenced by the stringency of regulatory compliance and paramount safety concerns.
- M&A Trends: [Insert Number] M&A deals were recorded between 2020 and 2024. These transactions were predominantly strategic, aimed at achieving market consolidation, acquiring new technological capabilities, and expanding into untapped geographical markets.
NDT Industry Growth Trends & Insights
The Non-Destructive Testing (NDT) market has demonstrated a robust and steady growth trajectory from 2019 to 2024. This upward trend has been significantly propelled by substantial investments in global infrastructure development, the ever-increasing emphasis on stringent safety regulations across a multitude of industries, and continuous technological advancements that promise enhanced efficiency and precision in testing procedures. The market size saw a considerable expansion, growing from approximately [Insert Million Value] Million in 2019 to [Insert Million Value] Million in 2024, achieving a Compound Annual Growth Rate (CAGR) of [Insert Percentage]%. This positive momentum is projected to continue into the forecast period spanning 2025-2033. Key factors underpinning this sustained growth include the escalating global demand for new infrastructure, the rising adoption of NDT solutions in burgeoning economies, and significant investments dedicated to research and development efforts aimed at refining and innovating NDT technologies. As safety and quality standards continue to tighten, particularly in pivotal end-user industries like aerospace and oil & gas, the market penetration rate for NDT services is expected to deepen further. The integration of cutting-edge technologies such as Artificial Intelligence (AI) and Machine Learning (ML) has revolutionized NDT processes, leading to streamlined operations, a marked reduction in human error, and a significant enhancement in the overall efficacy and accuracy of testing outcomes, thereby driving broader market adoption. Concurrently, a discernible shift in consumer and industrial expectations towards higher quality benchmarks and uncompromising safety standards across various sectors has further amplified the demand for sophisticated NDT services and state-of-the-art equipment.
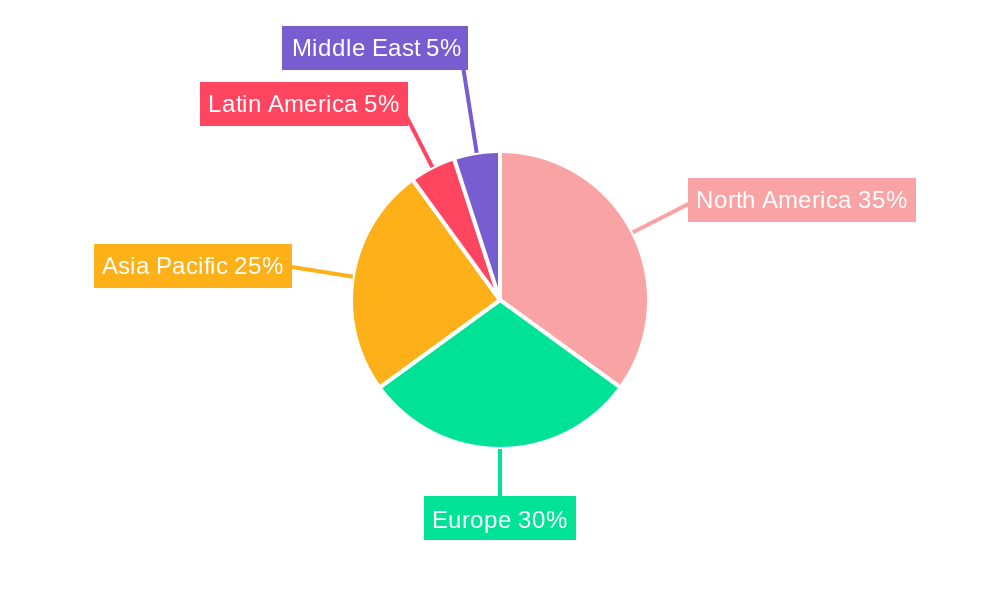
Dominant Regions, Countries, or Segments in NDT Industry
North America currently holds a leading position in the global NDT market. This dominance is attributed to its high levels of technological advancement, stringent and well-established safety regulations, and the significant presence of key industry players. Within the North American region, the United States accounts for the largest market share. Europe follows as another substantial market, characterized by a strong focus on ongoing infrastructure development and robust industrial expansion. The Asia-Pacific region, on the other hand, is experiencing the most rapid growth, primarily fueled by escalating investments in large-scale infrastructure projects and increasing industrial activity, particularly in major economies like China and India.
By Testing Technology: Ultrasonic testing commands the largest market share. This is due to its inherent versatility, cost-effectiveness, and broad applicability across various materials and defect types, followed closely by radiography testing.
By End-user Industry: The oil & gas sector remains the leading end-user industry for NDT services. This is driven by the critical nature of its infrastructure and the imperative for strict safety and operational integrity regulations. The Automotive & Transportation sector follows as a significant contributor, propelled by increased vehicle production volumes and the unyielding demand for stringent quality control measures.
By Type: The services segment holds a dominant position within the market. This reflects a prevailing trend of outsourcing NDT services by numerous end-user industries, seeking specialized expertise and efficient deployment of advanced NDT technologies.
- North America: Characterized by exceptionally high adoption rates, driven by a combination of stringent safety mandates and a leading position in technological innovation.
- Europe: Demonstrates a strong market presence due to a continuous focus on infrastructure upgrades and sustained industrial growth.
- Asia-Pacific: Exhibits rapid market expansion, largely propelled by significant investments in new infrastructure projects and accelerated industrialization across the region.
- Ultrasonic Testing: Secures the largest market share owing to its inherent versatility, cost-effectiveness, and widespread applicability.
- Oil & Gas Industry: Serves as the leading end-user sector, primarily due to its critical infrastructure and the stringent safety regulations that govern its operations.
- Services Segment: Dominates the market, underscoring the growing trend of outsourcing NDT services by a wide spectrum of industries.
NDT Industry Product Landscape
The NDT product landscape is evolving rapidly, with continuous advancements in testing technologies and equipment. Innovations include portable and automated systems, improved sensors with higher sensitivity, and advanced data analytics tools for faster and more accurate results. These advancements cater to increased efficiency, reduced testing time, and improved data interpretation. Key products encompass various testing devices (e.g., ultrasonic flaw detectors, radiographic equipment, magnetic particle testers), software solutions for data analysis and reporting, and specialized services for complex testing needs. The main selling propositions often highlight accuracy, speed, and ease of use, aiming to reduce operational costs and enhance safety for clients.
Key Drivers, Barriers & Challenges in NDT Industry
Key Drivers: Increasing demand for infrastructure development, stringent safety regulations, rising awareness about product quality, and technological advancements in NDT techniques are key drivers pushing market growth. Government initiatives promoting safety and quality standards in various sectors also play a significant role.
Challenges & Restraints: High initial investment costs for advanced NDT equipment, skilled labor shortage, and the need for continuous training and upgradation of personnel pose challenges. Supply chain disruptions impacting the availability of crucial components and the competitive landscape with the emergence of alternative testing methods also contribute to market restraints. The impact of these restraints is estimated to be xx Million annually.
Emerging Opportunities in NDT Industry
Emerging opportunities lie in the adoption of advanced technologies such as AI and machine learning for automated defect detection and analysis. The integration of NDT with digital twins and IoT further presents opportunities. Untapped markets in developing economies and expansion into new applications, such as additive manufacturing and 3D printing quality control, offer significant potential for market growth.
Growth Accelerators in the NDT Industry
The long-term growth trajectory of the NDT industry is expected to be significantly bolstered by groundbreaking technological advancements. These include the development of more sophisticated advanced imaging techniques, the creation of highly sensitive and reliable sensor technologies, and the engineering of NDT equipment that is both more robust and dependable. Strategic alliances and collaborations forged between NDT service providers and key end-user industries are anticipated to act as powerful catalysts for innovation, fostering the development of tailored solutions and promoting wider adoption of NDT practices. Furthermore, expanding the market's reach into emerging economies, where industrial development is rapidly accelerating, and exploring novel applications within burgeoning sectors such as renewable energy and advanced materials, will be instrumental in driving sustained market growth.
Key Players Shaping the NDT Industry Market
- Intertek Group Plc
- Team Inc
- Magnaflux Corp
- SGS Group
- Bureau Veritas S A
- Nikon Metrology NV
- Fujifilm Corporation
- TÜV Rheinland AG
- Mistras Group Inc
- Yxlon International Gmbh (Comet Holding Ag)
- Applus Services
- Olympus Corporation
- GE Measurement & Control Solutions
Notable Milestones in NDT Industry Sector
- 2021: Introduction of AI-powered NDT software by Magnaflux Corp.
- 2022: Merger between two major NDT service providers resulting in expanded market reach.
- 2023: Launch of a new portable ultrasonic testing device with enhanced features by Olympus Corporation.
- 2024: Increased adoption of robotic automation in NDT processes by several leading companies.
In-Depth NDT Industry Market Outlook
The future of the NDT market looks promising, with significant growth potential fueled by technological advancements, increasing demand from various end-user industries, and the growing focus on safety and quality assurance. Strategic partnerships, expansion into new geographical markets, and diversification into emerging applications will be crucial for sustained growth. The market is poised for continued expansion, driven by the convergence of technology and the growing need for reliable and efficient NDT solutions.
NDT Industry Segmentation
-
1. Type
- 1.1. Equipment
- 1.2. Services
-
2. Testing Technology
- 2.1. Radiography Testing
- 2.2. Ultrasonic Testing
- 2.3. Magnetic Particle Testing
- 2.4. Liquid Penetrant Testing
- 2.5. Visual Inspection Testing
- 2.6. Eddy Current Testing
- 2.7. Other Testing Technologies
-
3. End-user Industry
- 3.1. Oil and Gas
- 3.2. Power and Energy
- 3.3. Construction
- 3.4. Automotive and Transportation
- 3.5. Aerospace
- 3.6. Defense
- 3.7. Other End User Industries
NDT Industry Segmentation By Geography
-
1. North America
- 1.1. United States
- 1.2. Canada
-
2. Europe
- 2.1. Germany
- 2.2. United Kingdom
- 2.3. France
-
3. Asia
- 3.1. China
- 3.2. Japan
- 3.3. India
- 4. Australia and New Zealand
-
5. Latin America
- 5.1. Brazil
- 5.2. Argentina
- 5.3. Mexico
-
6. Middle East and Africa
- 6.1. United Arab Emirates
- 6.2. Saudi Arabia
- 6.3. South Africa
NDT Industry Regional Market Share
Geographic Coverage of NDT Industry
NDT Industry REPORT HIGHLIGHTS
| Aspects | Details |
|---|---|
| Study Period | 2020-2034 |
| Base Year | 2025 |
| Estimated Year | 2026 |
| Forecast Period | 2026-2034 |
| Historical Period | 2020-2025 |
| Growth Rate | CAGR of 7.35% from 2020-2034 |
| Segmentation |
|
Table of Contents
- 1. Introduction
- 1.1. Research Scope
- 1.2. Market Segmentation
- 1.3. Research Objective
- 1.4. Definitions and Assumptions
- 2. Executive Summary
- 2.1. Market Snapshot
- 3. Market Dynamics
- 3.1. Market Drivers
- 3.2. Market Restrains
- 3.3. Market Trends
- 3.4. Market Opportunities
- 4. Market Factor Analysis
- 4.1. Porters Five Forces
- 4.1.1. Bargaining Power of Suppliers
- 4.1.2. Bargaining Power of Buyers
- 4.1.3. Threat of New Entrants
- 4.1.4. Threat of Substitutes
- 4.1.5. Competitive Rivalry
- 4.2. PESTEL analysis
- 4.3. BCG Analysis
- 4.3.1. Stars (High Growth, High Market Share)
- 4.3.2. Cash Cows (Low Growth, High Market Share)
- 4.3.3. Question Mark (High Growth, Low Market Share)
- 4.3.4. Dogs (Low Growth, Low Market Share)
- 4.4. Ansoff Matrix Analysis
- 4.5. Supply Chain Analysis
- 4.6. Regulatory Landscape
- 4.7. Current Market Potential and Opportunity Assessment (TAM–SAM–SOM Framework)
- 4.8. IMR Analyst Note
- 4.1. Porters Five Forces
- 5. Market Analysis, Insights and Forecast 2021-2033
- 5.1. Market Analysis, Insights and Forecast - by Type
- 5.1.1. Equipment
- 5.1.2. Services
- 5.2. Market Analysis, Insights and Forecast - by Testing Technology
- 5.2.1. Radiography Testing
- 5.2.2. Ultrasonic Testing
- 5.2.3. Magnetic Particle Testing
- 5.2.4. Liquid Penetrant Testing
- 5.2.5. Visual Inspection Testing
- 5.2.6. Eddy Current Testing
- 5.2.7. Other Testing Technologies
- 5.3. Market Analysis, Insights and Forecast - by End-user Industry
- 5.3.1. Oil and Gas
- 5.3.2. Power and Energy
- 5.3.3. Construction
- 5.3.4. Automotive and Transportation
- 5.3.5. Aerospace
- 5.3.6. Defense
- 5.3.7. Other End User Industries
- 5.4. Market Analysis, Insights and Forecast - by Region
- 5.4.1. North America
- 5.4.2. Europe
- 5.4.3. Asia
- 5.4.4. Australia and New Zealand
- 5.4.5. Latin America
- 5.4.6. Middle East and Africa
- 5.1. Market Analysis, Insights and Forecast - by Type
- 6. Global NDT Industry Analysis, Insights and Forecast, 2021-2033
- 6.1. Market Analysis, Insights and Forecast - by Type
- 6.1.1. Equipment
- 6.1.2. Services
- 6.2. Market Analysis, Insights and Forecast - by Testing Technology
- 6.2.1. Radiography Testing
- 6.2.2. Ultrasonic Testing
- 6.2.3. Magnetic Particle Testing
- 6.2.4. Liquid Penetrant Testing
- 6.2.5. Visual Inspection Testing
- 6.2.6. Eddy Current Testing
- 6.2.7. Other Testing Technologies
- 6.3. Market Analysis, Insights and Forecast - by End-user Industry
- 6.3.1. Oil and Gas
- 6.3.2. Power and Energy
- 6.3.3. Construction
- 6.3.4. Automotive and Transportation
- 6.3.5. Aerospace
- 6.3.6. Defense
- 6.3.7. Other End User Industries
- 6.1. Market Analysis, Insights and Forecast - by Type
- 7. North America NDT Industry Analysis, Insights and Forecast, 2020-2032
- 7.1. Market Analysis, Insights and Forecast - by Type
- 7.1.1. Equipment
- 7.1.2. Services
- 7.2. Market Analysis, Insights and Forecast - by Testing Technology
- 7.2.1. Radiography Testing
- 7.2.2. Ultrasonic Testing
- 7.2.3. Magnetic Particle Testing
- 7.2.4. Liquid Penetrant Testing
- 7.2.5. Visual Inspection Testing
- 7.2.6. Eddy Current Testing
- 7.2.7. Other Testing Technologies
- 7.3. Market Analysis, Insights and Forecast - by End-user Industry
- 7.3.1. Oil and Gas
- 7.3.2. Power and Energy
- 7.3.3. Construction
- 7.3.4. Automotive and Transportation
- 7.3.5. Aerospace
- 7.3.6. Defense
- 7.3.7. Other End User Industries
- 7.1. Market Analysis, Insights and Forecast - by Type
- 8. Europe NDT Industry Analysis, Insights and Forecast, 2020-2032
- 8.1. Market Analysis, Insights and Forecast - by Type
- 8.1.1. Equipment
- 8.1.2. Services
- 8.2. Market Analysis, Insights and Forecast - by Testing Technology
- 8.2.1. Radiography Testing
- 8.2.2. Ultrasonic Testing
- 8.2.3. Magnetic Particle Testing
- 8.2.4. Liquid Penetrant Testing
- 8.2.5. Visual Inspection Testing
- 8.2.6. Eddy Current Testing
- 8.2.7. Other Testing Technologies
- 8.3. Market Analysis, Insights and Forecast - by End-user Industry
- 8.3.1. Oil and Gas
- 8.3.2. Power and Energy
- 8.3.3. Construction
- 8.3.4. Automotive and Transportation
- 8.3.5. Aerospace
- 8.3.6. Defense
- 8.3.7. Other End User Industries
- 8.1. Market Analysis, Insights and Forecast - by Type
- 9. Asia NDT Industry Analysis, Insights and Forecast, 2020-2032
- 9.1. Market Analysis, Insights and Forecast - by Type
- 9.1.1. Equipment
- 9.1.2. Services
- 9.2. Market Analysis, Insights and Forecast - by Testing Technology
- 9.2.1. Radiography Testing
- 9.2.2. Ultrasonic Testing
- 9.2.3. Magnetic Particle Testing
- 9.2.4. Liquid Penetrant Testing
- 9.2.5. Visual Inspection Testing
- 9.2.6. Eddy Current Testing
- 9.2.7. Other Testing Technologies
- 9.3. Market Analysis, Insights and Forecast - by End-user Industry
- 9.3.1. Oil and Gas
- 9.3.2. Power and Energy
- 9.3.3. Construction
- 9.3.4. Automotive and Transportation
- 9.3.5. Aerospace
- 9.3.6. Defense
- 9.3.7. Other End User Industries
- 9.1. Market Analysis, Insights and Forecast - by Type
- 10. Australia and New Zealand NDT Industry Analysis, Insights and Forecast, 2020-2032
- 10.1. Market Analysis, Insights and Forecast - by Type
- 10.1.1. Equipment
- 10.1.2. Services
- 10.2. Market Analysis, Insights and Forecast - by Testing Technology
- 10.2.1. Radiography Testing
- 10.2.2. Ultrasonic Testing
- 10.2.3. Magnetic Particle Testing
- 10.2.4. Liquid Penetrant Testing
- 10.2.5. Visual Inspection Testing
- 10.2.6. Eddy Current Testing
- 10.2.7. Other Testing Technologies
- 10.3. Market Analysis, Insights and Forecast - by End-user Industry
- 10.3.1. Oil and Gas
- 10.3.2. Power and Energy
- 10.3.3. Construction
- 10.3.4. Automotive and Transportation
- 10.3.5. Aerospace
- 10.3.6. Defense
- 10.3.7. Other End User Industries
- 10.1. Market Analysis, Insights and Forecast - by Type
- 11. Latin America NDT Industry Analysis, Insights and Forecast, 2020-2032
- 11.1. Market Analysis, Insights and Forecast - by Type
- 11.1.1. Equipment
- 11.1.2. Services
- 11.2. Market Analysis, Insights and Forecast - by Testing Technology
- 11.2.1. Radiography Testing
- 11.2.2. Ultrasonic Testing
- 11.2.3. Magnetic Particle Testing
- 11.2.4. Liquid Penetrant Testing
- 11.2.5. Visual Inspection Testing
- 11.2.6. Eddy Current Testing
- 11.2.7. Other Testing Technologies
- 11.3. Market Analysis, Insights and Forecast - by End-user Industry
- 11.3.1. Oil and Gas
- 11.3.2. Power and Energy
- 11.3.3. Construction
- 11.3.4. Automotive and Transportation
- 11.3.5. Aerospace
- 11.3.6. Defense
- 11.3.7. Other End User Industries
- 11.1. Market Analysis, Insights and Forecast - by Type
- 12. Middle East and Africa NDT Industry Analysis, Insights and Forecast, 2020-2032
- 12.1. Market Analysis, Insights and Forecast - by Type
- 12.1.1. Equipment
- 12.1.2. Services
- 12.2. Market Analysis, Insights and Forecast - by Testing Technology
- 12.2.1. Radiography Testing
- 12.2.2. Ultrasonic Testing
- 12.2.3. Magnetic Particle Testing
- 12.2.4. Liquid Penetrant Testing
- 12.2.5. Visual Inspection Testing
- 12.2.6. Eddy Current Testing
- 12.2.7. Other Testing Technologies
- 12.3. Market Analysis, Insights and Forecast - by End-user Industry
- 12.3.1. Oil and Gas
- 12.3.2. Power and Energy
- 12.3.3. Construction
- 12.3.4. Automotive and Transportation
- 12.3.5. Aerospace
- 12.3.6. Defense
- 12.3.7. Other End User Industries
- 12.1. Market Analysis, Insights and Forecast - by Type
- 13. Competitive Analysis
- 13.1. Company Profiles
- 13.1.1 Intertek Group Plc
- 13.1.1.1. Company Overview
- 13.1.1.2. Products
- 13.1.1.3. Company Financials
- 13.1.1.4. SWOT Analysis
- 13.1.2 Team Inc
- 13.1.2.1. Company Overview
- 13.1.2.2. Products
- 13.1.2.3. Company Financials
- 13.1.2.4. SWOT Analysis
- 13.1.3 Magnaflux Corp *List Not Exhaustive
- 13.1.3.1. Company Overview
- 13.1.3.2. Products
- 13.1.3.3. Company Financials
- 13.1.3.4. SWOT Analysis
- 13.1.4 SGS Group
- 13.1.4.1. Company Overview
- 13.1.4.2. Products
- 13.1.4.3. Company Financials
- 13.1.4.4. SWOT Analysis
- 13.1.5 Bureau Veritas S A
- 13.1.5.1. Company Overview
- 13.1.5.2. Products
- 13.1.5.3. Company Financials
- 13.1.5.4. SWOT Analysis
- 13.1.6 Nikon Metrology NV
- 13.1.6.1. Company Overview
- 13.1.6.2. Products
- 13.1.6.3. Company Financials
- 13.1.6.4. SWOT Analysis
- 13.1.7 Fujifilm Corporation
- 13.1.7.1. Company Overview
- 13.1.7.2. Products
- 13.1.7.3. Company Financials
- 13.1.7.4. SWOT Analysis
- 13.1.8 TÜV Rheinland AG
- 13.1.8.1. Company Overview
- 13.1.8.2. Products
- 13.1.8.3. Company Financials
- 13.1.8.4. SWOT Analysis
- 13.1.9 Mistras Group Inc
- 13.1.9.1. Company Overview
- 13.1.9.2. Products
- 13.1.9.3. Company Financials
- 13.1.9.4. SWOT Analysis
- 13.1.10 Yxlon International Gmbh (Comet Holding Ag)
- 13.1.10.1. Company Overview
- 13.1.10.2. Products
- 13.1.10.3. Company Financials
- 13.1.10.4. SWOT Analysis
- 13.1.11 Applus Services
- 13.1.11.1. Company Overview
- 13.1.11.2. Products
- 13.1.11.3. Company Financials
- 13.1.11.4. SWOT Analysis
- 13.1.12 Olympus Corporation
- 13.1.12.1. Company Overview
- 13.1.12.2. Products
- 13.1.12.3. Company Financials
- 13.1.12.4. SWOT Analysis
- 13.1.13 GE Measurement & Control Solutions
- 13.1.13.1. Company Overview
- 13.1.13.2. Products
- 13.1.13.3. Company Financials
- 13.1.13.4. SWOT Analysis
- 13.1.1 Intertek Group Plc
- 13.2. Market Entropy
- 13.2.1 Company's Key Areas Served
- 13.2.2 Recent Developments
- 13.3. Company Market Share Analysis 2025
- 13.3.1 Top 5 Companies Market Share Analysis
- 13.3.2 Top 3 Companies Market Share Analysis
- 13.4. List of Potential Customers
- 14. Research Methodology
List of Figures
- Figure 1: Global NDT Industry Revenue Breakdown (Million, %) by Region 2025 & 2033
- Figure 2: North America NDT Industry Revenue (Million), by Type 2025 & 2033
- Figure 3: North America NDT Industry Revenue Share (%), by Type 2025 & 2033
- Figure 4: North America NDT Industry Revenue (Million), by Testing Technology 2025 & 2033
- Figure 5: North America NDT Industry Revenue Share (%), by Testing Technology 2025 & 2033
- Figure 6: North America NDT Industry Revenue (Million), by End-user Industry 2025 & 2033
- Figure 7: North America NDT Industry Revenue Share (%), by End-user Industry 2025 & 2033
- Figure 8: North America NDT Industry Revenue (Million), by Country 2025 & 2033
- Figure 9: North America NDT Industry Revenue Share (%), by Country 2025 & 2033
- Figure 10: Europe NDT Industry Revenue (Million), by Type 2025 & 2033
- Figure 11: Europe NDT Industry Revenue Share (%), by Type 2025 & 2033
- Figure 12: Europe NDT Industry Revenue (Million), by Testing Technology 2025 & 2033
- Figure 13: Europe NDT Industry Revenue Share (%), by Testing Technology 2025 & 2033
- Figure 14: Europe NDT Industry Revenue (Million), by End-user Industry 2025 & 2033
- Figure 15: Europe NDT Industry Revenue Share (%), by End-user Industry 2025 & 2033
- Figure 16: Europe NDT Industry Revenue (Million), by Country 2025 & 2033
- Figure 17: Europe NDT Industry Revenue Share (%), by Country 2025 & 2033
- Figure 18: Asia NDT Industry Revenue (Million), by Type 2025 & 2033
- Figure 19: Asia NDT Industry Revenue Share (%), by Type 2025 & 2033
- Figure 20: Asia NDT Industry Revenue (Million), by Testing Technology 2025 & 2033
- Figure 21: Asia NDT Industry Revenue Share (%), by Testing Technology 2025 & 2033
- Figure 22: Asia NDT Industry Revenue (Million), by End-user Industry 2025 & 2033
- Figure 23: Asia NDT Industry Revenue Share (%), by End-user Industry 2025 & 2033
- Figure 24: Asia NDT Industry Revenue (Million), by Country 2025 & 2033
- Figure 25: Asia NDT Industry Revenue Share (%), by Country 2025 & 2033
- Figure 26: Australia and New Zealand NDT Industry Revenue (Million), by Type 2025 & 2033
- Figure 27: Australia and New Zealand NDT Industry Revenue Share (%), by Type 2025 & 2033
- Figure 28: Australia and New Zealand NDT Industry Revenue (Million), by Testing Technology 2025 & 2033
- Figure 29: Australia and New Zealand NDT Industry Revenue Share (%), by Testing Technology 2025 & 2033
- Figure 30: Australia and New Zealand NDT Industry Revenue (Million), by End-user Industry 2025 & 2033
- Figure 31: Australia and New Zealand NDT Industry Revenue Share (%), by End-user Industry 2025 & 2033
- Figure 32: Australia and New Zealand NDT Industry Revenue (Million), by Country 2025 & 2033
- Figure 33: Australia and New Zealand NDT Industry Revenue Share (%), by Country 2025 & 2033
- Figure 34: Latin America NDT Industry Revenue (Million), by Type 2025 & 2033
- Figure 35: Latin America NDT Industry Revenue Share (%), by Type 2025 & 2033
- Figure 36: Latin America NDT Industry Revenue (Million), by Testing Technology 2025 & 2033
- Figure 37: Latin America NDT Industry Revenue Share (%), by Testing Technology 2025 & 2033
- Figure 38: Latin America NDT Industry Revenue (Million), by End-user Industry 2025 & 2033
- Figure 39: Latin America NDT Industry Revenue Share (%), by End-user Industry 2025 & 2033
- Figure 40: Latin America NDT Industry Revenue (Million), by Country 2025 & 2033
- Figure 41: Latin America NDT Industry Revenue Share (%), by Country 2025 & 2033
- Figure 42: Middle East and Africa NDT Industry Revenue (Million), by Type 2025 & 2033
- Figure 43: Middle East and Africa NDT Industry Revenue Share (%), by Type 2025 & 2033
- Figure 44: Middle East and Africa NDT Industry Revenue (Million), by Testing Technology 2025 & 2033
- Figure 45: Middle East and Africa NDT Industry Revenue Share (%), by Testing Technology 2025 & 2033
- Figure 46: Middle East and Africa NDT Industry Revenue (Million), by End-user Industry 2025 & 2033
- Figure 47: Middle East and Africa NDT Industry Revenue Share (%), by End-user Industry 2025 & 2033
- Figure 48: Middle East and Africa NDT Industry Revenue (Million), by Country 2025 & 2033
- Figure 49: Middle East and Africa NDT Industry Revenue Share (%), by Country 2025 & 2033
List of Tables
- Table 1: Global NDT Industry Revenue Million Forecast, by Type 2020 & 2033
- Table 2: Global NDT Industry Revenue Million Forecast, by Testing Technology 2020 & 2033
- Table 3: Global NDT Industry Revenue Million Forecast, by End-user Industry 2020 & 2033
- Table 4: Global NDT Industry Revenue Million Forecast, by Region 2020 & 2033
- Table 5: Global NDT Industry Revenue Million Forecast, by Type 2020 & 2033
- Table 6: Global NDT Industry Revenue Million Forecast, by Testing Technology 2020 & 2033
- Table 7: Global NDT Industry Revenue Million Forecast, by End-user Industry 2020 & 2033
- Table 8: Global NDT Industry Revenue Million Forecast, by Country 2020 & 2033
- Table 9: United States NDT Industry Revenue (Million) Forecast, by Application 2020 & 2033
- Table 10: Canada NDT Industry Revenue (Million) Forecast, by Application 2020 & 2033
- Table 11: Global NDT Industry Revenue Million Forecast, by Type 2020 & 2033
- Table 12: Global NDT Industry Revenue Million Forecast, by Testing Technology 2020 & 2033
- Table 13: Global NDT Industry Revenue Million Forecast, by End-user Industry 2020 & 2033
- Table 14: Global NDT Industry Revenue Million Forecast, by Country 2020 & 2033
- Table 15: Germany NDT Industry Revenue (Million) Forecast, by Application 2020 & 2033
- Table 16: United Kingdom NDT Industry Revenue (Million) Forecast, by Application 2020 & 2033
- Table 17: France NDT Industry Revenue (Million) Forecast, by Application 2020 & 2033
- Table 18: Global NDT Industry Revenue Million Forecast, by Type 2020 & 2033
- Table 19: Global NDT Industry Revenue Million Forecast, by Testing Technology 2020 & 2033
- Table 20: Global NDT Industry Revenue Million Forecast, by End-user Industry 2020 & 2033
- Table 21: Global NDT Industry Revenue Million Forecast, by Country 2020 & 2033
- Table 22: China NDT Industry Revenue (Million) Forecast, by Application 2020 & 2033
- Table 23: Japan NDT Industry Revenue (Million) Forecast, by Application 2020 & 2033
- Table 24: India NDT Industry Revenue (Million) Forecast, by Application 2020 & 2033
- Table 25: Global NDT Industry Revenue Million Forecast, by Type 2020 & 2033
- Table 26: Global NDT Industry Revenue Million Forecast, by Testing Technology 2020 & 2033
- Table 27: Global NDT Industry Revenue Million Forecast, by End-user Industry 2020 & 2033
- Table 28: Global NDT Industry Revenue Million Forecast, by Country 2020 & 2033
- Table 29: Global NDT Industry Revenue Million Forecast, by Type 2020 & 2033
- Table 30: Global NDT Industry Revenue Million Forecast, by Testing Technology 2020 & 2033
- Table 31: Global NDT Industry Revenue Million Forecast, by End-user Industry 2020 & 2033
- Table 32: Global NDT Industry Revenue Million Forecast, by Country 2020 & 2033
- Table 33: Brazil NDT Industry Revenue (Million) Forecast, by Application 2020 & 2033
- Table 34: Argentina NDT Industry Revenue (Million) Forecast, by Application 2020 & 2033
- Table 35: Mexico NDT Industry Revenue (Million) Forecast, by Application 2020 & 2033
- Table 36: Global NDT Industry Revenue Million Forecast, by Type 2020 & 2033
- Table 37: Global NDT Industry Revenue Million Forecast, by Testing Technology 2020 & 2033
- Table 38: Global NDT Industry Revenue Million Forecast, by End-user Industry 2020 & 2033
- Table 39: Global NDT Industry Revenue Million Forecast, by Country 2020 & 2033
- Table 40: United Arab Emirates NDT Industry Revenue (Million) Forecast, by Application 2020 & 2033
- Table 41: Saudi Arabia NDT Industry Revenue (Million) Forecast, by Application 2020 & 2033
- Table 42: South Africa NDT Industry Revenue (Million) Forecast, by Application 2020 & 2033
Frequently Asked Questions
1. What is the projected Compound Annual Growth Rate (CAGR) of the NDT Industry?
The projected CAGR is approximately 7.35%.
2. Which companies are prominent players in the NDT Industry?
Key companies in the market include Intertek Group Plc, Team Inc, Magnaflux Corp *List Not Exhaustive, SGS Group, Bureau Veritas S A, Nikon Metrology NV, Fujifilm Corporation, TÜV Rheinland AG, Mistras Group Inc, Yxlon International Gmbh (Comet Holding Ag), Applus Services, Olympus Corporation, GE Measurement & Control Solutions.
3. What are the main segments of the NDT Industry?
The market segments include Type, Testing Technology, End-user Industry.
4. Can you provide details about the market size?
The market size is estimated to be USD 2.53 Million as of 2022.
5. What are some drivers contributing to market growth?
; Stringent Regulations Mandating Safety Standards; Increase in Demand for Flaw Detection to Reduce Repair Cost.
6. What are the notable trends driving market growth?
Power and Energy Sector Offers Potential Growth.
7. Are there any restraints impacting market growth?
; Lack of Skilled Workforce and Training Regulations.
8. Can you provide examples of recent developments in the market?
N/A
9. What pricing options are available for accessing the report?
Pricing options include single-user, multi-user, and enterprise licenses priced at USD 4750, USD 5250, and USD 8750 respectively.
10. Is the market size provided in terms of value or volume?
The market size is provided in terms of value, measured in Million.
11. Are there any specific market keywords associated with the report?
Yes, the market keyword associated with the report is "NDT Industry," which aids in identifying and referencing the specific market segment covered.
12. How do I determine which pricing option suits my needs best?
The pricing options vary based on user requirements and access needs. Individual users may opt for single-user licenses, while businesses requiring broader access may choose multi-user or enterprise licenses for cost-effective access to the report.
13. Are there any additional resources or data provided in the NDT Industry report?
While the report offers comprehensive insights, it's advisable to review the specific contents or supplementary materials provided to ascertain if additional resources or data are available.
14. How can I stay updated on further developments or reports in the NDT Industry?
To stay informed about further developments, trends, and reports in the NDT Industry, consider subscribing to industry newsletters, following relevant companies and organizations, or regularly checking reputable industry news sources and publications.
Methodology
Step 1 - Identification of Relevant Samples Size from Population Database


Step 2 - Approaches for Defining Global Market Size (Value, Volume* & Price*)

Note*: In applicable scenarios
Step 3 - Data Sources
Primary Research
- Web Analytics
- Survey Reports
- Research Institute
- Latest Research Reports
- Opinion Leaders
Secondary Research
- Annual Reports
- White Paper
- Latest Press Release
- Industry Association
- Paid Database
- Investor Presentations

Step 4 - Data Triangulation
Involves using different sources of information in order to increase the validity of a study
These sources are likely to be stakeholders in a program - participants, other researchers, program staff, other community members, and so on.
Then we put all data in single framework & apply various statistical tools to find out the dynamic on the market.
During the analysis stage, feedback from the stakeholder groups would be compared to determine areas of agreement as well as areas of divergence