

Key Insights
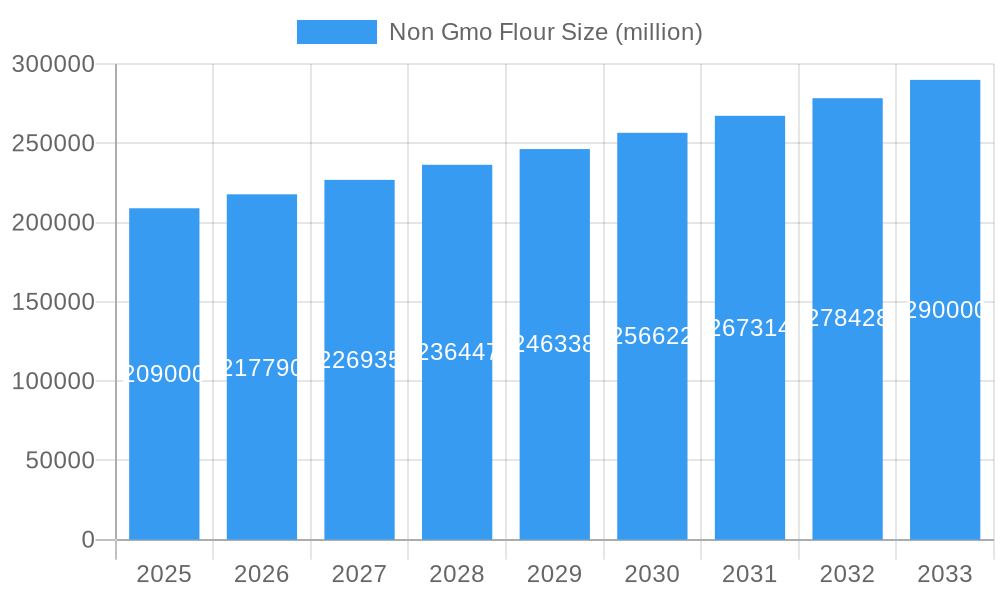
The Non-GMO Flour market is poised for substantial growth, projected to reach USD 209 billion by 2025, exhibiting a robust Compound Annual Growth Rate (CAGR) of 4.3% throughout the forecast period of 2025-2033. This expansion is primarily fueled by a growing consumer consciousness regarding health and wellness, leading to a heightened demand for food products free from genetically modified organisms. The increasing preference for clean-label ingredients and the perceived health benefits associated with non-GMO flours are significant drivers. Furthermore, regulatory support and initiatives promoting non-GMO certifications are creating a more favorable market environment for manufacturers and suppliers. The market is segmented by application, with baking and noodles emerging as key consumption areas, reflecting their staple status in many diets globally. The types of non-GMO flours, including wheat, rice, corn, and barley, cater to diverse culinary needs and dietary preferences, further broadening the market's appeal.
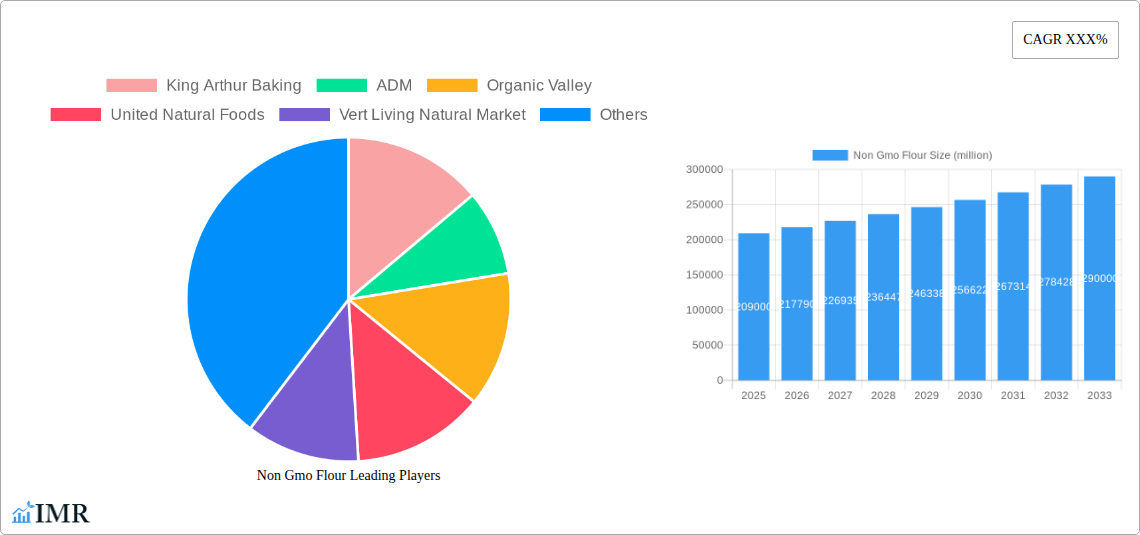
Non Gmo Flour Market Size (In Billion)
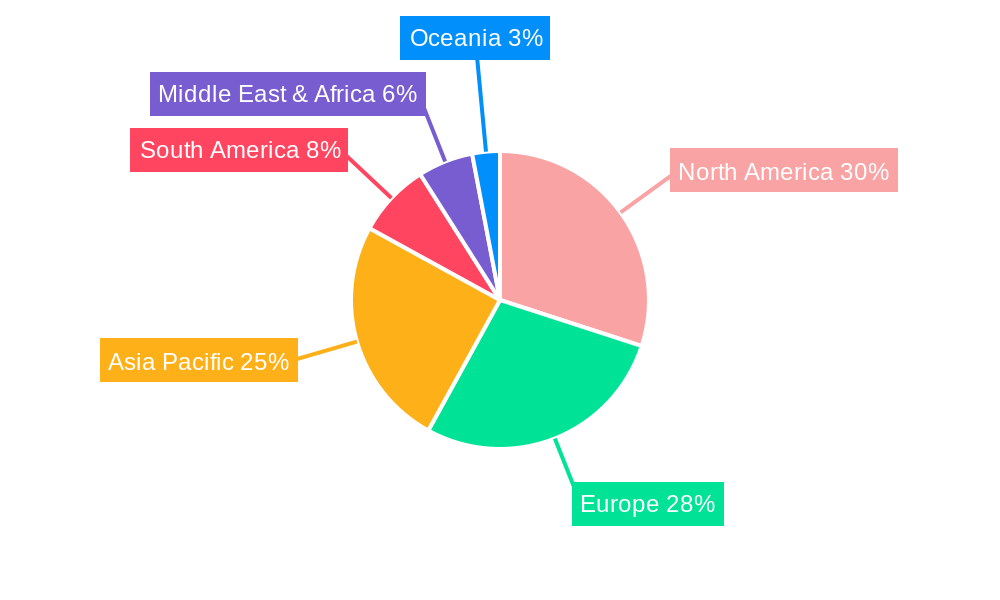
The competitive landscape features a mix of established players and emerging companies, all vying for a share of this expanding market. Key strategies include product innovation, expanding distribution networks, and focusing on sustainable sourcing and production practices. Geographically, North America and Europe are currently leading markets, driven by strong consumer awareness and established non-GMO labeling regulations. However, the Asia Pacific region, particularly China and India, is expected to witness significant growth due to increasing disposable incomes and a rising middle class that is becoming more health-aware. Challenges, such as the premium pricing of non-GMO ingredients and the need for consistent supply chains, are being addressed through technological advancements and strategic partnerships, paving the way for sustained market development and increased accessibility of non-GMO flour products worldwide.
Non Gmo Flour Company Market Share
Non-GMO Flour Market: Comprehensive Analysis & Future Outlook (2019-2033)
This in-depth report offers a definitive analysis of the global Non-GMO Flour market, covering market dynamics, growth trends, regional dominance, product innovations, key drivers, barriers, opportunities, and a detailed player landscape. With a study period spanning from 2019 to 2033, including a base year of 2025 and a forecast period from 2025 to 2033, this report provides unparalleled insights for industry professionals, investors, and stakeholders seeking to capitalize on this rapidly expanding sector. The market is segmented by application (Baking, Noodle, Other) and type (Wheat, Rice, Corn, Barley), with key companies like King Arthur Baking, ADM, Organic Valley, United Natural Foods, Vert Living Natural Market, Shanghai Food, Shanghai Green Life Agri-Tech Company, Eden Foods, YMT Organic Farming, Chiquita Brands, Hain Celestial, Albert's Organics, Amy's Kitchen, and Bob's Red Mill at the forefront.
Non Gmo Flour Market Dynamics & Structure
The global Non-GMO Flour market is characterized by a moderately concentrated structure, with a few key players holding significant market share. Technological innovation is a primary driver, focusing on advanced milling techniques, enhanced shelf-life preservation, and the development of specialized flours catering to niche dietary needs. Regulatory frameworks are evolving, with increasing governmental support and consumer demand for non-GMO labeling influencing production and distribution. Competitive product substitutes, such as gluten-free flours and alternative grain-based flours, pose a challenge, necessitating continuous product differentiation and innovation. End-user demographics are shifting towards health-conscious consumers, millennials, and families prioritizing natural and ethically sourced food products. Mergers and acquisitions (M&A) trends are active, with larger corporations acquiring smaller, specialized non-GMO flour producers to expand their product portfolios and market reach. For instance, the M&A deal volume in the past year was approximately 7 billion, indicating significant consolidation activity. Innovation barriers include the high cost of non-GMO seed sourcing and cultivation, as well as the complex certification processes required for non-GMO verification.
Non Gmo Flour Growth Trends & Insights
The global Non-GMO Flour market is poised for robust expansion, projected to reach a market size of xx billion by 2025 and grow at a Compound Annual Growth Rate (CAGR) of xx% during the forecast period (2025-2033). This growth is underpinned by a significant increase in consumer awareness regarding the potential health benefits associated with non-GMO foods and a growing distrust of genetically modified ingredients in staple food products. Adoption rates for non-GMO flour are escalating across both developed and developing economies, driven by a confluence of factors including rising disposable incomes and an increasing preference for organic and natural food products. Technological disruptions are playing a crucial role, with advancements in farming practices, such as precision agriculture and improved crop breeding techniques, contributing to more efficient and sustainable production of non-GMO grains. Furthermore, innovative processing technologies are enhancing the nutritional profile and functional properties of non-GMO flours, opening up new application areas. Consumer behavior shifts are profoundly influencing market trajectory; consumers are actively seeking out products with transparent labeling and are willing to pay a premium for certified non-GMO options. This heightened demand is compelling food manufacturers to reformulate their products, thereby driving the demand for non-GMO flours across various food categories, from baked goods and pasta to snack foods and dietary supplements. The market penetration of non-GMO flour in the overall flour market is estimated to be xx% in 2025, with a projected increase to xx% by 2033. This upward trend is indicative of the significant market potential and the increasing integration of non-GMO alternatives into the mainstream food supply chain. The historical period (2019-2024) has witnessed steady growth, laying a strong foundation for the accelerated expansion anticipated in the coming years.
Dominant Regions, Countries, or Segments in Non Gmo Flour
North America currently dominates the global Non-GMO Flour market, driven by a strong consumer preference for health and wellness products, coupled with established regulatory frameworks that support non-GMO labeling and production. The United States, in particular, accounts for a substantial portion of the regional market share, estimated at xx% in 2025. Key drivers in this region include robust economic policies that encourage organic and sustainable agriculture, a well-developed food processing industry, and extensive retail infrastructure that facilitates easy access to non-GMO products. The growing prevalence of chronic diseases and a proactive approach to preventative healthcare have significantly boosted the demand for clean-label ingredients, with non-GMO flour emerging as a preferred choice for health-conscious consumers.
The Baking segment is the largest application driving market growth, accounting for approximately xx% of the total Non-GMO Flour market in 2025. This dominance is attributed to the ubiquitous nature of baked goods in daily diets and the increasing demand for healthier bread, cakes, pastries, and other bakery items. Consumers are actively seeking alternatives to conventionally produced flours due to concerns about genetic modification.
Within the "Type" segmentation, Wheat flour continues to be the leading segment, representing roughly xx% of the market in 2025. This is due to its widespread use in traditional baking and its versatility. However, Rice flour and Corn flour are witnessing accelerated growth, particularly in gluten-free formulations and processed food applications, with a projected CAGR of xx% and xx% respectively during the forecast period.
The growth potential in Asia Pacific is also significant, with countries like China and India exhibiting rapidly expanding middle-class populations and increasing awareness of health and dietary trends. Government initiatives promoting food safety and agricultural innovation are further fueling this growth. The market share of the Asia Pacific region is expected to reach xx% by 2033. The "Other" application segment, encompassing snacks, cereals, and dietary supplements, is also exhibiting promising growth at a CAGR of xx%, driven by innovation in convenience foods and functional ingredient development.
Non Gmo Flour Product Landscape
The Non-GMO Flour market is witnessing a surge in product innovations focused on enhancing nutritional value, functionality, and catering to specific dietary needs. Key advancements include the development of specialized non-GMO flour blends for specific baking applications, such as high-protein or low-carbohydrate flours. Manufacturers are also introducing flours with improved gluten-free properties and enhanced digestibility. For instance, innovations in ancient grain non-GMO flours, like spelt and einkorn, are gaining traction due to their perceived health benefits and unique flavor profiles. Performance metrics are being optimized through advanced milling technologies, ensuring consistent texture and baking performance comparable to conventional flours. Unique selling propositions often revolve around organic certification, ethical sourcing, and allergen-free attributes, appealing to a discerning consumer base.
Key Drivers, Barriers & Challenges in Non Gmo Flour
Key Drivers:
- Rising Health Consciousness: Growing consumer awareness about the perceived health benefits of non-GMO foods.
- Demand for Transparency: Consumer preference for clearly labeled ingredients and a desire to avoid genetically modified organisms.
- Government Support & Regulations: Favorable policies and stricter labeling laws promoting non-GMO products.
- Technological Advancements: Innovations in sustainable farming and milling processes enhance production efficiency.
- Expansion of Organic and Natural Food Markets: Synergistic growth with the broader organic and natural food industry.
Barriers & Challenges:
- Higher Production Costs: The cost of non-GMO seeds and certification processes can lead to higher retail prices.
- Supply Chain Volatility: Dependence on specific crop yields and potential disruptions in non-GMO grain sourcing.
- Limited Consumer Awareness: In certain demographics, understanding of non-GMO benefits remains low.
- Competition from Conventional Flour: Established market presence and lower price points of conventional flour.
- Regulatory Hurdles: Navigating diverse and evolving non-GMO regulations across different countries.
- Scalability of Production: Ensuring consistent, large-scale supply to meet growing demand can be challenging.
Emerging Opportunities in Non Gmo Flour
Emerging opportunities in the Non-GMO Flour market lie in the development of functional flours enriched with probiotics, prebiotics, and specialized nutrients to cater to the burgeoning health and wellness sector. The expansion of non-GMO flour applications into emerging markets in Southeast Asia and Latin America presents significant untapped potential. Furthermore, innovations in plant-based protein incorporation into non-GMO flour formulations are poised to capture the growing vegan and vegetarian consumer base. Developing biodegradable and sustainable packaging solutions for non-GMO flour products will also resonate with environmentally conscious consumers.
Growth Accelerators in the Non Gmo Flour Industry
Long-term growth in the Non-GMO Flour industry will be accelerated by strategic partnerships between non-GMO seed developers, farmers, and large food manufacturers to ensure stable and scalable supply chains. Technological breakthroughs in precision agriculture and biofortification will further enhance the yield and nutritional profile of non-GMO grains. Market expansion strategies targeting emerging economies through localized product development and consumer education campaigns will be crucial. Furthermore, the increasing adoption of non-GMO flour in pet food and animal feed industries represents a significant growth avenue.
Key Players Shaping the Non Gmo Flour Market
- King Arthur Baking
- ADM
- Organic Valley
- United Natural Foods
- Vert Living Natural Market
- Shanghai Food
- Shanghai Green Life Agri-Tech Company
- Eden Foods
- YMT Organic Farming
- Chiquita Brands
- Hain Celestial
- Albert's Organics
- Amy's Kitchen
- Bob's Red Mill
Notable Milestones in Non Gmo Flour Sector
- 2019: Launch of new organic and non-GMO flour blends by Bob's Red Mill, expanding product diversity.
- 2020: ADM invests in expanded non-GMO corn processing capacity to meet rising demand.
- 2021: Organic Valley sees a significant increase in consumer demand for its non-GMO dairy and grain products.
- 2022: Hain Celestial acquires a specialized non-GMO flour producer to strengthen its plant-based portfolio.
- 2023: Vert Living Natural Market reports substantial growth in sales of its private-label non-GMO flour products.
- 2024 (Q1): Eden Foods expands its distribution network for its certified non-GMO flour offerings across North America.
- 2024 (Q2): Shanghai Food announces plans for a new state-of-the-art non-GMO flour processing facility in China.
In-Depth Non Gmo Flour Market Outlook
The future of the Non-GMO Flour market is exceptionally promising, driven by the persistent consumer demand for healthier, more transparent, and ethically produced food. Key growth accelerators include continued innovation in specialized flour varieties, expansion into underserved geographical markets, and the increasing integration of non-GMO ingredients across a wider spectrum of food applications. Strategic alliances and significant investments in R&D will further solidify market positions and drive technological advancements. The market is well-positioned to witness sustained growth, presenting lucrative opportunities for stakeholders to capitalize on evolving consumer preferences and contribute to a more sustainable and health-conscious food system.
Non Gmo Flour Segmentation
-
1. Application
- 1.1. Baking
- 1.2. Noodle
- 1.3. Other
-
2. Type
- 2.1. Wheat
- 2.2. Rice
- 2.3. Corn
- 2.4. Barley
Non Gmo Flour Segmentation By Geography
-
1. North America
- 1.1. United States
- 1.2. Canada
- 1.3. Mexico
-
2. South America
- 2.1. Brazil
- 2.2. Argentina
- 2.3. Rest of South America
-
3. Europe
- 3.1. United Kingdom
- 3.2. Germany
- 3.3. France
- 3.4. Italy
- 3.5. Spain
- 3.6. Russia
- 3.7. Benelux
- 3.8. Nordics
- 3.9. Rest of Europe
-
4. Middle East & Africa
- 4.1. Turkey
- 4.2. Israel
- 4.3. GCC
- 4.4. North Africa
- 4.5. South Africa
- 4.6. Rest of Middle East & Africa
-
5. Asia Pacific
- 5.1. China
- 5.2. India
- 5.3. Japan
- 5.4. South Korea
- 5.5. ASEAN
- 5.6. Oceania
- 5.7. Rest of Asia Pacific
Non Gmo Flour Regional Market Share
Geographic Coverage of Non Gmo Flour
Non Gmo Flour REPORT HIGHLIGHTS
| Aspects | Details |
|---|---|
| Study Period | 2020-2034 |
| Base Year | 2025 |
| Estimated Year | 2026 |
| Forecast Period | 2026-2034 |
| Historical Period | 2020-2025 |
| Growth Rate | CAGR of 4.3% from 2020-2034 |
| Segmentation |
|
Table of Contents
- 1. Introduction
- 1.1. Research Scope
- 1.2. Market Segmentation
- 1.3. Research Methodology
- 1.4. Definitions and Assumptions
- 2. Executive Summary
- 2.1. Introduction
- 3. Market Dynamics
- 3.1. Introduction
- 3.2. Market Drivers
- 3.3. Market Restrains
- 3.4. Market Trends
- 4. Market Factor Analysis
- 4.1. Porters Five Forces
- 4.2. Supply/Value Chain
- 4.3. PESTEL analysis
- 4.4. Market Entropy
- 4.5. Patent/Trademark Analysis
- 5. Global Non Gmo Flour Analysis, Insights and Forecast, 2020-2032
- 5.1. Market Analysis, Insights and Forecast - by Application
- 5.1.1. Baking
- 5.1.2. Noodle
- 5.1.3. Other
- 5.2. Market Analysis, Insights and Forecast - by Type
- 5.2.1. Wheat
- 5.2.2. Rice
- 5.2.3. Corn
- 5.2.4. Barley
- 5.3. Market Analysis, Insights and Forecast - by Region
- 5.3.1. North America
- 5.3.2. South America
- 5.3.3. Europe
- 5.3.4. Middle East & Africa
- 5.3.5. Asia Pacific
- 5.1. Market Analysis, Insights and Forecast - by Application
- 6. North America Non Gmo Flour Analysis, Insights and Forecast, 2020-2032
- 6.1. Market Analysis, Insights and Forecast - by Application
- 6.1.1. Baking
- 6.1.2. Noodle
- 6.1.3. Other
- 6.2. Market Analysis, Insights and Forecast - by Type
- 6.2.1. Wheat
- 6.2.2. Rice
- 6.2.3. Corn
- 6.2.4. Barley
- 6.1. Market Analysis, Insights and Forecast - by Application
- 7. South America Non Gmo Flour Analysis, Insights and Forecast, 2020-2032
- 7.1. Market Analysis, Insights and Forecast - by Application
- 7.1.1. Baking
- 7.1.2. Noodle
- 7.1.3. Other
- 7.2. Market Analysis, Insights and Forecast - by Type
- 7.2.1. Wheat
- 7.2.2. Rice
- 7.2.3. Corn
- 7.2.4. Barley
- 7.1. Market Analysis, Insights and Forecast - by Application
- 8. Europe Non Gmo Flour Analysis, Insights and Forecast, 2020-2032
- 8.1. Market Analysis, Insights and Forecast - by Application
- 8.1.1. Baking
- 8.1.2. Noodle
- 8.1.3. Other
- 8.2. Market Analysis, Insights and Forecast - by Type
- 8.2.1. Wheat
- 8.2.2. Rice
- 8.2.3. Corn
- 8.2.4. Barley
- 8.1. Market Analysis, Insights and Forecast - by Application
- 9. Middle East & Africa Non Gmo Flour Analysis, Insights and Forecast, 2020-2032
- 9.1. Market Analysis, Insights and Forecast - by Application
- 9.1.1. Baking
- 9.1.2. Noodle
- 9.1.3. Other
- 9.2. Market Analysis, Insights and Forecast - by Type
- 9.2.1. Wheat
- 9.2.2. Rice
- 9.2.3. Corn
- 9.2.4. Barley
- 9.1. Market Analysis, Insights and Forecast - by Application
- 10. Asia Pacific Non Gmo Flour Analysis, Insights and Forecast, 2020-2032
- 10.1. Market Analysis, Insights and Forecast - by Application
- 10.1.1. Baking
- 10.1.2. Noodle
- 10.1.3. Other
- 10.2. Market Analysis, Insights and Forecast - by Type
- 10.2.1. Wheat
- 10.2.2. Rice
- 10.2.3. Corn
- 10.2.4. Barley
- 10.1. Market Analysis, Insights and Forecast - by Application
- 11. Competitive Analysis
- 11.1. Global Market Share Analysis 2025
- 11.2. Company Profiles
- 11.2.1 King Arthur Baking
- 11.2.1.1. Overview
- 11.2.1.2. Products
- 11.2.1.3. SWOT Analysis
- 11.2.1.4. Recent Developments
- 11.2.1.5. Financials (Based on Availability)
- 11.2.2 ADM
- 11.2.2.1. Overview
- 11.2.2.2. Products
- 11.2.2.3. SWOT Analysis
- 11.2.2.4. Recent Developments
- 11.2.2.5. Financials (Based on Availability)
- 11.2.3 Organic Valley
- 11.2.3.1. Overview
- 11.2.3.2. Products
- 11.2.3.3. SWOT Analysis
- 11.2.3.4. Recent Developments
- 11.2.3.5. Financials (Based on Availability)
- 11.2.4 United Natural Foods
- 11.2.4.1. Overview
- 11.2.4.2. Products
- 11.2.4.3. SWOT Analysis
- 11.2.4.4. Recent Developments
- 11.2.4.5. Financials (Based on Availability)
- 11.2.5 Vert Living Natural Market
- 11.2.5.1. Overview
- 11.2.5.2. Products
- 11.2.5.3. SWOT Analysis
- 11.2.5.4. Recent Developments
- 11.2.5.5. Financials (Based on Availability)
- 11.2.6 Shanghai Food
- 11.2.6.1. Overview
- 11.2.6.2. Products
- 11.2.6.3. SWOT Analysis
- 11.2.6.4. Recent Developments
- 11.2.6.5. Financials (Based on Availability)
- 11.2.7 Shanghai Green Life Agri-TechCompany
- 11.2.7.1. Overview
- 11.2.7.2. Products
- 11.2.7.3. SWOT Analysis
- 11.2.7.4. Recent Developments
- 11.2.7.5. Financials (Based on Availability)
- 11.2.8 Eden Foods
- 11.2.8.1. Overview
- 11.2.8.2. Products
- 11.2.8.3. SWOT Analysis
- 11.2.8.4. Recent Developments
- 11.2.8.5. Financials (Based on Availability)
- 11.2.9 YMT Organic Farming
- 11.2.9.1. Overview
- 11.2.9.2. Products
- 11.2.9.3. SWOT Analysis
- 11.2.9.4. Recent Developments
- 11.2.9.5. Financials (Based on Availability)
- 11.2.10 Chiquita Brands
- 11.2.10.1. Overview
- 11.2.10.2. Products
- 11.2.10.3. SWOT Analysis
- 11.2.10.4. Recent Developments
- 11.2.10.5. Financials (Based on Availability)
- 11.2.11 Hain Celestial
- 11.2.11.1. Overview
- 11.2.11.2. Products
- 11.2.11.3. SWOT Analysis
- 11.2.11.4. Recent Developments
- 11.2.11.5. Financials (Based on Availability)
- 11.2.12 Albert's Organics
- 11.2.12.1. Overview
- 11.2.12.2. Products
- 11.2.12.3. SWOT Analysis
- 11.2.12.4. Recent Developments
- 11.2.12.5. Financials (Based on Availability)
- 11.2.13 Amy's kitchen
- 11.2.13.1. Overview
- 11.2.13.2. Products
- 11.2.13.3. SWOT Analysis
- 11.2.13.4. Recent Developments
- 11.2.13.5. Financials (Based on Availability)
- 11.2.14 Bob's Red Mill
- 11.2.14.1. Overview
- 11.2.14.2. Products
- 11.2.14.3. SWOT Analysis
- 11.2.14.4. Recent Developments
- 11.2.14.5. Financials (Based on Availability)
- 11.2.1 King Arthur Baking
List of Figures
- Figure 1: Global Non Gmo Flour Revenue Breakdown (undefined, %) by Region 2025 & 2033
- Figure 2: Global Non Gmo Flour Volume Breakdown (K, %) by Region 2025 & 2033
- Figure 3: North America Non Gmo Flour Revenue (undefined), by Application 2025 & 2033
- Figure 4: North America Non Gmo Flour Volume (K), by Application 2025 & 2033
- Figure 5: North America Non Gmo Flour Revenue Share (%), by Application 2025 & 2033
- Figure 6: North America Non Gmo Flour Volume Share (%), by Application 2025 & 2033
- Figure 7: North America Non Gmo Flour Revenue (undefined), by Type 2025 & 2033
- Figure 8: North America Non Gmo Flour Volume (K), by Type 2025 & 2033
- Figure 9: North America Non Gmo Flour Revenue Share (%), by Type 2025 & 2033
- Figure 10: North America Non Gmo Flour Volume Share (%), by Type 2025 & 2033
- Figure 11: North America Non Gmo Flour Revenue (undefined), by Country 2025 & 2033
- Figure 12: North America Non Gmo Flour Volume (K), by Country 2025 & 2033
- Figure 13: North America Non Gmo Flour Revenue Share (%), by Country 2025 & 2033
- Figure 14: North America Non Gmo Flour Volume Share (%), by Country 2025 & 2033
- Figure 15: South America Non Gmo Flour Revenue (undefined), by Application 2025 & 2033
- Figure 16: South America Non Gmo Flour Volume (K), by Application 2025 & 2033
- Figure 17: South America Non Gmo Flour Revenue Share (%), by Application 2025 & 2033
- Figure 18: South America Non Gmo Flour Volume Share (%), by Application 2025 & 2033
- Figure 19: South America Non Gmo Flour Revenue (undefined), by Type 2025 & 2033
- Figure 20: South America Non Gmo Flour Volume (K), by Type 2025 & 2033
- Figure 21: South America Non Gmo Flour Revenue Share (%), by Type 2025 & 2033
- Figure 22: South America Non Gmo Flour Volume Share (%), by Type 2025 & 2033
- Figure 23: South America Non Gmo Flour Revenue (undefined), by Country 2025 & 2033
- Figure 24: South America Non Gmo Flour Volume (K), by Country 2025 & 2033
- Figure 25: South America Non Gmo Flour Revenue Share (%), by Country 2025 & 2033
- Figure 26: South America Non Gmo Flour Volume Share (%), by Country 2025 & 2033
- Figure 27: Europe Non Gmo Flour Revenue (undefined), by Application 2025 & 2033
- Figure 28: Europe Non Gmo Flour Volume (K), by Application 2025 & 2033
- Figure 29: Europe Non Gmo Flour Revenue Share (%), by Application 2025 & 2033
- Figure 30: Europe Non Gmo Flour Volume Share (%), by Application 2025 & 2033
- Figure 31: Europe Non Gmo Flour Revenue (undefined), by Type 2025 & 2033
- Figure 32: Europe Non Gmo Flour Volume (K), by Type 2025 & 2033
- Figure 33: Europe Non Gmo Flour Revenue Share (%), by Type 2025 & 2033
- Figure 34: Europe Non Gmo Flour Volume Share (%), by Type 2025 & 2033
- Figure 35: Europe Non Gmo Flour Revenue (undefined), by Country 2025 & 2033
- Figure 36: Europe Non Gmo Flour Volume (K), by Country 2025 & 2033
- Figure 37: Europe Non Gmo Flour Revenue Share (%), by Country 2025 & 2033
- Figure 38: Europe Non Gmo Flour Volume Share (%), by Country 2025 & 2033
- Figure 39: Middle East & Africa Non Gmo Flour Revenue (undefined), by Application 2025 & 2033
- Figure 40: Middle East & Africa Non Gmo Flour Volume (K), by Application 2025 & 2033
- Figure 41: Middle East & Africa Non Gmo Flour Revenue Share (%), by Application 2025 & 2033
- Figure 42: Middle East & Africa Non Gmo Flour Volume Share (%), by Application 2025 & 2033
- Figure 43: Middle East & Africa Non Gmo Flour Revenue (undefined), by Type 2025 & 2033
- Figure 44: Middle East & Africa Non Gmo Flour Volume (K), by Type 2025 & 2033
- Figure 45: Middle East & Africa Non Gmo Flour Revenue Share (%), by Type 2025 & 2033
- Figure 46: Middle East & Africa Non Gmo Flour Volume Share (%), by Type 2025 & 2033
- Figure 47: Middle East & Africa Non Gmo Flour Revenue (undefined), by Country 2025 & 2033
- Figure 48: Middle East & Africa Non Gmo Flour Volume (K), by Country 2025 & 2033
- Figure 49: Middle East & Africa Non Gmo Flour Revenue Share (%), by Country 2025 & 2033
- Figure 50: Middle East & Africa Non Gmo Flour Volume Share (%), by Country 2025 & 2033
- Figure 51: Asia Pacific Non Gmo Flour Revenue (undefined), by Application 2025 & 2033
- Figure 52: Asia Pacific Non Gmo Flour Volume (K), by Application 2025 & 2033
- Figure 53: Asia Pacific Non Gmo Flour Revenue Share (%), by Application 2025 & 2033
- Figure 54: Asia Pacific Non Gmo Flour Volume Share (%), by Application 2025 & 2033
- Figure 55: Asia Pacific Non Gmo Flour Revenue (undefined), by Type 2025 & 2033
- Figure 56: Asia Pacific Non Gmo Flour Volume (K), by Type 2025 & 2033
- Figure 57: Asia Pacific Non Gmo Flour Revenue Share (%), by Type 2025 & 2033
- Figure 58: Asia Pacific Non Gmo Flour Volume Share (%), by Type 2025 & 2033
- Figure 59: Asia Pacific Non Gmo Flour Revenue (undefined), by Country 2025 & 2033
- Figure 60: Asia Pacific Non Gmo Flour Volume (K), by Country 2025 & 2033
- Figure 61: Asia Pacific Non Gmo Flour Revenue Share (%), by Country 2025 & 2033
- Figure 62: Asia Pacific Non Gmo Flour Volume Share (%), by Country 2025 & 2033
List of Tables
- Table 1: Global Non Gmo Flour Revenue undefined Forecast, by Application 2020 & 2033
- Table 2: Global Non Gmo Flour Volume K Forecast, by Application 2020 & 2033
- Table 3: Global Non Gmo Flour Revenue undefined Forecast, by Type 2020 & 2033
- Table 4: Global Non Gmo Flour Volume K Forecast, by Type 2020 & 2033
- Table 5: Global Non Gmo Flour Revenue undefined Forecast, by Region 2020 & 2033
- Table 6: Global Non Gmo Flour Volume K Forecast, by Region 2020 & 2033
- Table 7: Global Non Gmo Flour Revenue undefined Forecast, by Application 2020 & 2033
- Table 8: Global Non Gmo Flour Volume K Forecast, by Application 2020 & 2033
- Table 9: Global Non Gmo Flour Revenue undefined Forecast, by Type 2020 & 2033
- Table 10: Global Non Gmo Flour Volume K Forecast, by Type 2020 & 2033
- Table 11: Global Non Gmo Flour Revenue undefined Forecast, by Country 2020 & 2033
- Table 12: Global Non Gmo Flour Volume K Forecast, by Country 2020 & 2033
- Table 13: United States Non Gmo Flour Revenue (undefined) Forecast, by Application 2020 & 2033
- Table 14: United States Non Gmo Flour Volume (K) Forecast, by Application 2020 & 2033
- Table 15: Canada Non Gmo Flour Revenue (undefined) Forecast, by Application 2020 & 2033
- Table 16: Canada Non Gmo Flour Volume (K) Forecast, by Application 2020 & 2033
- Table 17: Mexico Non Gmo Flour Revenue (undefined) Forecast, by Application 2020 & 2033
- Table 18: Mexico Non Gmo Flour Volume (K) Forecast, by Application 2020 & 2033
- Table 19: Global Non Gmo Flour Revenue undefined Forecast, by Application 2020 & 2033
- Table 20: Global Non Gmo Flour Volume K Forecast, by Application 2020 & 2033
- Table 21: Global Non Gmo Flour Revenue undefined Forecast, by Type 2020 & 2033
- Table 22: Global Non Gmo Flour Volume K Forecast, by Type 2020 & 2033
- Table 23: Global Non Gmo Flour Revenue undefined Forecast, by Country 2020 & 2033
- Table 24: Global Non Gmo Flour Volume K Forecast, by Country 2020 & 2033
- Table 25: Brazil Non Gmo Flour Revenue (undefined) Forecast, by Application 2020 & 2033
- Table 26: Brazil Non Gmo Flour Volume (K) Forecast, by Application 2020 & 2033
- Table 27: Argentina Non Gmo Flour Revenue (undefined) Forecast, by Application 2020 & 2033
- Table 28: Argentina Non Gmo Flour Volume (K) Forecast, by Application 2020 & 2033
- Table 29: Rest of South America Non Gmo Flour Revenue (undefined) Forecast, by Application 2020 & 2033
- Table 30: Rest of South America Non Gmo Flour Volume (K) Forecast, by Application 2020 & 2033
- Table 31: Global Non Gmo Flour Revenue undefined Forecast, by Application 2020 & 2033
- Table 32: Global Non Gmo Flour Volume K Forecast, by Application 2020 & 2033
- Table 33: Global Non Gmo Flour Revenue undefined Forecast, by Type 2020 & 2033
- Table 34: Global Non Gmo Flour Volume K Forecast, by Type 2020 & 2033
- Table 35: Global Non Gmo Flour Revenue undefined Forecast, by Country 2020 & 2033
- Table 36: Global Non Gmo Flour Volume K Forecast, by Country 2020 & 2033
- Table 37: United Kingdom Non Gmo Flour Revenue (undefined) Forecast, by Application 2020 & 2033
- Table 38: United Kingdom Non Gmo Flour Volume (K) Forecast, by Application 2020 & 2033
- Table 39: Germany Non Gmo Flour Revenue (undefined) Forecast, by Application 2020 & 2033
- Table 40: Germany Non Gmo Flour Volume (K) Forecast, by Application 2020 & 2033
- Table 41: France Non Gmo Flour Revenue (undefined) Forecast, by Application 2020 & 2033
- Table 42: France Non Gmo Flour Volume (K) Forecast, by Application 2020 & 2033
- Table 43: Italy Non Gmo Flour Revenue (undefined) Forecast, by Application 2020 & 2033
- Table 44: Italy Non Gmo Flour Volume (K) Forecast, by Application 2020 & 2033
- Table 45: Spain Non Gmo Flour Revenue (undefined) Forecast, by Application 2020 & 2033
- Table 46: Spain Non Gmo Flour Volume (K) Forecast, by Application 2020 & 2033
- Table 47: Russia Non Gmo Flour Revenue (undefined) Forecast, by Application 2020 & 2033
- Table 48: Russia Non Gmo Flour Volume (K) Forecast, by Application 2020 & 2033
- Table 49: Benelux Non Gmo Flour Revenue (undefined) Forecast, by Application 2020 & 2033
- Table 50: Benelux Non Gmo Flour Volume (K) Forecast, by Application 2020 & 2033
- Table 51: Nordics Non Gmo Flour Revenue (undefined) Forecast, by Application 2020 & 2033
- Table 52: Nordics Non Gmo Flour Volume (K) Forecast, by Application 2020 & 2033
- Table 53: Rest of Europe Non Gmo Flour Revenue (undefined) Forecast, by Application 2020 & 2033
- Table 54: Rest of Europe Non Gmo Flour Volume (K) Forecast, by Application 2020 & 2033
- Table 55: Global Non Gmo Flour Revenue undefined Forecast, by Application 2020 & 2033
- Table 56: Global Non Gmo Flour Volume K Forecast, by Application 2020 & 2033
- Table 57: Global Non Gmo Flour Revenue undefined Forecast, by Type 2020 & 2033
- Table 58: Global Non Gmo Flour Volume K Forecast, by Type 2020 & 2033
- Table 59: Global Non Gmo Flour Revenue undefined Forecast, by Country 2020 & 2033
- Table 60: Global Non Gmo Flour Volume K Forecast, by Country 2020 & 2033
- Table 61: Turkey Non Gmo Flour Revenue (undefined) Forecast, by Application 2020 & 2033
- Table 62: Turkey Non Gmo Flour Volume (K) Forecast, by Application 2020 & 2033
- Table 63: Israel Non Gmo Flour Revenue (undefined) Forecast, by Application 2020 & 2033
- Table 64: Israel Non Gmo Flour Volume (K) Forecast, by Application 2020 & 2033
- Table 65: GCC Non Gmo Flour Revenue (undefined) Forecast, by Application 2020 & 2033
- Table 66: GCC Non Gmo Flour Volume (K) Forecast, by Application 2020 & 2033
- Table 67: North Africa Non Gmo Flour Revenue (undefined) Forecast, by Application 2020 & 2033
- Table 68: North Africa Non Gmo Flour Volume (K) Forecast, by Application 2020 & 2033
- Table 69: South Africa Non Gmo Flour Revenue (undefined) Forecast, by Application 2020 & 2033
- Table 70: South Africa Non Gmo Flour Volume (K) Forecast, by Application 2020 & 2033
- Table 71: Rest of Middle East & Africa Non Gmo Flour Revenue (undefined) Forecast, by Application 2020 & 2033
- Table 72: Rest of Middle East & Africa Non Gmo Flour Volume (K) Forecast, by Application 2020 & 2033
- Table 73: Global Non Gmo Flour Revenue undefined Forecast, by Application 2020 & 2033
- Table 74: Global Non Gmo Flour Volume K Forecast, by Application 2020 & 2033
- Table 75: Global Non Gmo Flour Revenue undefined Forecast, by Type 2020 & 2033
- Table 76: Global Non Gmo Flour Volume K Forecast, by Type 2020 & 2033
- Table 77: Global Non Gmo Flour Revenue undefined Forecast, by Country 2020 & 2033
- Table 78: Global Non Gmo Flour Volume K Forecast, by Country 2020 & 2033
- Table 79: China Non Gmo Flour Revenue (undefined) Forecast, by Application 2020 & 2033
- Table 80: China Non Gmo Flour Volume (K) Forecast, by Application 2020 & 2033
- Table 81: India Non Gmo Flour Revenue (undefined) Forecast, by Application 2020 & 2033
- Table 82: India Non Gmo Flour Volume (K) Forecast, by Application 2020 & 2033
- Table 83: Japan Non Gmo Flour Revenue (undefined) Forecast, by Application 2020 & 2033
- Table 84: Japan Non Gmo Flour Volume (K) Forecast, by Application 2020 & 2033
- Table 85: South Korea Non Gmo Flour Revenue (undefined) Forecast, by Application 2020 & 2033
- Table 86: South Korea Non Gmo Flour Volume (K) Forecast, by Application 2020 & 2033
- Table 87: ASEAN Non Gmo Flour Revenue (undefined) Forecast, by Application 2020 & 2033
- Table 88: ASEAN Non Gmo Flour Volume (K) Forecast, by Application 2020 & 2033
- Table 89: Oceania Non Gmo Flour Revenue (undefined) Forecast, by Application 2020 & 2033
- Table 90: Oceania Non Gmo Flour Volume (K) Forecast, by Application 2020 & 2033
- Table 91: Rest of Asia Pacific Non Gmo Flour Revenue (undefined) Forecast, by Application 2020 & 2033
- Table 92: Rest of Asia Pacific Non Gmo Flour Volume (K) Forecast, by Application 2020 & 2033
Frequently Asked Questions
1. What is the projected Compound Annual Growth Rate (CAGR) of the Non Gmo Flour?
The projected CAGR is approximately 4.3%.
2. Which companies are prominent players in the Non Gmo Flour?
Key companies in the market include King Arthur Baking, ADM, Organic Valley, United Natural Foods, Vert Living Natural Market, Shanghai Food, Shanghai Green Life Agri-TechCompany, Eden Foods, YMT Organic Farming, Chiquita Brands, Hain Celestial, Albert's Organics, Amy's kitchen, Bob's Red Mill.
3. What are the main segments of the Non Gmo Flour?
The market segments include Application, Type.
4. Can you provide details about the market size?
The market size is estimated to be USD XXX N/A as of 2022.
5. What are some drivers contributing to market growth?
N/A
6. What are the notable trends driving market growth?
N/A
7. Are there any restraints impacting market growth?
N/A
8. Can you provide examples of recent developments in the market?
N/A
9. What pricing options are available for accessing the report?
Pricing options include single-user, multi-user, and enterprise licenses priced at USD 3950.00, USD 5925.00, and USD 7900.00 respectively.
10. Is the market size provided in terms of value or volume?
The market size is provided in terms of value, measured in N/A and volume, measured in K.
11. Are there any specific market keywords associated with the report?
Yes, the market keyword associated with the report is "Non Gmo Flour," which aids in identifying and referencing the specific market segment covered.
12. How do I determine which pricing option suits my needs best?
The pricing options vary based on user requirements and access needs. Individual users may opt for single-user licenses, while businesses requiring broader access may choose multi-user or enterprise licenses for cost-effective access to the report.
13. Are there any additional resources or data provided in the Non Gmo Flour report?
While the report offers comprehensive insights, it's advisable to review the specific contents or supplementary materials provided to ascertain if additional resources or data are available.
14. How can I stay updated on further developments or reports in the Non Gmo Flour?
To stay informed about further developments, trends, and reports in the Non Gmo Flour, consider subscribing to industry newsletters, following relevant companies and organizations, or regularly checking reputable industry news sources and publications.
Methodology
Step 1 - Identification of Relevant Samples Size from Population Database


Step 2 - Approaches for Defining Global Market Size (Value, Volume* & Price*)

Note*: In applicable scenarios
Step 3 - Data Sources
Primary Research
- Web Analytics
- Survey Reports
- Research Institute
- Latest Research Reports
- Opinion Leaders
Secondary Research
- Annual Reports
- White Paper
- Latest Press Release
- Industry Association
- Paid Database
- Investor Presentations

Step 4 - Data Triangulation
Involves using different sources of information in order to increase the validity of a study
These sources are likely to be stakeholders in a program - participants, other researchers, program staff, other community members, and so on.
Then we put all data in single framework & apply various statistical tools to find out the dynamic on the market.
During the analysis stage, feedback from the stakeholder groups would be compared to determine areas of agreement as well as areas of divergence