

Key Insights
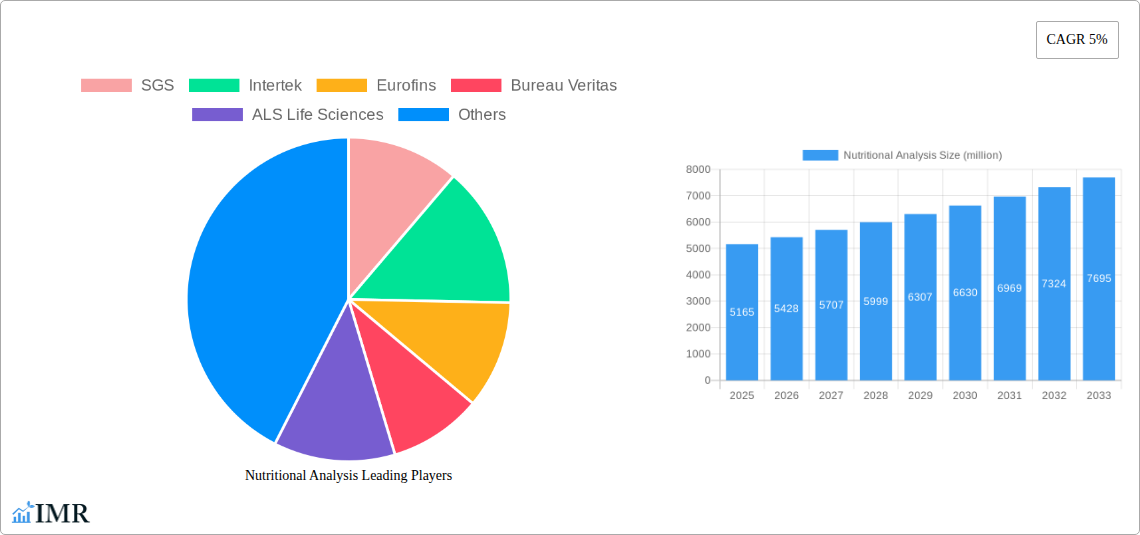
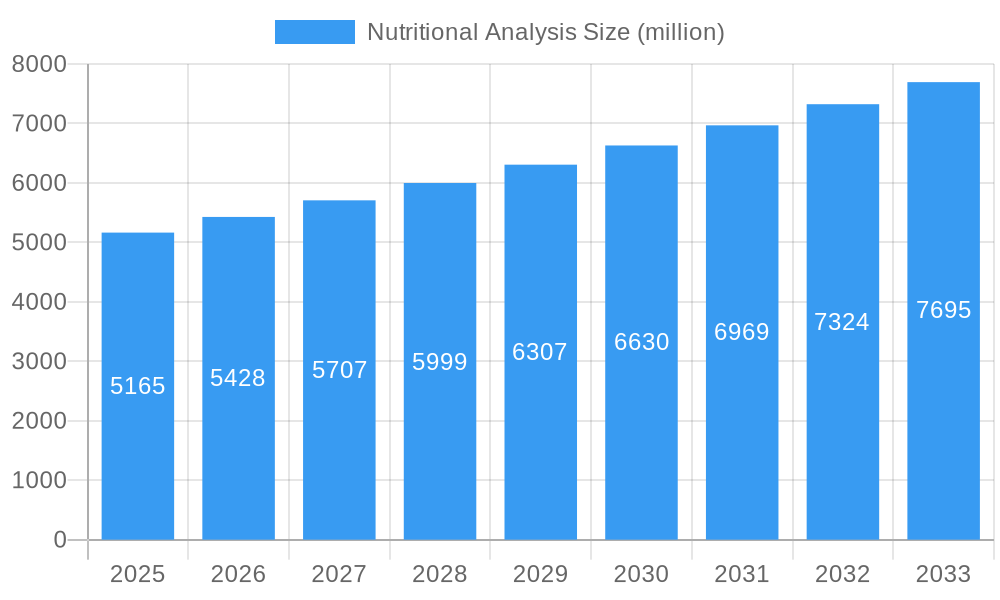
The global nutritional analysis market, valued at $6.2 billion in 2025, is poised for significant expansion. This growth is driven by heightened consumer health consciousness, stringent food safety mandates, and the escalating demand for functional foods and dietary supplements. The market is projected to achieve a Compound Annual Growth Rate (CAGR) of 11%, reflecting sustained momentum. Advancements in analytical technologies, including chromatography and mass spectrometry, are instrumental in this expansion, delivering enhanced speed, accuracy, and cost-efficiency in nutritional profiling. The thriving food processing sector and government-led initiatives promoting transparent food labeling further bolster market growth. Leading industry players are strategically investing in R&D and expanding their global reach to leverage this increasing demand. Market segmentation is expected to span diverse food categories and analytical services, such as macronutrient and micronutrient analysis, and allergen testing. The competitive landscape features established multinational corporations and specialized laboratories, indicating opportunities for both consolidation and specialized market development.
Nutritional Analysis Market Size (In Billion)
While the substantial investment required for advanced analytical equipment and specialized personnel presents challenges, ongoing technological innovations are expected to reduce equipment costs and drive the adoption of automated testing systems. Geographically, initial market dominance is anticipated in developed economies, with developing nations showing increasing potential as disposable incomes and consumer awareness rise. Future growth trajectories will be shaped by the adoption of novel analytical methodologies, the evolution of regulatory frameworks, and the deeper integration of nutritional analysis data into personalized nutrition and healthcare solutions.
Nutritional Analysis Company Market Share
Nutritional Analysis Market Report: 2019-2033
A Comprehensive Analysis of Market Dynamics, Growth Trends, and Key Players
This in-depth report provides a comprehensive analysis of the Nutritional Analysis market, offering invaluable insights for industry professionals, investors, and strategic decision-makers. Covering the period from 2019 to 2033, with a focus on the 2025-2033 forecast, this report meticulously examines market size, growth drivers, key players, and emerging trends. The report's detailed segmentation allows for a granular understanding of the parent market and its various sub-segments, providing a complete picture of this dynamic sector. The estimated market value in 2025 is xx million units, projected to reach xx million units by 2033.
Nutritional Analysis Market Dynamics & Structure
This section analyzes the competitive landscape, technological advancements, regulatory influences, and market trends within the Nutritional Analysis industry. The market is characterized by a moderately concentrated structure, with key players such as SGS, Intertek, and Eurofins holding significant market share. However, the presence of numerous smaller, specialized players contributes to a dynamic competitive environment.
- Market Concentration: The top 5 players account for approximately xx% of the global market in 2025 (estimated).
- Technological Innovation: Advancements in analytical techniques (e.g., LC-MS, GC-MS) are driving market growth, improving accuracy and efficiency. Innovation barriers include high R&D costs and the need for skilled personnel.
- Regulatory Frameworks: Stringent food safety regulations across regions are driving demand for nutritional analysis services. Variability in regulations across different jurisdictions poses challenges for global players.
- Competitive Product Substitutes: Limited direct substitutes exist, but alternative testing methodologies and in-house testing capabilities present some level of competition.
- End-User Demographics: The key end-users are food manufacturers, agricultural producers, contract research organizations, and government agencies. Growth is driven by increasing consumer demand for healthier and more transparent food products.
- M&A Trends: The market has witnessed xx M&A deals in the historical period (2019-2024), indicating consolidation and strategic expansion efforts among leading players. Further consolidation is anticipated in the forecast period.
Nutritional Analysis Growth Trends & Insights
The Nutritional Analysis market has experienced substantial growth over the historical period (2019-2024), with a CAGR of xx%. This growth is attributed to several factors, including increased consumer awareness of nutrition, stricter food safety regulations, and the expanding food processing industry. Technological advancements, such as the development of rapid and high-throughput analytical methods, have further fueled market expansion. The market is expected to maintain a robust growth trajectory during the forecast period (2025-2033), with a projected CAGR of xx%. Consumer demand for personalized nutrition and functional foods will be key drivers during this period. Market penetration is expected to increase from xx% in 2025 to xx% by 2033. Shifting consumer preferences towards healthier options are boosting the demand for accurate and reliable nutritional analysis.
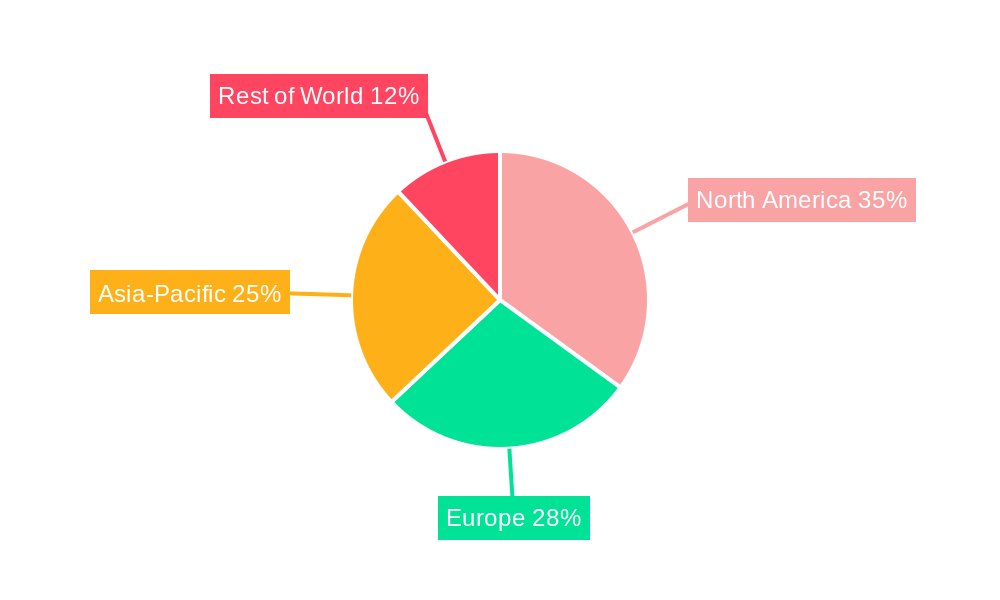
Dominant Regions, Countries, or Segments in Nutritional Analysis
North America currently holds the largest market share in the Nutritional Analysis sector, driven by strong regulatory frameworks, advanced technologies, and a well-established food processing industry. Europe follows closely, with significant growth fueled by rising consumer awareness and increasing demand for food traceability. Asia-Pacific is poised for rapid expansion, driven by robust economic growth, increasing urbanization, and rising disposable incomes.
- North America: High adoption rates of advanced analytical techniques and robust regulatory frameworks contribute to market dominance.
- Europe: Stringent food safety regulations and strong consumer focus on food quality drive significant demand.
- Asia-Pacific: Rapid economic growth and a rising middle class contribute to increasing demand for nutritional analysis services.
Nutritional Analysis Product Landscape
The nutritional analysis market offers a range of services, including proximate analysis, vitamin and mineral analysis, fatty acid profiling, and allergen testing. Continuous advancements in analytical technologies are leading to improved accuracy, speed, and efficiency. Key innovations include automated sample preparation techniques and miniaturized analytical instruments, enabling higher throughput and reduced operational costs. Unique selling propositions often center on speed, accuracy, accreditation, and customized solutions tailored to specific client needs.
Key Drivers, Barriers & Challenges in Nutritional Analysis
Key Drivers: Increasing consumer demand for healthier food products, stringent food safety regulations, technological advancements in analytical techniques, and growth in the food processing and agricultural industries are the primary drivers of market expansion.
Challenges & Restraints: High costs associated with advanced analytical equipment, the need for skilled personnel, and complex regulatory requirements across different jurisdictions pose significant challenges. Supply chain disruptions, especially in the procurement of reagents and consumables, also impact market dynamics. These factors combined represent a quantified impact of approximately xx million units annually on market growth (estimated).
Emerging Opportunities in Nutritional Analysis
Emerging trends such as personalized nutrition, functional foods, and the growing demand for food traceability present significant opportunities for market expansion. The development of rapid and portable analytical devices, enabling on-site testing, is also creating new market opportunities. Untapped markets exist in developing economies where food safety regulations are evolving.
Growth Accelerators in the Nutritional Analysis Industry
Strategic partnerships between analytical service providers and food companies are accelerating market growth. Technological advancements, particularly in automation and data analytics, are improving efficiency and lowering costs. Market expansion into emerging economies and the development of novel analytical techniques for specific food matrices are further contributing to sustained growth.
Key Players Shaping the Nutritional Analysis Market
- SGS
- Intertek
- Eurofins
- Bureau Veritas
- ALS Life Sciences
- Merieux Nutrisciences
- TUV NORD
- Tentamus Analytics
- AsureQuality
- Japan Food Research Laboratories
- CCIC
- DTS Food Laboratories
- Premier Analytical Services
- Compu-Food Analysis
- Fitz Scientific
- AGQ Labs
- Shokukanken
Notable Milestones in Nutritional Analysis Sector
- 2021: Introduction of a new rapid method for allergen detection by Eurofins.
- 2022: SGS acquires a specialized nutritional analysis laboratory in [location], expanding its geographic reach.
- 2023: Launch of a new high-throughput analytical platform by Intertek, significantly increasing testing capacity. (Specific examples are limited due to publicly available information; further details can be provided with client-specific data.)
In-Depth Nutritional Analysis Market Outlook
The Nutritional Analysis market is poised for continued growth, driven by technological advancements, increasing consumer demand for healthier food, and strengthening regulatory frameworks. Strategic partnerships and market expansion into new geographical regions will further propel market expansion. The potential for innovative applications, such as personalized nutrition and food traceability, offers substantial opportunities for future growth and presents significant scope for strategic investments in the sector.
Nutritional Analysis Segmentation
-
1. Application
- 1.1. Enterprise Users
- 1.2. Government Users
-
2. Type
- 2.1. Macro Nutrients Analysis
- 2.2. Minerals Analysis
- 2.3. Vitamins Analysis
- 2.4. Others
Nutritional Analysis Segmentation By Geography
-
1. North America
- 1.1. United States
- 1.2. Canada
- 1.3. Mexico
-
2. South America
- 2.1. Brazil
- 2.2. Argentina
- 2.3. Rest of South America
-
3. Europe
- 3.1. United Kingdom
- 3.2. Germany
- 3.3. France
- 3.4. Italy
- 3.5. Spain
- 3.6. Russia
- 3.7. Benelux
- 3.8. Nordics
- 3.9. Rest of Europe
-
4. Middle East & Africa
- 4.1. Turkey
- 4.2. Israel
- 4.3. GCC
- 4.4. North Africa
- 4.5. South Africa
- 4.6. Rest of Middle East & Africa
-
5. Asia Pacific
- 5.1. China
- 5.2. India
- 5.3. Japan
- 5.4. South Korea
- 5.5. ASEAN
- 5.6. Oceania
- 5.7. Rest of Asia Pacific
Nutritional Analysis Regional Market Share
Geographic Coverage of Nutritional Analysis
Nutritional Analysis REPORT HIGHLIGHTS
| Aspects | Details |
|---|---|
| Study Period | 2020-2034 |
| Base Year | 2025 |
| Estimated Year | 2026 |
| Forecast Period | 2026-2034 |
| Historical Period | 2020-2025 |
| Growth Rate | CAGR of 11% from 2020-2034 |
| Segmentation |
|
Table of Contents
- 1. Introduction
- 1.1. Research Scope
- 1.2. Market Segmentation
- 1.3. Research Methodology
- 1.4. Definitions and Assumptions
- 2. Executive Summary
- 2.1. Introduction
- 3. Market Dynamics
- 3.1. Introduction
- 3.2. Market Drivers
- 3.3. Market Restrains
- 3.4. Market Trends
- 4. Market Factor Analysis
- 4.1. Porters Five Forces
- 4.2. Supply/Value Chain
- 4.3. PESTEL analysis
- 4.4. Market Entropy
- 4.5. Patent/Trademark Analysis
- 5. Global Nutritional Analysis Analysis, Insights and Forecast, 2020-2032
- 5.1. Market Analysis, Insights and Forecast - by Application
- 5.1.1. Enterprise Users
- 5.1.2. Government Users
- 5.2. Market Analysis, Insights and Forecast - by Type
- 5.2.1. Macro Nutrients Analysis
- 5.2.2. Minerals Analysis
- 5.2.3. Vitamins Analysis
- 5.2.4. Others
- 5.3. Market Analysis, Insights and Forecast - by Region
- 5.3.1. North America
- 5.3.2. South America
- 5.3.3. Europe
- 5.3.4. Middle East & Africa
- 5.3.5. Asia Pacific
- 5.1. Market Analysis, Insights and Forecast - by Application
- 6. North America Nutritional Analysis Analysis, Insights and Forecast, 2020-2032
- 6.1. Market Analysis, Insights and Forecast - by Application
- 6.1.1. Enterprise Users
- 6.1.2. Government Users
- 6.2. Market Analysis, Insights and Forecast - by Type
- 6.2.1. Macro Nutrients Analysis
- 6.2.2. Minerals Analysis
- 6.2.3. Vitamins Analysis
- 6.2.4. Others
- 6.1. Market Analysis, Insights and Forecast - by Application
- 7. South America Nutritional Analysis Analysis, Insights and Forecast, 2020-2032
- 7.1. Market Analysis, Insights and Forecast - by Application
- 7.1.1. Enterprise Users
- 7.1.2. Government Users
- 7.2. Market Analysis, Insights and Forecast - by Type
- 7.2.1. Macro Nutrients Analysis
- 7.2.2. Minerals Analysis
- 7.2.3. Vitamins Analysis
- 7.2.4. Others
- 7.1. Market Analysis, Insights and Forecast - by Application
- 8. Europe Nutritional Analysis Analysis, Insights and Forecast, 2020-2032
- 8.1. Market Analysis, Insights and Forecast - by Application
- 8.1.1. Enterprise Users
- 8.1.2. Government Users
- 8.2. Market Analysis, Insights and Forecast - by Type
- 8.2.1. Macro Nutrients Analysis
- 8.2.2. Minerals Analysis
- 8.2.3. Vitamins Analysis
- 8.2.4. Others
- 8.1. Market Analysis, Insights and Forecast - by Application
- 9. Middle East & Africa Nutritional Analysis Analysis, Insights and Forecast, 2020-2032
- 9.1. Market Analysis, Insights and Forecast - by Application
- 9.1.1. Enterprise Users
- 9.1.2. Government Users
- 9.2. Market Analysis, Insights and Forecast - by Type
- 9.2.1. Macro Nutrients Analysis
- 9.2.2. Minerals Analysis
- 9.2.3. Vitamins Analysis
- 9.2.4. Others
- 9.1. Market Analysis, Insights and Forecast - by Application
- 10. Asia Pacific Nutritional Analysis Analysis, Insights and Forecast, 2020-2032
- 10.1. Market Analysis, Insights and Forecast - by Application
- 10.1.1. Enterprise Users
- 10.1.2. Government Users
- 10.2. Market Analysis, Insights and Forecast - by Type
- 10.2.1. Macro Nutrients Analysis
- 10.2.2. Minerals Analysis
- 10.2.3. Vitamins Analysis
- 10.2.4. Others
- 10.1. Market Analysis, Insights and Forecast - by Application
- 11. Competitive Analysis
- 11.1. Global Market Share Analysis 2025
- 11.2. Company Profiles
- 11.2.1 SGS
- 11.2.1.1. Overview
- 11.2.1.2. Products
- 11.2.1.3. SWOT Analysis
- 11.2.1.4. Recent Developments
- 11.2.1.5. Financials (Based on Availability)
- 11.2.2 Intertek
- 11.2.2.1. Overview
- 11.2.2.2. Products
- 11.2.2.3. SWOT Analysis
- 11.2.2.4. Recent Developments
- 11.2.2.5. Financials (Based on Availability)
- 11.2.3 Eurofins
- 11.2.3.1. Overview
- 11.2.3.2. Products
- 11.2.3.3. SWOT Analysis
- 11.2.3.4. Recent Developments
- 11.2.3.5. Financials (Based on Availability)
- 11.2.4 Bureau Veritas
- 11.2.4.1. Overview
- 11.2.4.2. Products
- 11.2.4.3. SWOT Analysis
- 11.2.4.4. Recent Developments
- 11.2.4.5. Financials (Based on Availability)
- 11.2.5 ALS Life Sciences
- 11.2.5.1. Overview
- 11.2.5.2. Products
- 11.2.5.3. SWOT Analysis
- 11.2.5.4. Recent Developments
- 11.2.5.5. Financials (Based on Availability)
- 11.2.6 Merieux Nutrisciences
- 11.2.6.1. Overview
- 11.2.6.2. Products
- 11.2.6.3. SWOT Analysis
- 11.2.6.4. Recent Developments
- 11.2.6.5. Financials (Based on Availability)
- 11.2.7 TUV NORD
- 11.2.7.1. Overview
- 11.2.7.2. Products
- 11.2.7.3. SWOT Analysis
- 11.2.7.4. Recent Developments
- 11.2.7.5. Financials (Based on Availability)
- 11.2.8 Tentamus Analytics
- 11.2.8.1. Overview
- 11.2.8.2. Products
- 11.2.8.3. SWOT Analysis
- 11.2.8.4. Recent Developments
- 11.2.8.5. Financials (Based on Availability)
- 11.2.9 AsureQuality
- 11.2.9.1. Overview
- 11.2.9.2. Products
- 11.2.9.3. SWOT Analysis
- 11.2.9.4. Recent Developments
- 11.2.9.5. Financials (Based on Availability)
- 11.2.10 Japan Food Research Laboratories
- 11.2.10.1. Overview
- 11.2.10.2. Products
- 11.2.10.3. SWOT Analysis
- 11.2.10.4. Recent Developments
- 11.2.10.5. Financials (Based on Availability)
- 11.2.11 CCIC
- 11.2.11.1. Overview
- 11.2.11.2. Products
- 11.2.11.3. SWOT Analysis
- 11.2.11.4. Recent Developments
- 11.2.11.5. Financials (Based on Availability)
- 11.2.12 DTS Food Laboratories
- 11.2.12.1. Overview
- 11.2.12.2. Products
- 11.2.12.3. SWOT Analysis
- 11.2.12.4. Recent Developments
- 11.2.12.5. Financials (Based on Availability)
- 11.2.13 Premier Analytical Services
- 11.2.13.1. Overview
- 11.2.13.2. Products
- 11.2.13.3. SWOT Analysis
- 11.2.13.4. Recent Developments
- 11.2.13.5. Financials (Based on Availability)
- 11.2.14 Compu-Food Analysis
- 11.2.14.1. Overview
- 11.2.14.2. Products
- 11.2.14.3. SWOT Analysis
- 11.2.14.4. Recent Developments
- 11.2.14.5. Financials (Based on Availability)
- 11.2.15 Fitz Scientific
- 11.2.15.1. Overview
- 11.2.15.2. Products
- 11.2.15.3. SWOT Analysis
- 11.2.15.4. Recent Developments
- 11.2.15.5. Financials (Based on Availability)
- 11.2.16 AGQ Labs
- 11.2.16.1. Overview
- 11.2.16.2. Products
- 11.2.16.3. SWOT Analysis
- 11.2.16.4. Recent Developments
- 11.2.16.5. Financials (Based on Availability)
- 11.2.17 Shokukanken
- 11.2.17.1. Overview
- 11.2.17.2. Products
- 11.2.17.3. SWOT Analysis
- 11.2.17.4. Recent Developments
- 11.2.17.5. Financials (Based on Availability)
- 11.2.1 SGS
List of Figures
- Figure 1: Global Nutritional Analysis Revenue Breakdown (billion, %) by Region 2025 & 2033
- Figure 2: North America Nutritional Analysis Revenue (billion), by Application 2025 & 2033
- Figure 3: North America Nutritional Analysis Revenue Share (%), by Application 2025 & 2033
- Figure 4: North America Nutritional Analysis Revenue (billion), by Type 2025 & 2033
- Figure 5: North America Nutritional Analysis Revenue Share (%), by Type 2025 & 2033
- Figure 6: North America Nutritional Analysis Revenue (billion), by Country 2025 & 2033
- Figure 7: North America Nutritional Analysis Revenue Share (%), by Country 2025 & 2033
- Figure 8: South America Nutritional Analysis Revenue (billion), by Application 2025 & 2033
- Figure 9: South America Nutritional Analysis Revenue Share (%), by Application 2025 & 2033
- Figure 10: South America Nutritional Analysis Revenue (billion), by Type 2025 & 2033
- Figure 11: South America Nutritional Analysis Revenue Share (%), by Type 2025 & 2033
- Figure 12: South America Nutritional Analysis Revenue (billion), by Country 2025 & 2033
- Figure 13: South America Nutritional Analysis Revenue Share (%), by Country 2025 & 2033
- Figure 14: Europe Nutritional Analysis Revenue (billion), by Application 2025 & 2033
- Figure 15: Europe Nutritional Analysis Revenue Share (%), by Application 2025 & 2033
- Figure 16: Europe Nutritional Analysis Revenue (billion), by Type 2025 & 2033
- Figure 17: Europe Nutritional Analysis Revenue Share (%), by Type 2025 & 2033
- Figure 18: Europe Nutritional Analysis Revenue (billion), by Country 2025 & 2033
- Figure 19: Europe Nutritional Analysis Revenue Share (%), by Country 2025 & 2033
- Figure 20: Middle East & Africa Nutritional Analysis Revenue (billion), by Application 2025 & 2033
- Figure 21: Middle East & Africa Nutritional Analysis Revenue Share (%), by Application 2025 & 2033
- Figure 22: Middle East & Africa Nutritional Analysis Revenue (billion), by Type 2025 & 2033
- Figure 23: Middle East & Africa Nutritional Analysis Revenue Share (%), by Type 2025 & 2033
- Figure 24: Middle East & Africa Nutritional Analysis Revenue (billion), by Country 2025 & 2033
- Figure 25: Middle East & Africa Nutritional Analysis Revenue Share (%), by Country 2025 & 2033
- Figure 26: Asia Pacific Nutritional Analysis Revenue (billion), by Application 2025 & 2033
- Figure 27: Asia Pacific Nutritional Analysis Revenue Share (%), by Application 2025 & 2033
- Figure 28: Asia Pacific Nutritional Analysis Revenue (billion), by Type 2025 & 2033
- Figure 29: Asia Pacific Nutritional Analysis Revenue Share (%), by Type 2025 & 2033
- Figure 30: Asia Pacific Nutritional Analysis Revenue (billion), by Country 2025 & 2033
- Figure 31: Asia Pacific Nutritional Analysis Revenue Share (%), by Country 2025 & 2033
List of Tables
- Table 1: Global Nutritional Analysis Revenue billion Forecast, by Application 2020 & 2033
- Table 2: Global Nutritional Analysis Revenue billion Forecast, by Type 2020 & 2033
- Table 3: Global Nutritional Analysis Revenue billion Forecast, by Region 2020 & 2033
- Table 4: Global Nutritional Analysis Revenue billion Forecast, by Application 2020 & 2033
- Table 5: Global Nutritional Analysis Revenue billion Forecast, by Type 2020 & 2033
- Table 6: Global Nutritional Analysis Revenue billion Forecast, by Country 2020 & 2033
- Table 7: United States Nutritional Analysis Revenue (billion) Forecast, by Application 2020 & 2033
- Table 8: Canada Nutritional Analysis Revenue (billion) Forecast, by Application 2020 & 2033
- Table 9: Mexico Nutritional Analysis Revenue (billion) Forecast, by Application 2020 & 2033
- Table 10: Global Nutritional Analysis Revenue billion Forecast, by Application 2020 & 2033
- Table 11: Global Nutritional Analysis Revenue billion Forecast, by Type 2020 & 2033
- Table 12: Global Nutritional Analysis Revenue billion Forecast, by Country 2020 & 2033
- Table 13: Brazil Nutritional Analysis Revenue (billion) Forecast, by Application 2020 & 2033
- Table 14: Argentina Nutritional Analysis Revenue (billion) Forecast, by Application 2020 & 2033
- Table 15: Rest of South America Nutritional Analysis Revenue (billion) Forecast, by Application 2020 & 2033
- Table 16: Global Nutritional Analysis Revenue billion Forecast, by Application 2020 & 2033
- Table 17: Global Nutritional Analysis Revenue billion Forecast, by Type 2020 & 2033
- Table 18: Global Nutritional Analysis Revenue billion Forecast, by Country 2020 & 2033
- Table 19: United Kingdom Nutritional Analysis Revenue (billion) Forecast, by Application 2020 & 2033
- Table 20: Germany Nutritional Analysis Revenue (billion) Forecast, by Application 2020 & 2033
- Table 21: France Nutritional Analysis Revenue (billion) Forecast, by Application 2020 & 2033
- Table 22: Italy Nutritional Analysis Revenue (billion) Forecast, by Application 2020 & 2033
- Table 23: Spain Nutritional Analysis Revenue (billion) Forecast, by Application 2020 & 2033
- Table 24: Russia Nutritional Analysis Revenue (billion) Forecast, by Application 2020 & 2033
- Table 25: Benelux Nutritional Analysis Revenue (billion) Forecast, by Application 2020 & 2033
- Table 26: Nordics Nutritional Analysis Revenue (billion) Forecast, by Application 2020 & 2033
- Table 27: Rest of Europe Nutritional Analysis Revenue (billion) Forecast, by Application 2020 & 2033
- Table 28: Global Nutritional Analysis Revenue billion Forecast, by Application 2020 & 2033
- Table 29: Global Nutritional Analysis Revenue billion Forecast, by Type 2020 & 2033
- Table 30: Global Nutritional Analysis Revenue billion Forecast, by Country 2020 & 2033
- Table 31: Turkey Nutritional Analysis Revenue (billion) Forecast, by Application 2020 & 2033
- Table 32: Israel Nutritional Analysis Revenue (billion) Forecast, by Application 2020 & 2033
- Table 33: GCC Nutritional Analysis Revenue (billion) Forecast, by Application 2020 & 2033
- Table 34: North Africa Nutritional Analysis Revenue (billion) Forecast, by Application 2020 & 2033
- Table 35: South Africa Nutritional Analysis Revenue (billion) Forecast, by Application 2020 & 2033
- Table 36: Rest of Middle East & Africa Nutritional Analysis Revenue (billion) Forecast, by Application 2020 & 2033
- Table 37: Global Nutritional Analysis Revenue billion Forecast, by Application 2020 & 2033
- Table 38: Global Nutritional Analysis Revenue billion Forecast, by Type 2020 & 2033
- Table 39: Global Nutritional Analysis Revenue billion Forecast, by Country 2020 & 2033
- Table 40: China Nutritional Analysis Revenue (billion) Forecast, by Application 2020 & 2033
- Table 41: India Nutritional Analysis Revenue (billion) Forecast, by Application 2020 & 2033
- Table 42: Japan Nutritional Analysis Revenue (billion) Forecast, by Application 2020 & 2033
- Table 43: South Korea Nutritional Analysis Revenue (billion) Forecast, by Application 2020 & 2033
- Table 44: ASEAN Nutritional Analysis Revenue (billion) Forecast, by Application 2020 & 2033
- Table 45: Oceania Nutritional Analysis Revenue (billion) Forecast, by Application 2020 & 2033
- Table 46: Rest of Asia Pacific Nutritional Analysis Revenue (billion) Forecast, by Application 2020 & 2033
Frequently Asked Questions
1. What is the projected Compound Annual Growth Rate (CAGR) of the Nutritional Analysis?
The projected CAGR is approximately 11%.
2. Which companies are prominent players in the Nutritional Analysis?
Key companies in the market include SGS, Intertek, Eurofins, Bureau Veritas, ALS Life Sciences, Merieux Nutrisciences, TUV NORD, Tentamus Analytics, AsureQuality, Japan Food Research Laboratories, CCIC, DTS Food Laboratories, Premier Analytical Services, Compu-Food Analysis, Fitz Scientific, AGQ Labs, Shokukanken.
3. What are the main segments of the Nutritional Analysis?
The market segments include Application, Type.
4. Can you provide details about the market size?
The market size is estimated to be USD 6.2 billion as of 2022.
5. What are some drivers contributing to market growth?
N/A
6. What are the notable trends driving market growth?
N/A
7. Are there any restraints impacting market growth?
N/A
8. Can you provide examples of recent developments in the market?
N/A
9. What pricing options are available for accessing the report?
Pricing options include single-user, multi-user, and enterprise licenses priced at USD 3950.00, USD 5925.00, and USD 7900.00 respectively.
10. Is the market size provided in terms of value or volume?
The market size is provided in terms of value, measured in billion.
11. Are there any specific market keywords associated with the report?
Yes, the market keyword associated with the report is "Nutritional Analysis," which aids in identifying and referencing the specific market segment covered.
12. How do I determine which pricing option suits my needs best?
The pricing options vary based on user requirements and access needs. Individual users may opt for single-user licenses, while businesses requiring broader access may choose multi-user or enterprise licenses for cost-effective access to the report.
13. Are there any additional resources or data provided in the Nutritional Analysis report?
While the report offers comprehensive insights, it's advisable to review the specific contents or supplementary materials provided to ascertain if additional resources or data are available.
14. How can I stay updated on further developments or reports in the Nutritional Analysis?
To stay informed about further developments, trends, and reports in the Nutritional Analysis, consider subscribing to industry newsletters, following relevant companies and organizations, or regularly checking reputable industry news sources and publications.
Methodology
Step 1 - Identification of Relevant Samples Size from Population Database


Step 2 - Approaches for Defining Global Market Size (Value, Volume* & Price*)

Note*: In applicable scenarios
Step 3 - Data Sources
Primary Research
- Web Analytics
- Survey Reports
- Research Institute
- Latest Research Reports
- Opinion Leaders
Secondary Research
- Annual Reports
- White Paper
- Latest Press Release
- Industry Association
- Paid Database
- Investor Presentations

Step 4 - Data Triangulation
Involves using different sources of information in order to increase the validity of a study
These sources are likely to be stakeholders in a program - participants, other researchers, program staff, other community members, and so on.
Then we put all data in single framework & apply various statistical tools to find out the dynamic on the market.
During the analysis stage, feedback from the stakeholder groups would be compared to determine areas of agreement as well as areas of divergence