

Key Insights
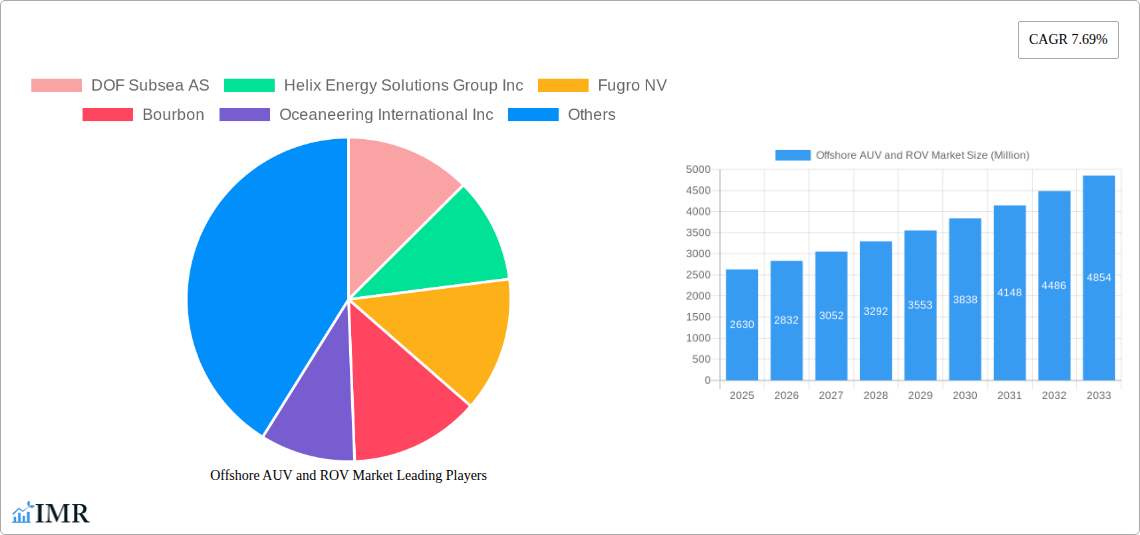
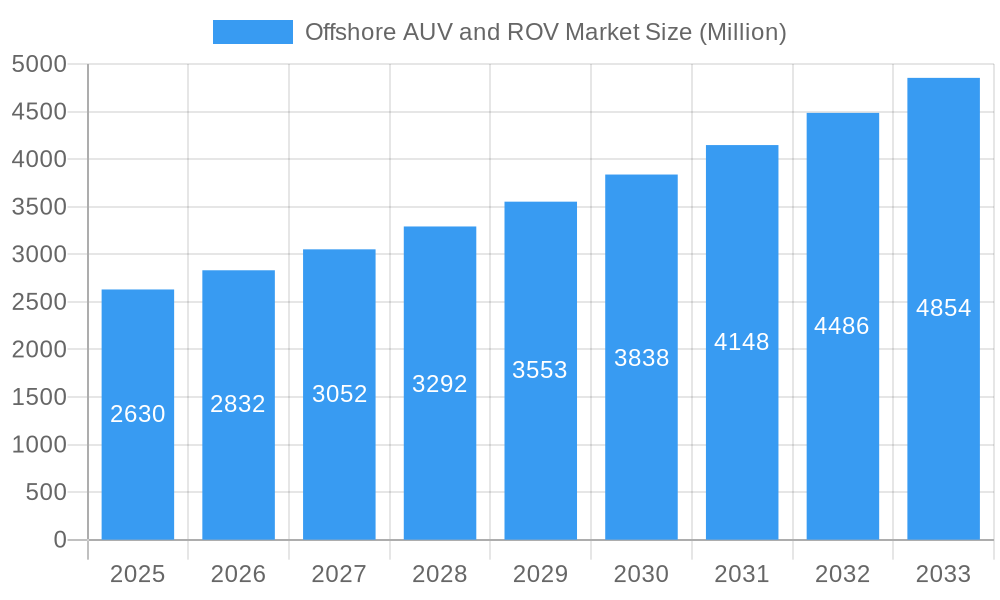
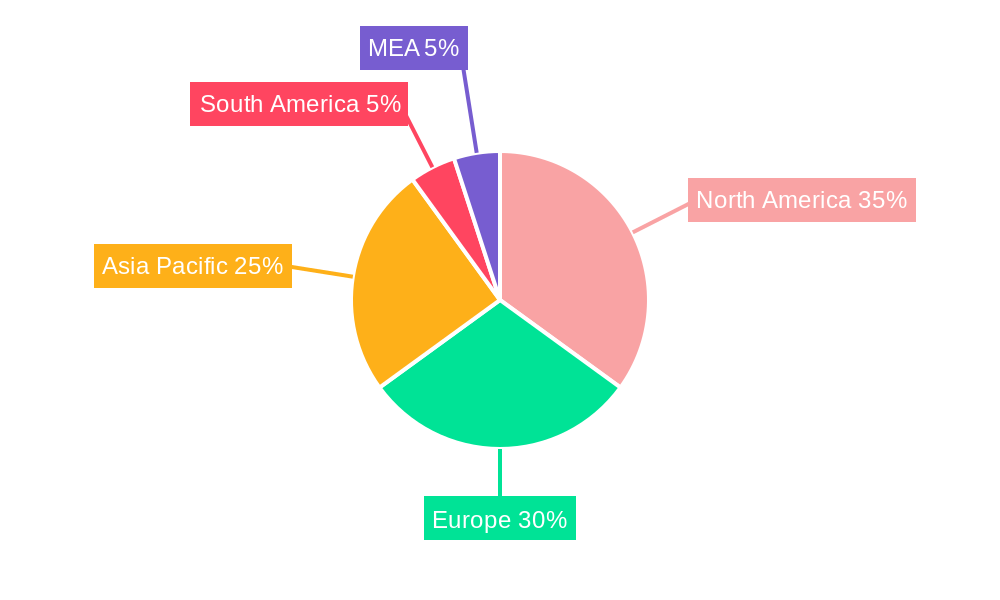
The offshore AUV and ROV market, valued at $2.63 billion in 2025, is projected to experience robust growth, driven by increasing demand for subsea operations in the oil and gas, defense, and research sectors. The market's Compound Annual Growth Rate (CAGR) of 7.69% from 2025 to 2033 signifies a substantial expansion, primarily fueled by advancements in autonomous navigation technology, improved sensor capabilities, and the growing need for efficient subsea infrastructure inspection, repair, and maintenance. The rising complexity of offshore energy projects and the need for enhanced safety measures further contribute to market growth. Work-class and heavy work-class vehicles, particularly those deployed in drilling and development activities, constitute significant segments within this market. Geographically, North America and Europe currently hold substantial market shares, but the Asia-Pacific region is expected to witness accelerated growth due to increasing offshore energy exploration and infrastructure development. While technological advancements are key drivers, factors such as high initial investment costs and regulatory hurdles could pose challenges to market expansion.
Offshore AUV and ROV Market Market Size (In Billion)
The segment analysis reveals that work-class and heavy work-class ROVs dominate the vehicle class segment, owing to their capability to handle complex and challenging subsea tasks. Within end-user applications, the oil and gas sector continues to be the largest consumer of AUVs and ROVs, followed by the defense and research sectors. The increasing adoption of AUVs for tasks like seabed mapping and pipeline inspection is expected to drive growth in this segment. Key players in the market, including DOF Subsea AS, Helix Energy Solutions Group Inc., and Oceaneering International Inc., are actively investing in research and development to enhance the capabilities of their offerings and meet evolving market demands. Competition is intense, with companies focusing on innovation and strategic partnerships to secure a larger market share. The forecast period of 2025-2033 presents significant opportunities for market expansion, driven by the continuous need for efficient and reliable subsea operations.
Offshore AUV and ROV Market Company Market Share
Offshore AUV and ROV Market: A Comprehensive Report (2019-2033)
This in-depth report provides a comprehensive analysis of the offshore AUV and ROV market, encompassing market dynamics, growth trends, regional segmentation, product landscape, key players, and future outlook. The study period covers 2019-2033, with 2025 as the base and estimated year. This report is essential for industry professionals, investors, and strategic decision-makers seeking a clear understanding of this rapidly evolving sector. The market is segmented by Vehicle Type (ROV, AUV), Vehicle Class (Work-class Vehicle, Heavy Work-class Vehicle, Observatory-class Vehicles), End-user Application (Oil and Gas, Defense, Research, Other End-user Applications), and Activity (Drilling and Development, Construction, Inspection, Repair, and Maintenance, Decommissioning, Other Activities).
Offshore AUV and ROV Market Dynamics & Structure
The offshore AUV and ROV market is characterized by a moderately concentrated structure with several major players and numerous smaller specialized companies. The market size in 2025 is estimated at xx Million units, projected to reach xx Million units by 2033. Key dynamics shaping the market include:
- Technological Innovation: Advancements in sensor technology, AI-powered autonomy, and improved underwater communication systems are driving increased adoption of AUVs and ROVs.
- Regulatory Framework: Stringent safety regulations and environmental concerns influence the design, operation, and maintenance of these vehicles.
- Competitive Landscape: Intense competition among established players and emerging technology providers is pushing innovation and driving down costs. Market share is currently distributed as follows: DOF Subsea AS (xx%), Helix Energy Solutions Group Inc (xx%), Fugro NV (xx%), etc. The remaining xx% is shared by other players.
- Mergers and Acquisitions (M&A): Consolidation through M&A activity is expected to reshape the market landscape, with xx major deals recorded in the historical period (2019-2024).
- Substitute Products: While there are no direct substitutes, alternative inspection methods pose some competitive pressure.
- End-user Demographics: The primary end-users are in the Oil & Gas, Defense, and Research sectors. Growth is heavily influenced by activity levels in the offshore energy sector.
Offshore AUV and ROV Market Growth Trends & Insights
The offshore AUV and ROV market has exhibited robust growth in recent years, driven by increasing demand from the oil and gas industry, the expanding defense sector, and growing research activities. The market's Compound Annual Growth Rate (CAGR) during the historical period (2019-2024) was xx%, exceeding the projected CAGR of xx% from 2025 to 2033. This slower projected growth reflects a cyclical nature tied to energy sector investments. Technological advancements, particularly in autonomy and data processing, are pushing adoption rates higher in various applications. Shifting consumer behavior, characterized by a preference for cost-effective and efficient solutions, will influence the demand for advanced functionalities. The market penetration rate currently stands at xx%, expected to reach xx% by 2033.
Dominant Regions, Countries, or Segments in Offshore AUV and ROV Market
The Oil and Gas sector remains the dominant end-user application, accounting for approximately xx% of the market in 2025. Geographically, North America and Europe are currently leading, together accounting for xx% of the market share. However, the Asia-Pacific region is projected to show the fastest growth due to increasing offshore energy exploration and infrastructure development.
- Key Drivers by Region:
- North America: Strong oil and gas activities, coupled with advancements in AUV/ROV technology.
- Europe: Significant investments in renewable energy projects, driving demand for subsea inspection and maintenance.
- Asia-Pacific: Rapid growth in offshore oil and gas exploration, especially in Southeast Asia.
- Dominant Segments:
- Vehicle Type: ROVs currently hold a larger market share than AUVs due to their operational versatility and established track record, but AUVs are showing higher growth.
- Vehicle Class: Work-class ROVs dominate due to their workhorse role in diverse applications.
- Activity: Inspection, Repair, and Maintenance (IRM) are significant drivers, representing xx% of the total market, driven by the aging offshore infrastructure.
Offshore AUV and ROV Market Product Landscape
The market offers a diverse range of AUVs and ROVs, varying in size, capabilities, and functionalities. Recent innovations focus on increased autonomy, enhanced sensor integration, improved maneuverability, and the incorporation of AI-driven decision-making capabilities. This translates into improved efficiency, reduced operational costs, and enhanced data acquisition. Key selling propositions include payload capacity, depth rating, endurance, and ease of operation.
Key Drivers, Barriers & Challenges in Offshore AUV and ROV Market
Key Drivers: The primary drivers are increasing demand for subsea operations in oil and gas, expansion in the defense and research sectors, the need for efficient subsea inspection, and ongoing technological advancements enabling greater autonomy and data acquisition.
Key Challenges: High initial investment costs, dependence on skilled personnel, and stringent regulatory frameworks pose significant barriers. Supply chain disruptions (e.g., component shortages) further impede market growth, affecting production and timelines. Competitive pressures from other inspection techniques also exert considerable pressure on pricing and profitability.
Emerging Opportunities in Offshore AUV and ROV Market
Untapped markets in developing economies, particularly in Asia-Pacific and Latin America, represent significant growth opportunities. Innovative applications in offshore renewable energy (wind, wave), aquaculture, and environmental monitoring are emerging. Further advancements in autonomy, AI integration, and swarm technology will unlock more efficient and cost-effective operations.
Growth Accelerators in the Offshore AUV and ROV Market Industry
Technological breakthroughs in underwater communication, robotics, and AI are major growth catalysts. Strategic partnerships between technology providers and end-users to tailor solutions and collaborative research efforts driving innovations are pivotal. The expansion of subsea infrastructure for various sectors will fuel considerable long-term market growth.
Key Players Shaping the Offshore AUV and ROV Market Market
- DOF Subsea AS
- Helix Energy Solutions Group Inc
- Fugro NV
- Bourbon
- Oceaneering International Inc
- Saipem SpA
- DeepOcean AS
- Subsea 7 SA
- Teledyne Technologies Incorporated
- TechnipFMC PLC
Notable Milestones in Offshore AUV and ROV Market Sector
- Jan 2024: DeepTech secures a three-year contract with BP Plc for ROV services in Egypt, highlighting the growing demand for reliable subsea support.
- Oct 2022: Oceaneering secures contracts totaling USD 300 million for ROV and AUV services, showcasing the market's strength and potential for future growth.
- May 2022: Gujarat Police's adoption of ROVs for underwater investigations demonstrates the technology's expanding applications beyond the energy sector.
In-Depth Offshore AUV and ROV Market Market Outlook
The long-term outlook for the offshore AUV and ROV market remains positive, driven by technological advancements, expanding applications, and increasing demand from diverse sectors. Strategic partnerships and investments in R&D will further accelerate growth, making it an attractive sector for both established players and new entrants. The increasing focus on sustainable operations and environmental compliance will also shape future market trends, prompting the development of more eco-friendly AUV/ROV technologies.
Offshore AUV and ROV Market Segmentation
-
1. Vehicle Type
- 1.1. ROV
- 1.2. AUV
-
2. Vehicle Class
-
2.1. Work-class Vehicle
- 2.1.1. Light Work-class Vehicle
- 2.1.2. Medium Work-class Vehicle
- 2.1.3. Heavy Work-class Vehicle
- 2.2. Observatory-class Vehicles
-
2.1. Work-class Vehicle
-
3. End-user Application
- 3.1. Oil and Gas
- 3.2. Defense
- 3.3. Research
- 3.4. Other End-user Applications
-
4. Activity
- 4.1. Drilling and Development
- 4.2. Construction
- 4.3. Inspection, Repair, and Maintenance
- 4.4. Decommissioning
- 4.5. Other Activities
Offshore AUV and ROV Market Segmentation By Geography
-
1. North America
- 1.1. United States
- 1.2. Canada
- 1.3. Mexico
-
2. Europe
- 2.1. Germany
- 2.2. United Kingdom
- 2.3. Denmark
- 2.4. Norway
- 2.5. Russia
- 2.6. France
- 2.7. Rest of Europe
-
3. Asia Pacific
- 3.1. China
- 3.2. India
- 3.3. ASEAN Countries
- 3.4. Rest of Asia Pacific
-
4. South America
- 4.1. Brazil
- 4.2. Venezuela
- 4.3. Argentina
- 4.4. Colombia
- 4.5. Rest of South America
-
5. Middle East and Africa
- 5.1. Saudi Arabia
- 5.2. United Arab Emirates
- 5.3. Qatar
- 5.4. Nigeria
- 5.5. Rest of Middle East and Africa
Offshore AUV and ROV Market Regional Market Share
Geographic Coverage of Offshore AUV and ROV Market
Offshore AUV and ROV Market REPORT HIGHLIGHTS
| Aspects | Details |
|---|---|
| Study Period | 2020-2034 |
| Base Year | 2025 |
| Estimated Year | 2026 |
| Forecast Period | 2026-2034 |
| Historical Period | 2020-2025 |
| Growth Rate | CAGR of 7.69% from 2020-2034 |
| Segmentation |
|
Table of Contents
- 1. Introduction
- 1.1. Research Scope
- 1.2. Market Segmentation
- 1.3. Research Objective
- 1.4. Definitions and Assumptions
- 2. Executive Summary
- 2.1. Market Snapshot
- 3. Market Dynamics
- 3.1. Market Drivers
- 3.2. Market Restrains
- 3.3. Market Trends
- 3.4. Market Opportunities
- 4. Market Factor Analysis
- 4.1. Porters Five Forces
- 4.1.1. Bargaining Power of Suppliers
- 4.1.2. Bargaining Power of Buyers
- 4.1.3. Threat of New Entrants
- 4.1.4. Threat of Substitutes
- 4.1.5. Competitive Rivalry
- 4.2. PESTEL analysis
- 4.3. BCG Analysis
- 4.3.1. Stars (High Growth, High Market Share)
- 4.3.2. Cash Cows (Low Growth, High Market Share)
- 4.3.3. Question Mark (High Growth, Low Market Share)
- 4.3.4. Dogs (Low Growth, Low Market Share)
- 4.4. Ansoff Matrix Analysis
- 4.5. Supply Chain Analysis
- 4.6. Regulatory Landscape
- 4.7. Current Market Potential and Opportunity Assessment (TAM–SAM–SOM Framework)
- 4.8. IMR Analyst Note
- 4.1. Porters Five Forces
- 5. Market Analysis, Insights and Forecast 2021-2033
- 5.1. Market Analysis, Insights and Forecast - by Vehicle Type
- 5.1.1. ROV
- 5.1.2. AUV
- 5.2. Market Analysis, Insights and Forecast - by Vehicle Class
- 5.2.1. Work-class Vehicle
- 5.2.1.1. Light Work-class Vehicle
- 5.2.1.2. Medium Work-class Vehicle
- 5.2.1.3. Heavy Work-class Vehicle
- 5.2.2. Observatory-class Vehicles
- 5.2.1. Work-class Vehicle
- 5.3. Market Analysis, Insights and Forecast - by End-user Application
- 5.3.1. Oil and Gas
- 5.3.2. Defense
- 5.3.3. Research
- 5.3.4. Other End-user Applications
- 5.4. Market Analysis, Insights and Forecast - by Activity
- 5.4.1. Drilling and Development
- 5.4.2. Construction
- 5.4.3. Inspection, Repair, and Maintenance
- 5.4.4. Decommissioning
- 5.4.5. Other Activities
- 5.5. Market Analysis, Insights and Forecast - by Region
- 5.5.1. North America
- 5.5.2. Europe
- 5.5.3. Asia Pacific
- 5.5.4. South America
- 5.5.5. Middle East and Africa
- 5.1. Market Analysis, Insights and Forecast - by Vehicle Type
- 6. Global Offshore AUV and ROV Market Analysis, Insights and Forecast, 2021-2033
- 6.1. Market Analysis, Insights and Forecast - by Vehicle Type
- 6.1.1. ROV
- 6.1.2. AUV
- 6.2. Market Analysis, Insights and Forecast - by Vehicle Class
- 6.2.1. Work-class Vehicle
- 6.2.1.1. Light Work-class Vehicle
- 6.2.1.2. Medium Work-class Vehicle
- 6.2.1.3. Heavy Work-class Vehicle
- 6.2.2. Observatory-class Vehicles
- 6.2.1. Work-class Vehicle
- 6.3. Market Analysis, Insights and Forecast - by End-user Application
- 6.3.1. Oil and Gas
- 6.3.2. Defense
- 6.3.3. Research
- 6.3.4. Other End-user Applications
- 6.4. Market Analysis, Insights and Forecast - by Activity
- 6.4.1. Drilling and Development
- 6.4.2. Construction
- 6.4.3. Inspection, Repair, and Maintenance
- 6.4.4. Decommissioning
- 6.4.5. Other Activities
- 6.1. Market Analysis, Insights and Forecast - by Vehicle Type
- 7. North America Offshore AUV and ROV Market Analysis, Insights and Forecast, 2020-2032
- 7.1. Market Analysis, Insights and Forecast - by Vehicle Type
- 7.1.1. ROV
- 7.1.2. AUV
- 7.2. Market Analysis, Insights and Forecast - by Vehicle Class
- 7.2.1. Work-class Vehicle
- 7.2.1.1. Light Work-class Vehicle
- 7.2.1.2. Medium Work-class Vehicle
- 7.2.1.3. Heavy Work-class Vehicle
- 7.2.2. Observatory-class Vehicles
- 7.2.1. Work-class Vehicle
- 7.3. Market Analysis, Insights and Forecast - by End-user Application
- 7.3.1. Oil and Gas
- 7.3.2. Defense
- 7.3.3. Research
- 7.3.4. Other End-user Applications
- 7.4. Market Analysis, Insights and Forecast - by Activity
- 7.4.1. Drilling and Development
- 7.4.2. Construction
- 7.4.3. Inspection, Repair, and Maintenance
- 7.4.4. Decommissioning
- 7.4.5. Other Activities
- 7.1. Market Analysis, Insights and Forecast - by Vehicle Type
- 8. Europe Offshore AUV and ROV Market Analysis, Insights and Forecast, 2020-2032
- 8.1. Market Analysis, Insights and Forecast - by Vehicle Type
- 8.1.1. ROV
- 8.1.2. AUV
- 8.2. Market Analysis, Insights and Forecast - by Vehicle Class
- 8.2.1. Work-class Vehicle
- 8.2.1.1. Light Work-class Vehicle
- 8.2.1.2. Medium Work-class Vehicle
- 8.2.1.3. Heavy Work-class Vehicle
- 8.2.2. Observatory-class Vehicles
- 8.2.1. Work-class Vehicle
- 8.3. Market Analysis, Insights and Forecast - by End-user Application
- 8.3.1. Oil and Gas
- 8.3.2. Defense
- 8.3.3. Research
- 8.3.4. Other End-user Applications
- 8.4. Market Analysis, Insights and Forecast - by Activity
- 8.4.1. Drilling and Development
- 8.4.2. Construction
- 8.4.3. Inspection, Repair, and Maintenance
- 8.4.4. Decommissioning
- 8.4.5. Other Activities
- 8.1. Market Analysis, Insights and Forecast - by Vehicle Type
- 9. Asia Pacific Offshore AUV and ROV Market Analysis, Insights and Forecast, 2020-2032
- 9.1. Market Analysis, Insights and Forecast - by Vehicle Type
- 9.1.1. ROV
- 9.1.2. AUV
- 9.2. Market Analysis, Insights and Forecast - by Vehicle Class
- 9.2.1. Work-class Vehicle
- 9.2.1.1. Light Work-class Vehicle
- 9.2.1.2. Medium Work-class Vehicle
- 9.2.1.3. Heavy Work-class Vehicle
- 9.2.2. Observatory-class Vehicles
- 9.2.1. Work-class Vehicle
- 9.3. Market Analysis, Insights and Forecast - by End-user Application
- 9.3.1. Oil and Gas
- 9.3.2. Defense
- 9.3.3. Research
- 9.3.4. Other End-user Applications
- 9.4. Market Analysis, Insights and Forecast - by Activity
- 9.4.1. Drilling and Development
- 9.4.2. Construction
- 9.4.3. Inspection, Repair, and Maintenance
- 9.4.4. Decommissioning
- 9.4.5. Other Activities
- 9.1. Market Analysis, Insights and Forecast - by Vehicle Type
- 10. South America Offshore AUV and ROV Market Analysis, Insights and Forecast, 2020-2032
- 10.1. Market Analysis, Insights and Forecast - by Vehicle Type
- 10.1.1. ROV
- 10.1.2. AUV
- 10.2. Market Analysis, Insights and Forecast - by Vehicle Class
- 10.2.1. Work-class Vehicle
- 10.2.1.1. Light Work-class Vehicle
- 10.2.1.2. Medium Work-class Vehicle
- 10.2.1.3. Heavy Work-class Vehicle
- 10.2.2. Observatory-class Vehicles
- 10.2.1. Work-class Vehicle
- 10.3. Market Analysis, Insights and Forecast - by End-user Application
- 10.3.1. Oil and Gas
- 10.3.2. Defense
- 10.3.3. Research
- 10.3.4. Other End-user Applications
- 10.4. Market Analysis, Insights and Forecast - by Activity
- 10.4.1. Drilling and Development
- 10.4.2. Construction
- 10.4.3. Inspection, Repair, and Maintenance
- 10.4.4. Decommissioning
- 10.4.5. Other Activities
- 10.1. Market Analysis, Insights and Forecast - by Vehicle Type
- 11. Middle East and Africa Offshore AUV and ROV Market Analysis, Insights and Forecast, 2020-2032
- 11.1. Market Analysis, Insights and Forecast - by Vehicle Type
- 11.1.1. ROV
- 11.1.2. AUV
- 11.2. Market Analysis, Insights and Forecast - by Vehicle Class
- 11.2.1. Work-class Vehicle
- 11.2.1.1. Light Work-class Vehicle
- 11.2.1.2. Medium Work-class Vehicle
- 11.2.1.3. Heavy Work-class Vehicle
- 11.2.2. Observatory-class Vehicles
- 11.2.1. Work-class Vehicle
- 11.3. Market Analysis, Insights and Forecast - by End-user Application
- 11.3.1. Oil and Gas
- 11.3.2. Defense
- 11.3.3. Research
- 11.3.4. Other End-user Applications
- 11.4. Market Analysis, Insights and Forecast - by Activity
- 11.4.1. Drilling and Development
- 11.4.2. Construction
- 11.4.3. Inspection, Repair, and Maintenance
- 11.4.4. Decommissioning
- 11.4.5. Other Activities
- 11.1. Market Analysis, Insights and Forecast - by Vehicle Type
- 12. Competitive Analysis
- 12.1. Company Profiles
- 12.1.1 DOF Subsea AS
- 12.1.1.1. Company Overview
- 12.1.1.2. Products
- 12.1.1.3. Company Financials
- 12.1.1.4. SWOT Analysis
- 12.1.2 Helix Energy Solutions Group Inc
- 12.1.2.1. Company Overview
- 12.1.2.2. Products
- 12.1.2.3. Company Financials
- 12.1.2.4. SWOT Analysis
- 12.1.3 Fugro NV
- 12.1.3.1. Company Overview
- 12.1.3.2. Products
- 12.1.3.3. Company Financials
- 12.1.3.4. SWOT Analysis
- 12.1.4 Bourbon
- 12.1.4.1. Company Overview
- 12.1.4.2. Products
- 12.1.4.3. Company Financials
- 12.1.4.4. SWOT Analysis
- 12.1.5 Oceaneering International Inc
- 12.1.5.1. Company Overview
- 12.1.5.2. Products
- 12.1.5.3. Company Financials
- 12.1.5.4. SWOT Analysis
- 12.1.6 Saipem SpA
- 12.1.6.1. Company Overview
- 12.1.6.2. Products
- 12.1.6.3. Company Financials
- 12.1.6.4. SWOT Analysis
- 12.1.7 DeepOcean AS
- 12.1.7.1. Company Overview
- 12.1.7.2. Products
- 12.1.7.3. Company Financials
- 12.1.7.4. SWOT Analysis
- 12.1.8 Subsea 7 SA
- 12.1.8.1. Company Overview
- 12.1.8.2. Products
- 12.1.8.3. Company Financials
- 12.1.8.4. SWOT Analysis
- 12.1.9 Teledyne Technologies Incorporated*List Not Exhaustive
- 12.1.9.1. Company Overview
- 12.1.9.2. Products
- 12.1.9.3. Company Financials
- 12.1.9.4. SWOT Analysis
- 12.1.10 TechnipFMC PLC
- 12.1.10.1. Company Overview
- 12.1.10.2. Products
- 12.1.10.3. Company Financials
- 12.1.10.4. SWOT Analysis
- 12.1.1 DOF Subsea AS
- 12.2. Market Entropy
- 12.2.1 Company's Key Areas Served
- 12.2.2 Recent Developments
- 12.3. Company Market Share Analysis 2025
- 12.3.1 Top 5 Companies Market Share Analysis
- 12.3.2 Top 3 Companies Market Share Analysis
- 12.4. List of Potential Customers
- 13. Research Methodology
List of Figures
- Figure 1: Global Offshore AUV and ROV Market Revenue Breakdown (Million, %) by Region 2025 & 2033
- Figure 2: Global Offshore AUV and ROV Market Volume Breakdown (K Unit, %) by Region 2025 & 2033
- Figure 3: North America Offshore AUV and ROV Market Revenue (Million), by Vehicle Type 2025 & 2033
- Figure 4: North America Offshore AUV and ROV Market Volume (K Unit), by Vehicle Type 2025 & 2033
- Figure 5: North America Offshore AUV and ROV Market Revenue Share (%), by Vehicle Type 2025 & 2033
- Figure 6: North America Offshore AUV and ROV Market Volume Share (%), by Vehicle Type 2025 & 2033
- Figure 7: North America Offshore AUV and ROV Market Revenue (Million), by Vehicle Class 2025 & 2033
- Figure 8: North America Offshore AUV and ROV Market Volume (K Unit), by Vehicle Class 2025 & 2033
- Figure 9: North America Offshore AUV and ROV Market Revenue Share (%), by Vehicle Class 2025 & 2033
- Figure 10: North America Offshore AUV and ROV Market Volume Share (%), by Vehicle Class 2025 & 2033
- Figure 11: North America Offshore AUV and ROV Market Revenue (Million), by End-user Application 2025 & 2033
- Figure 12: North America Offshore AUV and ROV Market Volume (K Unit), by End-user Application 2025 & 2033
- Figure 13: North America Offshore AUV and ROV Market Revenue Share (%), by End-user Application 2025 & 2033
- Figure 14: North America Offshore AUV and ROV Market Volume Share (%), by End-user Application 2025 & 2033
- Figure 15: North America Offshore AUV and ROV Market Revenue (Million), by Activity 2025 & 2033
- Figure 16: North America Offshore AUV and ROV Market Volume (K Unit), by Activity 2025 & 2033
- Figure 17: North America Offshore AUV and ROV Market Revenue Share (%), by Activity 2025 & 2033
- Figure 18: North America Offshore AUV and ROV Market Volume Share (%), by Activity 2025 & 2033
- Figure 19: North America Offshore AUV and ROV Market Revenue (Million), by Country 2025 & 2033
- Figure 20: North America Offshore AUV and ROV Market Volume (K Unit), by Country 2025 & 2033
- Figure 21: North America Offshore AUV and ROV Market Revenue Share (%), by Country 2025 & 2033
- Figure 22: North America Offshore AUV and ROV Market Volume Share (%), by Country 2025 & 2033
- Figure 23: Europe Offshore AUV and ROV Market Revenue (Million), by Vehicle Type 2025 & 2033
- Figure 24: Europe Offshore AUV and ROV Market Volume (K Unit), by Vehicle Type 2025 & 2033
- Figure 25: Europe Offshore AUV and ROV Market Revenue Share (%), by Vehicle Type 2025 & 2033
- Figure 26: Europe Offshore AUV and ROV Market Volume Share (%), by Vehicle Type 2025 & 2033
- Figure 27: Europe Offshore AUV and ROV Market Revenue (Million), by Vehicle Class 2025 & 2033
- Figure 28: Europe Offshore AUV and ROV Market Volume (K Unit), by Vehicle Class 2025 & 2033
- Figure 29: Europe Offshore AUV and ROV Market Revenue Share (%), by Vehicle Class 2025 & 2033
- Figure 30: Europe Offshore AUV and ROV Market Volume Share (%), by Vehicle Class 2025 & 2033
- Figure 31: Europe Offshore AUV and ROV Market Revenue (Million), by End-user Application 2025 & 2033
- Figure 32: Europe Offshore AUV and ROV Market Volume (K Unit), by End-user Application 2025 & 2033
- Figure 33: Europe Offshore AUV and ROV Market Revenue Share (%), by End-user Application 2025 & 2033
- Figure 34: Europe Offshore AUV and ROV Market Volume Share (%), by End-user Application 2025 & 2033
- Figure 35: Europe Offshore AUV and ROV Market Revenue (Million), by Activity 2025 & 2033
- Figure 36: Europe Offshore AUV and ROV Market Volume (K Unit), by Activity 2025 & 2033
- Figure 37: Europe Offshore AUV and ROV Market Revenue Share (%), by Activity 2025 & 2033
- Figure 38: Europe Offshore AUV and ROV Market Volume Share (%), by Activity 2025 & 2033
- Figure 39: Europe Offshore AUV and ROV Market Revenue (Million), by Country 2025 & 2033
- Figure 40: Europe Offshore AUV and ROV Market Volume (K Unit), by Country 2025 & 2033
- Figure 41: Europe Offshore AUV and ROV Market Revenue Share (%), by Country 2025 & 2033
- Figure 42: Europe Offshore AUV and ROV Market Volume Share (%), by Country 2025 & 2033
- Figure 43: Asia Pacific Offshore AUV and ROV Market Revenue (Million), by Vehicle Type 2025 & 2033
- Figure 44: Asia Pacific Offshore AUV and ROV Market Volume (K Unit), by Vehicle Type 2025 & 2033
- Figure 45: Asia Pacific Offshore AUV and ROV Market Revenue Share (%), by Vehicle Type 2025 & 2033
- Figure 46: Asia Pacific Offshore AUV and ROV Market Volume Share (%), by Vehicle Type 2025 & 2033
- Figure 47: Asia Pacific Offshore AUV and ROV Market Revenue (Million), by Vehicle Class 2025 & 2033
- Figure 48: Asia Pacific Offshore AUV and ROV Market Volume (K Unit), by Vehicle Class 2025 & 2033
- Figure 49: Asia Pacific Offshore AUV and ROV Market Revenue Share (%), by Vehicle Class 2025 & 2033
- Figure 50: Asia Pacific Offshore AUV and ROV Market Volume Share (%), by Vehicle Class 2025 & 2033
- Figure 51: Asia Pacific Offshore AUV and ROV Market Revenue (Million), by End-user Application 2025 & 2033
- Figure 52: Asia Pacific Offshore AUV and ROV Market Volume (K Unit), by End-user Application 2025 & 2033
- Figure 53: Asia Pacific Offshore AUV and ROV Market Revenue Share (%), by End-user Application 2025 & 2033
- Figure 54: Asia Pacific Offshore AUV and ROV Market Volume Share (%), by End-user Application 2025 & 2033
- Figure 55: Asia Pacific Offshore AUV and ROV Market Revenue (Million), by Activity 2025 & 2033
- Figure 56: Asia Pacific Offshore AUV and ROV Market Volume (K Unit), by Activity 2025 & 2033
- Figure 57: Asia Pacific Offshore AUV and ROV Market Revenue Share (%), by Activity 2025 & 2033
- Figure 58: Asia Pacific Offshore AUV and ROV Market Volume Share (%), by Activity 2025 & 2033
- Figure 59: Asia Pacific Offshore AUV and ROV Market Revenue (Million), by Country 2025 & 2033
- Figure 60: Asia Pacific Offshore AUV and ROV Market Volume (K Unit), by Country 2025 & 2033
- Figure 61: Asia Pacific Offshore AUV and ROV Market Revenue Share (%), by Country 2025 & 2033
- Figure 62: Asia Pacific Offshore AUV and ROV Market Volume Share (%), by Country 2025 & 2033
- Figure 63: South America Offshore AUV and ROV Market Revenue (Million), by Vehicle Type 2025 & 2033
- Figure 64: South America Offshore AUV and ROV Market Volume (K Unit), by Vehicle Type 2025 & 2033
- Figure 65: South America Offshore AUV and ROV Market Revenue Share (%), by Vehicle Type 2025 & 2033
- Figure 66: South America Offshore AUV and ROV Market Volume Share (%), by Vehicle Type 2025 & 2033
- Figure 67: South America Offshore AUV and ROV Market Revenue (Million), by Vehicle Class 2025 & 2033
- Figure 68: South America Offshore AUV and ROV Market Volume (K Unit), by Vehicle Class 2025 & 2033
- Figure 69: South America Offshore AUV and ROV Market Revenue Share (%), by Vehicle Class 2025 & 2033
- Figure 70: South America Offshore AUV and ROV Market Volume Share (%), by Vehicle Class 2025 & 2033
- Figure 71: South America Offshore AUV and ROV Market Revenue (Million), by End-user Application 2025 & 2033
- Figure 72: South America Offshore AUV and ROV Market Volume (K Unit), by End-user Application 2025 & 2033
- Figure 73: South America Offshore AUV and ROV Market Revenue Share (%), by End-user Application 2025 & 2033
- Figure 74: South America Offshore AUV and ROV Market Volume Share (%), by End-user Application 2025 & 2033
- Figure 75: South America Offshore AUV and ROV Market Revenue (Million), by Activity 2025 & 2033
- Figure 76: South America Offshore AUV and ROV Market Volume (K Unit), by Activity 2025 & 2033
- Figure 77: South America Offshore AUV and ROV Market Revenue Share (%), by Activity 2025 & 2033
- Figure 78: South America Offshore AUV and ROV Market Volume Share (%), by Activity 2025 & 2033
- Figure 79: South America Offshore AUV and ROV Market Revenue (Million), by Country 2025 & 2033
- Figure 80: South America Offshore AUV and ROV Market Volume (K Unit), by Country 2025 & 2033
- Figure 81: South America Offshore AUV and ROV Market Revenue Share (%), by Country 2025 & 2033
- Figure 82: South America Offshore AUV and ROV Market Volume Share (%), by Country 2025 & 2033
- Figure 83: Middle East and Africa Offshore AUV and ROV Market Revenue (Million), by Vehicle Type 2025 & 2033
- Figure 84: Middle East and Africa Offshore AUV and ROV Market Volume (K Unit), by Vehicle Type 2025 & 2033
- Figure 85: Middle East and Africa Offshore AUV and ROV Market Revenue Share (%), by Vehicle Type 2025 & 2033
- Figure 86: Middle East and Africa Offshore AUV and ROV Market Volume Share (%), by Vehicle Type 2025 & 2033
- Figure 87: Middle East and Africa Offshore AUV and ROV Market Revenue (Million), by Vehicle Class 2025 & 2033
- Figure 88: Middle East and Africa Offshore AUV and ROV Market Volume (K Unit), by Vehicle Class 2025 & 2033
- Figure 89: Middle East and Africa Offshore AUV and ROV Market Revenue Share (%), by Vehicle Class 2025 & 2033
- Figure 90: Middle East and Africa Offshore AUV and ROV Market Volume Share (%), by Vehicle Class 2025 & 2033
- Figure 91: Middle East and Africa Offshore AUV and ROV Market Revenue (Million), by End-user Application 2025 & 2033
- Figure 92: Middle East and Africa Offshore AUV and ROV Market Volume (K Unit), by End-user Application 2025 & 2033
- Figure 93: Middle East and Africa Offshore AUV and ROV Market Revenue Share (%), by End-user Application 2025 & 2033
- Figure 94: Middle East and Africa Offshore AUV and ROV Market Volume Share (%), by End-user Application 2025 & 2033
- Figure 95: Middle East and Africa Offshore AUV and ROV Market Revenue (Million), by Activity 2025 & 2033
- Figure 96: Middle East and Africa Offshore AUV and ROV Market Volume (K Unit), by Activity 2025 & 2033
- Figure 97: Middle East and Africa Offshore AUV and ROV Market Revenue Share (%), by Activity 2025 & 2033
- Figure 98: Middle East and Africa Offshore AUV and ROV Market Volume Share (%), by Activity 2025 & 2033
- Figure 99: Middle East and Africa Offshore AUV and ROV Market Revenue (Million), by Country 2025 & 2033
- Figure 100: Middle East and Africa Offshore AUV and ROV Market Volume (K Unit), by Country 2025 & 2033
- Figure 101: Middle East and Africa Offshore AUV and ROV Market Revenue Share (%), by Country 2025 & 2033
- Figure 102: Middle East and Africa Offshore AUV and ROV Market Volume Share (%), by Country 2025 & 2033
List of Tables
- Table 1: Global Offshore AUV and ROV Market Revenue Million Forecast, by Vehicle Type 2020 & 2033
- Table 2: Global Offshore AUV and ROV Market Volume K Unit Forecast, by Vehicle Type 2020 & 2033
- Table 3: Global Offshore AUV and ROV Market Revenue Million Forecast, by Vehicle Class 2020 & 2033
- Table 4: Global Offshore AUV and ROV Market Volume K Unit Forecast, by Vehicle Class 2020 & 2033
- Table 5: Global Offshore AUV and ROV Market Revenue Million Forecast, by End-user Application 2020 & 2033
- Table 6: Global Offshore AUV and ROV Market Volume K Unit Forecast, by End-user Application 2020 & 2033
- Table 7: Global Offshore AUV and ROV Market Revenue Million Forecast, by Activity 2020 & 2033
- Table 8: Global Offshore AUV and ROV Market Volume K Unit Forecast, by Activity 2020 & 2033
- Table 9: Global Offshore AUV and ROV Market Revenue Million Forecast, by Region 2020 & 2033
- Table 10: Global Offshore AUV and ROV Market Volume K Unit Forecast, by Region 2020 & 2033
- Table 11: Global Offshore AUV and ROV Market Revenue Million Forecast, by Vehicle Type 2020 & 2033
- Table 12: Global Offshore AUV and ROV Market Volume K Unit Forecast, by Vehicle Type 2020 & 2033
- Table 13: Global Offshore AUV and ROV Market Revenue Million Forecast, by Vehicle Class 2020 & 2033
- Table 14: Global Offshore AUV and ROV Market Volume K Unit Forecast, by Vehicle Class 2020 & 2033
- Table 15: Global Offshore AUV and ROV Market Revenue Million Forecast, by End-user Application 2020 & 2033
- Table 16: Global Offshore AUV and ROV Market Volume K Unit Forecast, by End-user Application 2020 & 2033
- Table 17: Global Offshore AUV and ROV Market Revenue Million Forecast, by Activity 2020 & 2033
- Table 18: Global Offshore AUV and ROV Market Volume K Unit Forecast, by Activity 2020 & 2033
- Table 19: Global Offshore AUV and ROV Market Revenue Million Forecast, by Country 2020 & 2033
- Table 20: Global Offshore AUV and ROV Market Volume K Unit Forecast, by Country 2020 & 2033
- Table 21: United States Offshore AUV and ROV Market Revenue (Million) Forecast, by Application 2020 & 2033
- Table 22: United States Offshore AUV and ROV Market Volume (K Unit) Forecast, by Application 2020 & 2033
- Table 23: Canada Offshore AUV and ROV Market Revenue (Million) Forecast, by Application 2020 & 2033
- Table 24: Canada Offshore AUV and ROV Market Volume (K Unit) Forecast, by Application 2020 & 2033
- Table 25: Mexico Offshore AUV and ROV Market Revenue (Million) Forecast, by Application 2020 & 2033
- Table 26: Mexico Offshore AUV and ROV Market Volume (K Unit) Forecast, by Application 2020 & 2033
- Table 27: Global Offshore AUV and ROV Market Revenue Million Forecast, by Vehicle Type 2020 & 2033
- Table 28: Global Offshore AUV and ROV Market Volume K Unit Forecast, by Vehicle Type 2020 & 2033
- Table 29: Global Offshore AUV and ROV Market Revenue Million Forecast, by Vehicle Class 2020 & 2033
- Table 30: Global Offshore AUV and ROV Market Volume K Unit Forecast, by Vehicle Class 2020 & 2033
- Table 31: Global Offshore AUV and ROV Market Revenue Million Forecast, by End-user Application 2020 & 2033
- Table 32: Global Offshore AUV and ROV Market Volume K Unit Forecast, by End-user Application 2020 & 2033
- Table 33: Global Offshore AUV and ROV Market Revenue Million Forecast, by Activity 2020 & 2033
- Table 34: Global Offshore AUV and ROV Market Volume K Unit Forecast, by Activity 2020 & 2033
- Table 35: Global Offshore AUV and ROV Market Revenue Million Forecast, by Country 2020 & 2033
- Table 36: Global Offshore AUV and ROV Market Volume K Unit Forecast, by Country 2020 & 2033
- Table 37: Germany Offshore AUV and ROV Market Revenue (Million) Forecast, by Application 2020 & 2033
- Table 38: Germany Offshore AUV and ROV Market Volume (K Unit) Forecast, by Application 2020 & 2033
- Table 39: United Kingdom Offshore AUV and ROV Market Revenue (Million) Forecast, by Application 2020 & 2033
- Table 40: United Kingdom Offshore AUV and ROV Market Volume (K Unit) Forecast, by Application 2020 & 2033
- Table 41: Denmark Offshore AUV and ROV Market Revenue (Million) Forecast, by Application 2020 & 2033
- Table 42: Denmark Offshore AUV and ROV Market Volume (K Unit) Forecast, by Application 2020 & 2033
- Table 43: Norway Offshore AUV and ROV Market Revenue (Million) Forecast, by Application 2020 & 2033
- Table 44: Norway Offshore AUV and ROV Market Volume (K Unit) Forecast, by Application 2020 & 2033
- Table 45: Russia Offshore AUV and ROV Market Revenue (Million) Forecast, by Application 2020 & 2033
- Table 46: Russia Offshore AUV and ROV Market Volume (K Unit) Forecast, by Application 2020 & 2033
- Table 47: France Offshore AUV and ROV Market Revenue (Million) Forecast, by Application 2020 & 2033
- Table 48: France Offshore AUV and ROV Market Volume (K Unit) Forecast, by Application 2020 & 2033
- Table 49: Rest of Europe Offshore AUV and ROV Market Revenue (Million) Forecast, by Application 2020 & 2033
- Table 50: Rest of Europe Offshore AUV and ROV Market Volume (K Unit) Forecast, by Application 2020 & 2033
- Table 51: Global Offshore AUV and ROV Market Revenue Million Forecast, by Vehicle Type 2020 & 2033
- Table 52: Global Offshore AUV and ROV Market Volume K Unit Forecast, by Vehicle Type 2020 & 2033
- Table 53: Global Offshore AUV and ROV Market Revenue Million Forecast, by Vehicle Class 2020 & 2033
- Table 54: Global Offshore AUV and ROV Market Volume K Unit Forecast, by Vehicle Class 2020 & 2033
- Table 55: Global Offshore AUV and ROV Market Revenue Million Forecast, by End-user Application 2020 & 2033
- Table 56: Global Offshore AUV and ROV Market Volume K Unit Forecast, by End-user Application 2020 & 2033
- Table 57: Global Offshore AUV and ROV Market Revenue Million Forecast, by Activity 2020 & 2033
- Table 58: Global Offshore AUV and ROV Market Volume K Unit Forecast, by Activity 2020 & 2033
- Table 59: Global Offshore AUV and ROV Market Revenue Million Forecast, by Country 2020 & 2033
- Table 60: Global Offshore AUV and ROV Market Volume K Unit Forecast, by Country 2020 & 2033
- Table 61: China Offshore AUV and ROV Market Revenue (Million) Forecast, by Application 2020 & 2033
- Table 62: China Offshore AUV and ROV Market Volume (K Unit) Forecast, by Application 2020 & 2033
- Table 63: India Offshore AUV and ROV Market Revenue (Million) Forecast, by Application 2020 & 2033
- Table 64: India Offshore AUV and ROV Market Volume (K Unit) Forecast, by Application 2020 & 2033
- Table 65: ASEAN Countries Offshore AUV and ROV Market Revenue (Million) Forecast, by Application 2020 & 2033
- Table 66: ASEAN Countries Offshore AUV and ROV Market Volume (K Unit) Forecast, by Application 2020 & 2033
- Table 67: Rest of Asia Pacific Offshore AUV and ROV Market Revenue (Million) Forecast, by Application 2020 & 2033
- Table 68: Rest of Asia Pacific Offshore AUV and ROV Market Volume (K Unit) Forecast, by Application 2020 & 2033
- Table 69: Global Offshore AUV and ROV Market Revenue Million Forecast, by Vehicle Type 2020 & 2033
- Table 70: Global Offshore AUV and ROV Market Volume K Unit Forecast, by Vehicle Type 2020 & 2033
- Table 71: Global Offshore AUV and ROV Market Revenue Million Forecast, by Vehicle Class 2020 & 2033
- Table 72: Global Offshore AUV and ROV Market Volume K Unit Forecast, by Vehicle Class 2020 & 2033
- Table 73: Global Offshore AUV and ROV Market Revenue Million Forecast, by End-user Application 2020 & 2033
- Table 74: Global Offshore AUV and ROV Market Volume K Unit Forecast, by End-user Application 2020 & 2033
- Table 75: Global Offshore AUV and ROV Market Revenue Million Forecast, by Activity 2020 & 2033
- Table 76: Global Offshore AUV and ROV Market Volume K Unit Forecast, by Activity 2020 & 2033
- Table 77: Global Offshore AUV and ROV Market Revenue Million Forecast, by Country 2020 & 2033
- Table 78: Global Offshore AUV and ROV Market Volume K Unit Forecast, by Country 2020 & 2033
- Table 79: Brazil Offshore AUV and ROV Market Revenue (Million) Forecast, by Application 2020 & 2033
- Table 80: Brazil Offshore AUV and ROV Market Volume (K Unit) Forecast, by Application 2020 & 2033
- Table 81: Venezuela Offshore AUV and ROV Market Revenue (Million) Forecast, by Application 2020 & 2033
- Table 82: Venezuela Offshore AUV and ROV Market Volume (K Unit) Forecast, by Application 2020 & 2033
- Table 83: Argentina Offshore AUV and ROV Market Revenue (Million) Forecast, by Application 2020 & 2033
- Table 84: Argentina Offshore AUV and ROV Market Volume (K Unit) Forecast, by Application 2020 & 2033
- Table 85: Colombia Offshore AUV and ROV Market Revenue (Million) Forecast, by Application 2020 & 2033
- Table 86: Colombia Offshore AUV and ROV Market Volume (K Unit) Forecast, by Application 2020 & 2033
- Table 87: Rest of South America Offshore AUV and ROV Market Revenue (Million) Forecast, by Application 2020 & 2033
- Table 88: Rest of South America Offshore AUV and ROV Market Volume (K Unit) Forecast, by Application 2020 & 2033
- Table 89: Global Offshore AUV and ROV Market Revenue Million Forecast, by Vehicle Type 2020 & 2033
- Table 90: Global Offshore AUV and ROV Market Volume K Unit Forecast, by Vehicle Type 2020 & 2033
- Table 91: Global Offshore AUV and ROV Market Revenue Million Forecast, by Vehicle Class 2020 & 2033
- Table 92: Global Offshore AUV and ROV Market Volume K Unit Forecast, by Vehicle Class 2020 & 2033
- Table 93: Global Offshore AUV and ROV Market Revenue Million Forecast, by End-user Application 2020 & 2033
- Table 94: Global Offshore AUV and ROV Market Volume K Unit Forecast, by End-user Application 2020 & 2033
- Table 95: Global Offshore AUV and ROV Market Revenue Million Forecast, by Activity 2020 & 2033
- Table 96: Global Offshore AUV and ROV Market Volume K Unit Forecast, by Activity 2020 & 2033
- Table 97: Global Offshore AUV and ROV Market Revenue Million Forecast, by Country 2020 & 2033
- Table 98: Global Offshore AUV and ROV Market Volume K Unit Forecast, by Country 2020 & 2033
- Table 99: Saudi Arabia Offshore AUV and ROV Market Revenue (Million) Forecast, by Application 2020 & 2033
- Table 100: Saudi Arabia Offshore AUV and ROV Market Volume (K Unit) Forecast, by Application 2020 & 2033
- Table 101: United Arab Emirates Offshore AUV and ROV Market Revenue (Million) Forecast, by Application 2020 & 2033
- Table 102: United Arab Emirates Offshore AUV and ROV Market Volume (K Unit) Forecast, by Application 2020 & 2033
- Table 103: Qatar Offshore AUV and ROV Market Revenue (Million) Forecast, by Application 2020 & 2033
- Table 104: Qatar Offshore AUV and ROV Market Volume (K Unit) Forecast, by Application 2020 & 2033
- Table 105: Nigeria Offshore AUV and ROV Market Revenue (Million) Forecast, by Application 2020 & 2033
- Table 106: Nigeria Offshore AUV and ROV Market Volume (K Unit) Forecast, by Application 2020 & 2033
- Table 107: Rest of Middle East and Africa Offshore AUV and ROV Market Revenue (Million) Forecast, by Application 2020 & 2033
- Table 108: Rest of Middle East and Africa Offshore AUV and ROV Market Volume (K Unit) Forecast, by Application 2020 & 2033
Frequently Asked Questions
1. What is the projected Compound Annual Growth Rate (CAGR) of the Offshore AUV and ROV Market?
The projected CAGR is approximately 7.69%.
2. Which companies are prominent players in the Offshore AUV and ROV Market?
Key companies in the market include DOF Subsea AS, Helix Energy Solutions Group Inc, Fugro NV, Bourbon, Oceaneering International Inc, Saipem SpA, DeepOcean AS, Subsea 7 SA, Teledyne Technologies Incorporated*List Not Exhaustive, TechnipFMC PLC.
3. What are the main segments of the Offshore AUV and ROV Market?
The market segments include Vehicle Type, Vehicle Class, End-user Application, Activity.
4. Can you provide details about the market size?
The market size is estimated to be USD 2.63 Million as of 2022.
5. What are some drivers contributing to market growth?
4.; Increasing Offshore Oil and Gas Exploration Activities in the American. Asia-Pacific. and Middle-East and African Regions4.; Growing Offshore Renewable Technologies.
6. What are the notable trends driving market growth?
Oil and Gas Segment to Dominate the Market.
7. Are there any restraints impacting market growth?
4.; Ban on Offshore Exploration and Production Activities in Multiple Regions.
8. Can you provide examples of recent developments in the market?
Jan 2024: DeepTech won a three-year contract to provide rig support ROV services for BP Plc on the West Nile Delta development offshore Egypt. As part of the contract, two work class ROVs are provided to support the drilling, completion, and subsea activities directly on this long-term contract, which includes an option for further extension.
9. What pricing options are available for accessing the report?
Pricing options include single-user, multi-user, and enterprise licenses priced at USD 4750, USD 5250, and USD 8750 respectively.
10. Is the market size provided in terms of value or volume?
The market size is provided in terms of value, measured in Million and volume, measured in K Unit.
11. Are there any specific market keywords associated with the report?
Yes, the market keyword associated with the report is "Offshore AUV and ROV Market," which aids in identifying and referencing the specific market segment covered.
12. How do I determine which pricing option suits my needs best?
The pricing options vary based on user requirements and access needs. Individual users may opt for single-user licenses, while businesses requiring broader access may choose multi-user or enterprise licenses for cost-effective access to the report.
13. Are there any additional resources or data provided in the Offshore AUV and ROV Market report?
While the report offers comprehensive insights, it's advisable to review the specific contents or supplementary materials provided to ascertain if additional resources or data are available.
14. How can I stay updated on further developments or reports in the Offshore AUV and ROV Market?
To stay informed about further developments, trends, and reports in the Offshore AUV and ROV Market, consider subscribing to industry newsletters, following relevant companies and organizations, or regularly checking reputable industry news sources and publications.
Methodology
Step 1 - Identification of Relevant Samples Size from Population Database


Step 2 - Approaches for Defining Global Market Size (Value, Volume* & Price*)

Note*: In applicable scenarios
Step 3 - Data Sources
Primary Research
- Web Analytics
- Survey Reports
- Research Institute
- Latest Research Reports
- Opinion Leaders
Secondary Research
- Annual Reports
- White Paper
- Latest Press Release
- Industry Association
- Paid Database
- Investor Presentations

Step 4 - Data Triangulation
Involves using different sources of information in order to increase the validity of a study
These sources are likely to be stakeholders in a program - participants, other researchers, program staff, other community members, and so on.
Then we put all data in single framework & apply various statistical tools to find out the dynamic on the market.
During the analysis stage, feedback from the stakeholder groups would be compared to determine areas of agreement as well as areas of divergence