

Key Insights
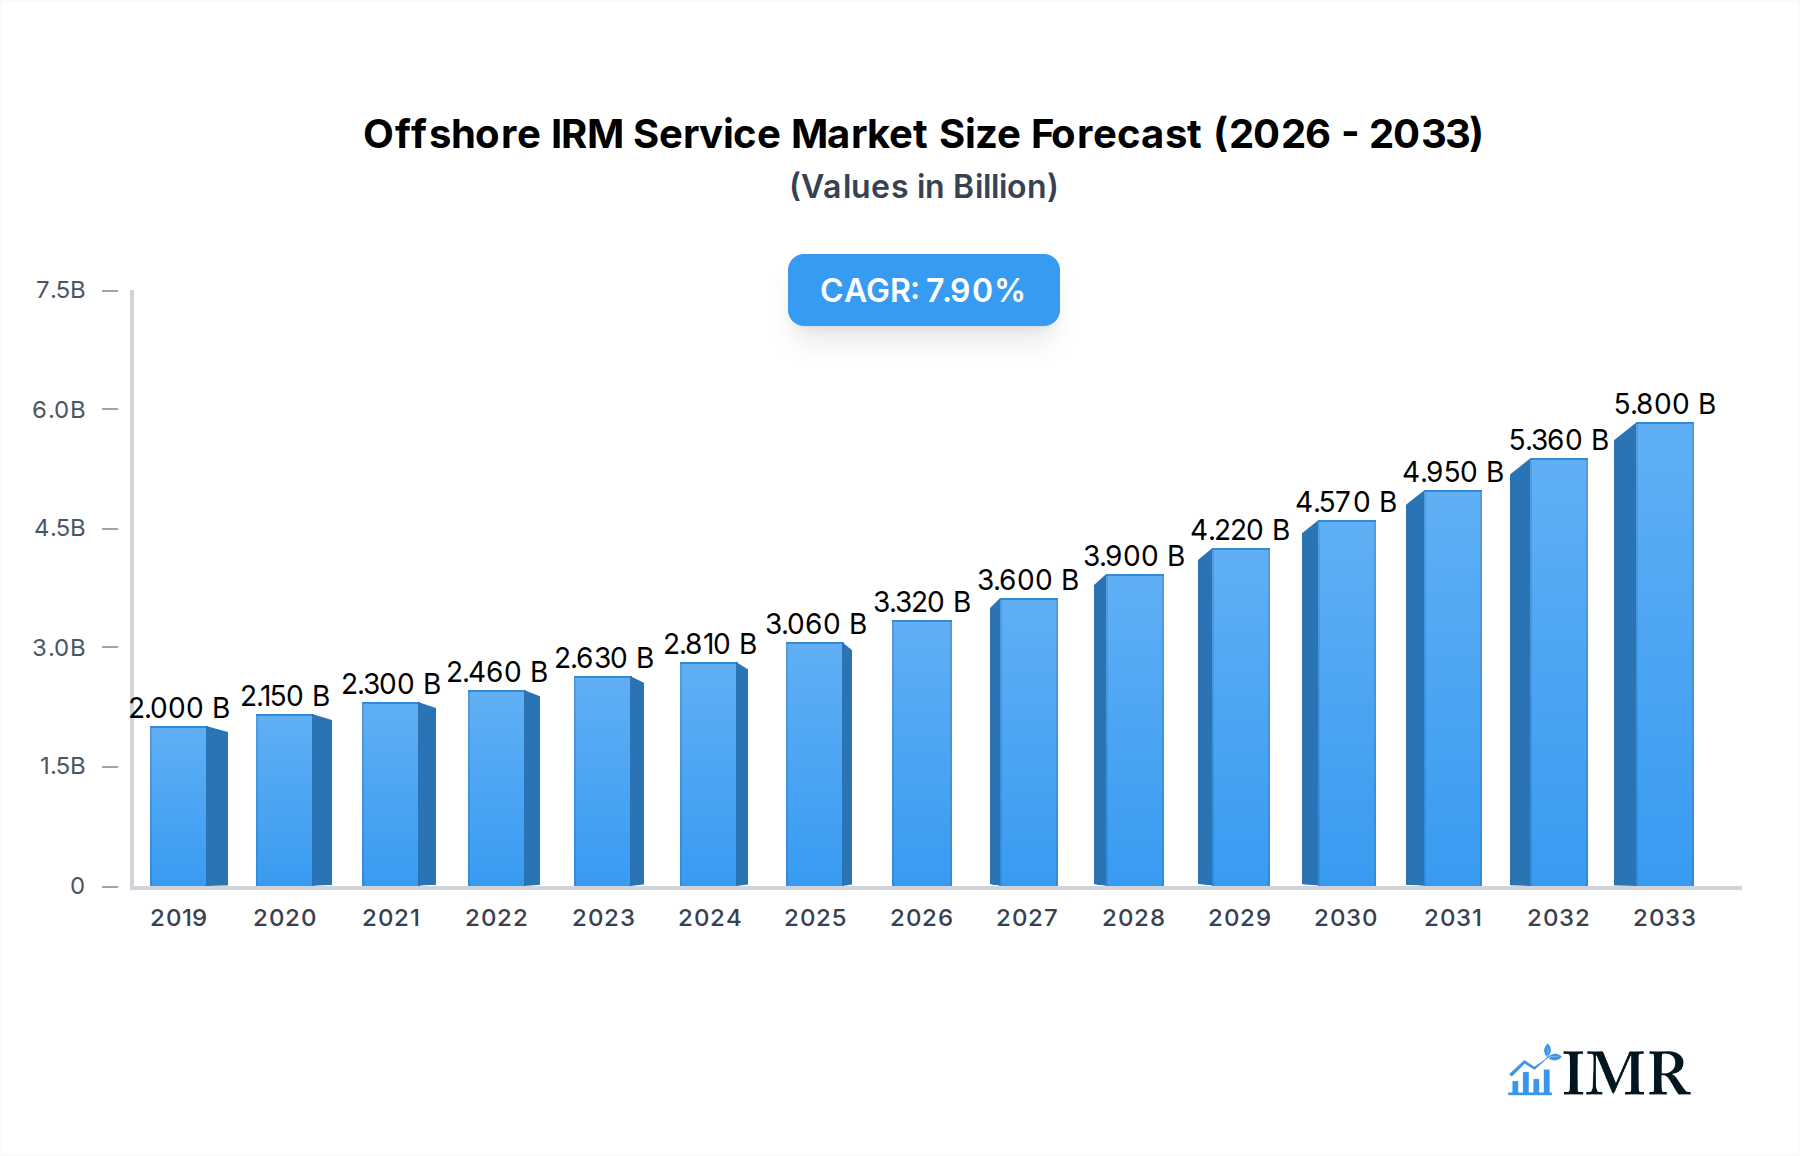
The global Offshore Inspection, Maintenance, and Repair (IRM) service market is poised for significant expansion, projected to reach $3060 million by 2025, with a robust Compound Annual Growth Rate (CAGR) of 7.6% anticipated through 2033. This dynamic growth is fueled by the increasing demand for maintaining the integrity and operational efficiency of critical offshore infrastructure, particularly in the oil and gas and burgeoning wind farm sectors. The industry is witnessing a pronounced shift towards advanced technologies and integrated service offerings. Key drivers include the aging of existing offshore assets, necessitating comprehensive inspection and repair programs, coupled with the continuous development of new offshore energy projects, especially in renewable energy sources like offshore wind. Enhanced safety regulations and environmental compliance mandates further propel the adoption of sophisticated IRM solutions. The market is characterized by a growing emphasis on proactive and predictive maintenance strategies, leveraging digital tools and robotics to minimize downtime and optimize operational costs.

Offshore IRM Service Market Size (In Billion)
The competitive landscape features a blend of established players and innovative service providers, each vying for market share through technological advancements, strategic partnerships, and expanded service portfolios. Segments such as inspection and maintenance are expected to dominate due to the recurring nature of these activities. While the Oil & Gas sector remains a cornerstone, the rapid expansion of Wind Farms presents a substantial growth avenue, requiring specialized IRM services for turbines and associated subsea infrastructure. Geographically, North America and Europe are expected to lead market demand, driven by extensive offshore oil and gas operations and a strong commitment to renewable energy targets. Asia Pacific, with its growing investments in offshore energy, is also a key region to watch for significant market penetration. The market is not without its restraints, including high initial investment costs for advanced technologies and the challenging environmental conditions of offshore operations, which can impact project timelines and budgets.
Offshore IRM Service Company Market Share
Offshore IRM Service Market Report: Unlocking Growth and Innovation in Maritime Asset Management
This comprehensive Offshore IRM (Inspection, Maintenance, and Repair) Service Market report delves deep into the evolving landscape of offshore asset integrity management. Analyze critical market dynamics, growth trajectories, regional dominance, technological advancements, and the strategic moves of key industry players. This report provides unparalleled insights for stakeholders in the Oil & Gas, Wind Farms, and broader maritime sectors, offering a detailed outlook from 2019 to 2033.
Offshore IRM Service Market Dynamics & Structure
The offshore IRM service market exhibits a dynamic and evolving structure, characterized by increasing market concentration as larger players consolidate their offerings and technological innovation drives new service paradigms. Technological innovation is a primary driver, with advancements in drone technology (ABJ Drones), advanced sensor systems (Teledyne FLIR), and predictive analytics significantly improving inspection efficiency and accuracy. Regulatory frameworks, particularly concerning environmental protection and safety standards in the Oil & Gas and Wind Farms sectors, are becoming increasingly stringent, compelling operators to invest in robust IRM services. Competitive product substitutes, such as in-house maintenance teams and alternative inspection methods, exist but are often outpaced by the specialized expertise and advanced technologies offered by dedicated IRM providers. End-user demographics are shifting, with a growing demand for integrated, data-driven IRM solutions across both established and emerging offshore energy industries. Mergers and acquisitions (M&A) are a notable trend, with companies like Baker Hughes and Technip FMC actively seeking to expand their service portfolios and geographical reach through strategic acquisitions. For instance, the past few years have seen an estimated $500 million in M&A deal volumes within the broader offshore services sector, indicating consolidation and strategic alignment.
- Market Concentration: Moderate to high, with a trend towards consolidation and strategic partnerships.
- Technological Innovation Drivers: AI-powered inspections, robotic solutions, advanced NDT (Non-Destructive Testing), and digital twin technology.
- Regulatory Frameworks: Stringent environmental, safety, and structural integrity regulations in Oil & Gas and Wind Farms.
- Competitive Product Substitutes: In-house maintenance, traditional manual inspections, and less advanced non-destructive testing methods.
- End-User Demographics: Oil & Gas operators, offshore wind farm developers, subsea infrastructure owners, and maritime industries.
- M&A Trends: Strategic acquisitions to enhance service offerings, expand market share, and integrate new technologies.
Offshore IRM Service Growth Trends & Insights
The Offshore IRM Service market is poised for substantial growth, driven by the increasing age of existing offshore infrastructure, the expansion of renewable energy sources, and a heightened focus on asset longevity and operational efficiency. The global market size for Offshore IRM services is projected to grow from an estimated $15,000 million in the base year of 2025 to $25,000 million by 2033, exhibiting a Compound Annual Growth Rate (CAGR) of approximately 5.5% during the forecast period. Adoption rates of advanced inspection techniques are on the rise, particularly in the Oil & Gas sector where aging platforms require more sophisticated monitoring and maintenance strategies. Technological disruptions, such as the integration of Artificial Intelligence (AI) for predictive maintenance and the use of Remotely Operated Vehicles (ROVs) and Autonomous Underwater Vehicles (AUVs) for underwater inspections, are transforming the service delivery model. Consumer behavior shifts are evident, with asset owners increasingly prioritizing integrated service providers that offer end-to-end solutions from inspection to repair, coupled with data analytics for informed decision-making. Market penetration of specialized IRM services is expected to deepen, especially in emerging offshore wind markets where rapid development necessitates robust asset integrity management from the outset. The parent market for Offshore IRM Services, encompassing all offshore asset integrity management solutions, is estimated at $50,000 million in 2025, with IRM services representing a significant and growing segment within it. The child market, focusing specifically on drone-based inspections within IRM, is projected to reach $1,500 million by 2033, highlighting a niche but rapidly expanding area.
Dominant Regions, Countries, or Segments in Offshore IRM Service
The Oil & Gas segment, particularly within established offshore production regions, currently dominates the global Offshore IRM Service market. This dominance is driven by the vast existing infrastructure of aging oil and gas platforms, subsea pipelines, and floating production storage and offloading (FPSO) units that require continuous and rigorous inspection, maintenance, and repair to ensure operational safety and environmental compliance. Countries with significant offshore oil and gas reserves, such as Norway, the United States (Gulf of Mexico), the United Kingdom (North Sea), and Brazil, are leading the demand for these specialized services. The market share for the Oil & Gas segment is estimated to be around 65% of the total Offshore IRM Service market in 2025. Economic policies in these regions often favor the continued exploration and production of hydrocarbons, albeit with increasing emphasis on sustainable practices, which necessitates robust IRM. Furthermore, the maturity of these offshore fields means that proactive maintenance and intervention services are critical for maximizing recovery and extending asset life. The growth potential in the Oil & Gas segment, while substantial, is tempered by the global energy transition.
Conversely, the Wind Farms application segment is experiencing the most rapid growth. As global efforts to decarbonize intensify, investments in offshore wind power are surging worldwide. Countries like Germany, Denmark, the Netherlands, China, and the United States are aggressively expanding their offshore wind capacities. The market share for Wind Farms is projected to grow from approximately 25% in 2025 to over 35% by 2033. Key drivers for this segment's dominance include the construction of new, larger, and more complex wind farms, requiring specialized installation, commissioning, and ongoing IRM services. Government incentives, supportive regulatory frameworks for renewable energy, and the decreasing cost of offshore wind technology are fueling this expansion. The lifespan of wind turbine components, particularly in harsh marine environments, necessitates regular inspections, maintenance, and timely repairs to prevent costly downtime and ensure maximum energy generation. The "Others" application, encompassing subsea cables, offshore construction vessels, and other maritime infrastructure, represents the remaining market share, with steady but less explosive growth.
Within the Types of Offshore IRM Services, Inspection currently holds the largest market share, estimated at 45% in 2025, due to its foundational role in asset integrity management. However, Maintenance and Repair segments are projected to witness significant growth as older assets age and new infrastructure is commissioned. The Maintenance segment is expected to capture around 30% of the market by 2033, while Repair is predicted to grow to 20%. The "Others" type, which could include services like decommissioning support and specialized diving operations, will comprise the remaining market share.
- Dominant Application Segment: Oil & Gas (65% market share in 2025), with significant growth in Wind Farms (projected 35% by 2033).
- Leading Countries (Oil & Gas): Norway, USA (Gulf of Mexico), UK (North Sea), Brazil.
- Leading Countries (Wind Farms): Germany, Denmark, Netherlands, China, USA.
- Dominant Service Type: Inspection (45% market share in 2025), with strong growth in Maintenance and Repair.
- Key Drivers for Dominance: Aging infrastructure, energy transition, government incentives, technological advancements, and safety regulations.
Offshore IRM Service Product Landscape
The Offshore IRM Service product landscape is defined by increasingly sophisticated and integrated technological solutions. Innovations are heavily focused on enhancing efficiency, safety, and data acquisition capabilities. Companies are developing advanced robotic systems, including AI-enabled drones (e.g., ABJ Drones) for visual inspections and ultrasonic testing, and sophisticated ROVs equipped with cutting-edge sonar and camera systems for subsea asset integrity assessments. Predictive maintenance software, powered by machine learning algorithms, is a key differentiator, enabling asset owners to anticipate potential failures and schedule maintenance proactively, minimizing unplanned downtime. Furthermore, novel NDT techniques, such as phased array ultrasonic testing and eddy current testing, offer greater accuracy and speed in detecting flaws in critical components. The performance metrics emphasize reduced inspection times, improved data accuracy, enhanced safety by minimizing human exposure to hazardous environments, and ultimately, extended asset lifecycles.
Key Drivers, Barriers & Challenges in Offshore IRM Service
Key Drivers:
- Aging Offshore Infrastructure: A substantial portion of existing oil and gas platforms and subsea infrastructure requires ongoing inspection and maintenance to ensure continued safe operation.
- Growth of Renewable Energy: The rapid expansion of offshore wind farms necessitates comprehensive IRM services for new installations and ongoing asset integrity.
- Technological Advancements: Innovations in robotics, AI, and NDT are enhancing the efficiency, accuracy, and safety of IRM services.
- Stringent Regulatory Frameworks: Increasing emphasis on safety and environmental compliance drives demand for robust IRM solutions.
- Focus on Operational Efficiency: Asset owners are seeking to minimize downtime and optimize performance, making proactive IRM crucial.
Barriers & Challenges:
- High Capital Investment: Implementing advanced IRM technologies and maintaining specialized fleets requires significant upfront investment.
- Harsh Operating Environments: Offshore conditions present extreme weather and sea states, making access and operations challenging and costly.
- Skilled Workforce Shortage: A scarcity of experienced personnel in specialized IRM disciplines can hinder service delivery.
- Supply Chain Disruptions: Geopolitical events and logistical complexities can impact the availability of parts and specialized equipment.
- Cybersecurity Risks: Increased reliance on digital platforms for data management and remote operations exposes IRM services to cybersecurity threats.
- Cost Pressures: Asset owners are constantly seeking cost-effective solutions, putting pressure on IRM service providers to optimize pricing.
Emerging Opportunities in Offshore IRM Service
Emerging opportunities lie in the integration of digital twin technology for comprehensive asset monitoring and simulation, allowing for predictive maintenance and optimized operational strategies. The increasing demand for decommissioning services for aging offshore structures presents a significant opportunity for IRM providers to leverage their expertise in asset assessment and planning. Furthermore, the expansion of offshore carbon capture and storage (CCS) facilities will require specialized IRM solutions for their unique infrastructure. Untapped markets in developing offshore energy sectors, particularly in Asia and South America, offer considerable growth potential. Evolving consumer preferences are driving demand for sustainable and environmentally responsible IRM practices, creating a niche for eco-friendly solutions.
Growth Accelerators in the Offshore IRM Service Industry
The Offshore IRM Service industry's long-term growth is being accelerated by several key catalysts. Technological breakthroughs, such as the miniaturization of sensors and the development of more autonomous inspection platforms, are continuously expanding the scope and efficiency of services. Strategic partnerships between technology providers, IRM companies, and asset owners are fostering innovation and creating integrated service offerings. For instance, collaborations between drone manufacturers like ABJ Drones and data analytics firms are creating powerful new inspection solutions. Market expansion strategies, including entering new geographical regions and diversifying service portfolios to cater to emerging offshore industries like hydrogen production facilities, are also significant growth drivers. The increasing adoption of digitalization and Industry 4.0 principles across the maritime sector is further pushing the demand for advanced IRM services that can leverage real-time data for decision-making.
Key Players Shaping the Offshore IRM Service Market
- ABJ Drones
- MISTRAS Group, Inc.
- Technip FMC
- Sinovoltaics Group
- Rever Offshore
- Bluestream
- Baker Hughes
- Teledyne FLIR
- Petrofac
- Starke Marine
- James Fisher Marine Services
Notable Milestones in Offshore IRM Service Sector
- 2020: Increased adoption of AI-powered predictive maintenance algorithms in the Oil & Gas sector, leading to an estimated 15% reduction in unplanned downtime for early adopters.
- 2021: Significant investment in drone-based inspection technologies, with companies like ABJ Drones expanding their service offerings for wind turbines and offshore platforms.
- 2022: Mergers and acquisitions activity increased, with larger integrated service providers acquiring specialized NDT and inspection companies to broaden their capabilities.
- 2023: Growth in demand for subsea inspection services utilizing advanced ROVs and AUVs, driven by the need to monitor aging subsea pipelines and infrastructure.
- 2024: Increased focus on digital transformation within the IRM sector, with a greater emphasis on cloud-based data management and remote inspection capabilities.
- 2025 (Estimated): Projected launch of next-generation autonomous inspection robots capable of performing complex repairs in challenging offshore environments.
In-Depth Offshore IRM Service Market Outlook
The future outlook for the Offshore IRM Service market is exceptionally promising, driven by an unrelenting demand for operational integrity across a diversifying range of offshore assets. Growth accelerators will continue to be fueled by technological innovation, with the integration of AI, machine learning, and advanced robotics becoming standard. Strategic partnerships will foster synergistic growth, creating end-to-end solutions that address the evolving needs of asset owners. Market expansion into new geographical territories and into nascent offshore sectors such as floating solar and offshore hydrogen production will unlock significant new revenue streams. The transition towards sustainable energy sources will not diminish the need for robust IRM but rather augment it, as new renewable infrastructures require rigorous integrity management. The market's trajectory indicates a sustained period of growth, characterized by greater efficiency, enhanced safety, and an increasing reliance on data-driven decision-making, positioning IRM services as indispensable for the long-term success of offshore operations.
Offshore IRM Service Segmentation
-
1. Application
- 1.1. Oil & Gas
- 1.2. Wind Farms
- 1.3. Others
-
2. Types
- 2.1. Inspection
- 2.2. Maintenance
- 2.3. Repair
- 2.4. Others
Offshore IRM Service Segmentation By Geography
-
1. North America
- 1.1. United States
- 1.2. Canada
- 1.3. Mexico
-
2. South America
- 2.1. Brazil
- 2.2. Argentina
- 2.3. Rest of South America
-
3. Europe
- 3.1. United Kingdom
- 3.2. Germany
- 3.3. France
- 3.4. Italy
- 3.5. Spain
- 3.6. Russia
- 3.7. Benelux
- 3.8. Nordics
- 3.9. Rest of Europe
-
4. Middle East & Africa
- 4.1. Turkey
- 4.2. Israel
- 4.3. GCC
- 4.4. North Africa
- 4.5. South Africa
- 4.6. Rest of Middle East & Africa
-
5. Asia Pacific
- 5.1. China
- 5.2. India
- 5.3. Japan
- 5.4. South Korea
- 5.5. ASEAN
- 5.6. Oceania
- 5.7. Rest of Asia Pacific
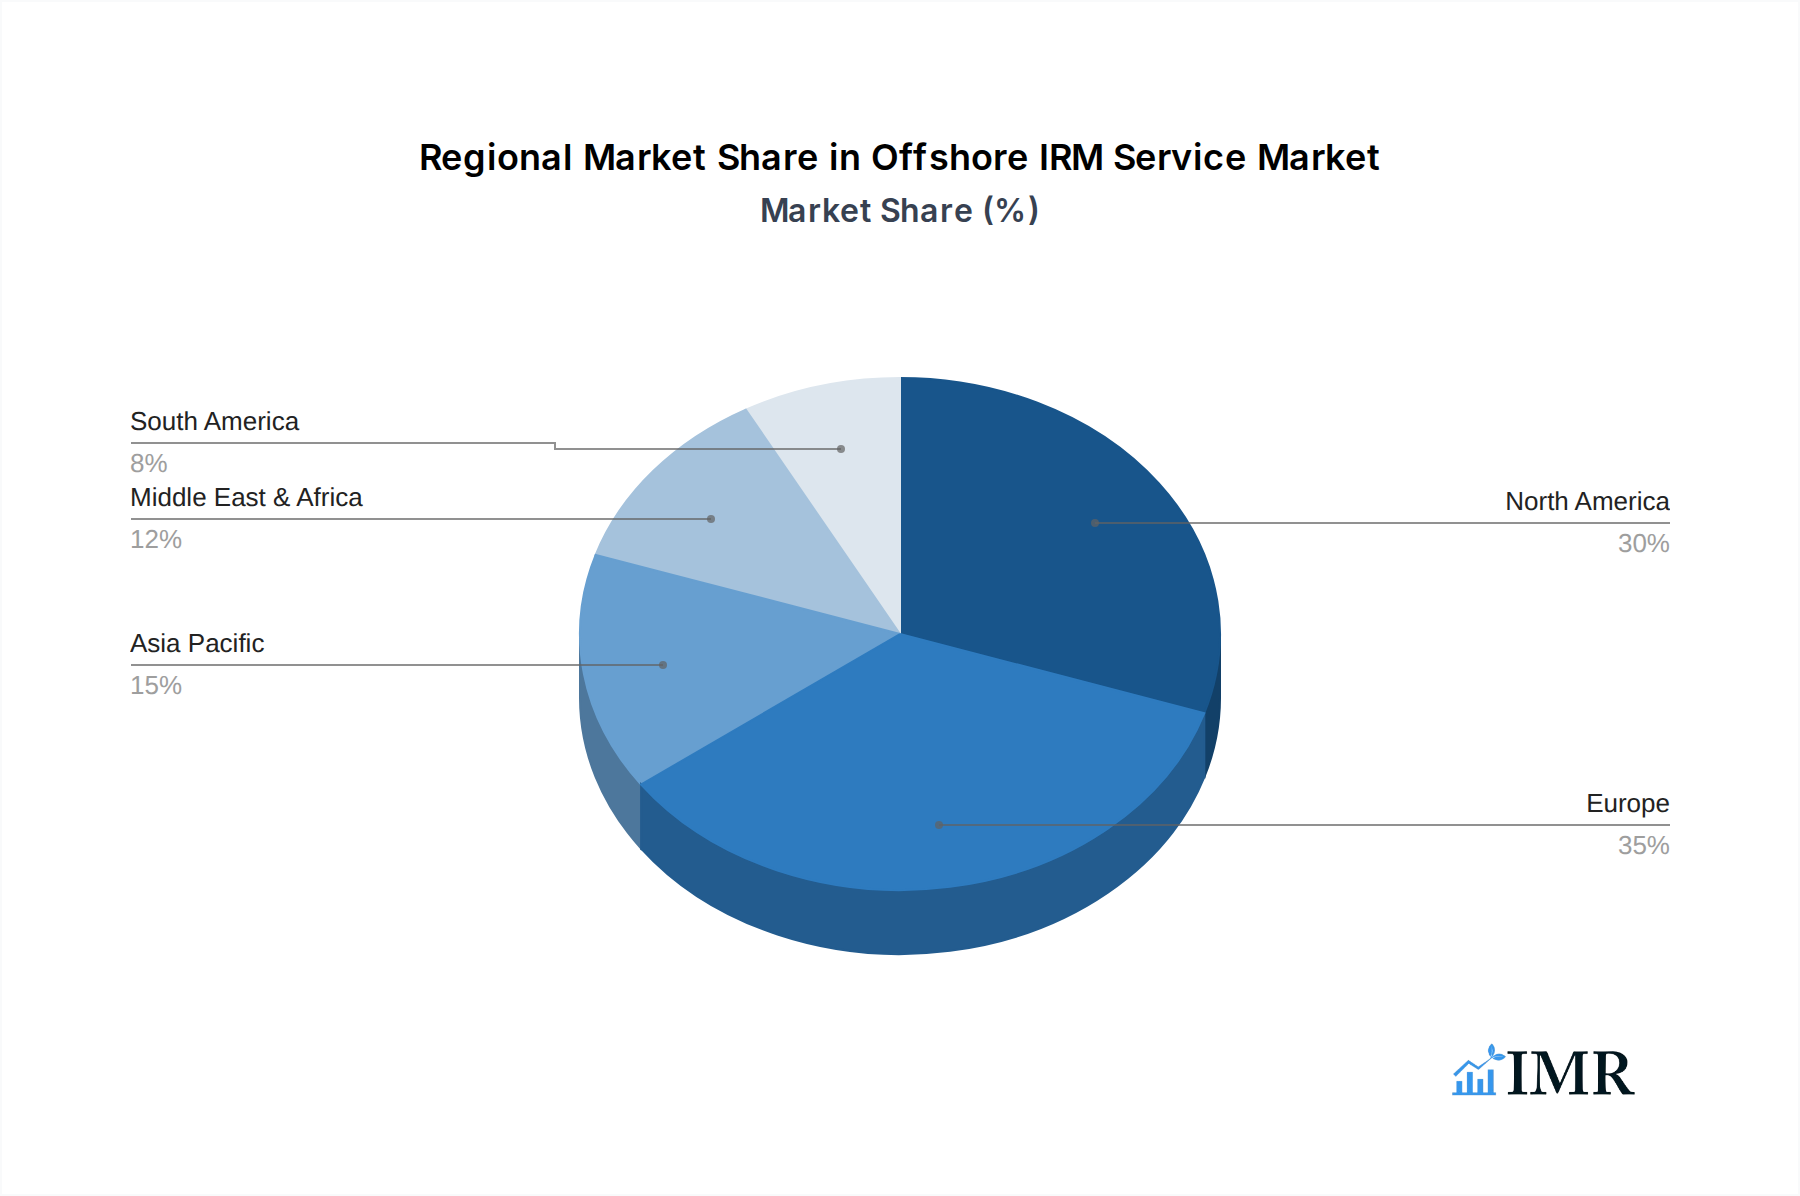
Offshore IRM Service Regional Market Share
Geographic Coverage of Offshore IRM Service
Offshore IRM Service REPORT HIGHLIGHTS
| Aspects | Details |
|---|---|
| Study Period | 2020-2034 |
| Base Year | 2025 |
| Estimated Year | 2026 |
| Forecast Period | 2026-2034 |
| Historical Period | 2020-2025 |
| Growth Rate | CAGR of 7.6% from 2020-2034 |
| Segmentation |
|
Table of Contents
- 1. Introduction
- 1.1. Research Scope
- 1.2. Market Segmentation
- 1.3. Research Objective
- 1.4. Definitions and Assumptions
- 2. Executive Summary
- 2.1. Market Snapshot
- 3. Market Dynamics
- 3.1. Market Drivers
- 3.2. Market Restrains
- 3.3. Market Trends
- 3.4. Market Opportunities
- 4. Market Factor Analysis
- 4.1. Porters Five Forces
- 4.1.1. Bargaining Power of Suppliers
- 4.1.2. Bargaining Power of Buyers
- 4.1.3. Threat of New Entrants
- 4.1.4. Threat of Substitutes
- 4.1.5. Competitive Rivalry
- 4.2. PESTEL analysis
- 4.3. BCG Analysis
- 4.3.1. Stars (High Growth, High Market Share)
- 4.3.2. Cash Cows (Low Growth, High Market Share)
- 4.3.3. Question Mark (High Growth, Low Market Share)
- 4.3.4. Dogs (Low Growth, Low Market Share)
- 4.4. Ansoff Matrix Analysis
- 4.5. Supply Chain Analysis
- 4.6. Regulatory Landscape
- 4.7. Current Market Potential and Opportunity Assessment (TAM–SAM–SOM Framework)
- 4.8. IMR Analyst Note
- 4.1. Porters Five Forces
- 5. Market Analysis, Insights and Forecast 2021-2033
- 5.1. Market Analysis, Insights and Forecast - by Application
- 5.1.1. Oil & Gas
- 5.1.2. Wind Farms
- 5.1.3. Others
- 5.2. Market Analysis, Insights and Forecast - by Types
- 5.2.1. Inspection
- 5.2.2. Maintenance
- 5.2.3. Repair
- 5.2.4. Others
- 5.3. Market Analysis, Insights and Forecast - by Region
- 5.3.1. North America
- 5.3.2. South America
- 5.3.3. Europe
- 5.3.4. Middle East & Africa
- 5.3.5. Asia Pacific
- 5.1. Market Analysis, Insights and Forecast - by Application
- 6. Global Offshore IRM Service Analysis, Insights and Forecast, 2021-2033
- 6.1. Market Analysis, Insights and Forecast - by Application
- 6.1.1. Oil & Gas
- 6.1.2. Wind Farms
- 6.1.3. Others
- 6.2. Market Analysis, Insights and Forecast - by Types
- 6.2.1. Inspection
- 6.2.2. Maintenance
- 6.2.3. Repair
- 6.2.4. Others
- 6.1. Market Analysis, Insights and Forecast - by Application
- 7. North America Offshore IRM Service Analysis, Insights and Forecast, 2020-2032
- 7.1. Market Analysis, Insights and Forecast - by Application
- 7.1.1. Oil & Gas
- 7.1.2. Wind Farms
- 7.1.3. Others
- 7.2. Market Analysis, Insights and Forecast - by Types
- 7.2.1. Inspection
- 7.2.2. Maintenance
- 7.2.3. Repair
- 7.2.4. Others
- 7.1. Market Analysis, Insights and Forecast - by Application
- 8. South America Offshore IRM Service Analysis, Insights and Forecast, 2020-2032
- 8.1. Market Analysis, Insights and Forecast - by Application
- 8.1.1. Oil & Gas
- 8.1.2. Wind Farms
- 8.1.3. Others
- 8.2. Market Analysis, Insights and Forecast - by Types
- 8.2.1. Inspection
- 8.2.2. Maintenance
- 8.2.3. Repair
- 8.2.4. Others
- 8.1. Market Analysis, Insights and Forecast - by Application
- 9. Europe Offshore IRM Service Analysis, Insights and Forecast, 2020-2032
- 9.1. Market Analysis, Insights and Forecast - by Application
- 9.1.1. Oil & Gas
- 9.1.2. Wind Farms
- 9.1.3. Others
- 9.2. Market Analysis, Insights and Forecast - by Types
- 9.2.1. Inspection
- 9.2.2. Maintenance
- 9.2.3. Repair
- 9.2.4. Others
- 9.1. Market Analysis, Insights and Forecast - by Application
- 10. Middle East & Africa Offshore IRM Service Analysis, Insights and Forecast, 2020-2032
- 10.1. Market Analysis, Insights and Forecast - by Application
- 10.1.1. Oil & Gas
- 10.1.2. Wind Farms
- 10.1.3. Others
- 10.2. Market Analysis, Insights and Forecast - by Types
- 10.2.1. Inspection
- 10.2.2. Maintenance
- 10.2.3. Repair
- 10.2.4. Others
- 10.1. Market Analysis, Insights and Forecast - by Application
- 11. Asia Pacific Offshore IRM Service Analysis, Insights and Forecast, 2020-2032
- 11.1. Market Analysis, Insights and Forecast - by Application
- 11.1.1. Oil & Gas
- 11.1.2. Wind Farms
- 11.1.3. Others
- 11.2. Market Analysis, Insights and Forecast - by Types
- 11.2.1. Inspection
- 11.2.2. Maintenance
- 11.2.3. Repair
- 11.2.4. Others
- 11.1. Market Analysis, Insights and Forecast - by Application
- 12. Competitive Analysis
- 12.1. Company Profiles
- 12.1.1 ABJ Drones
- 12.1.1.1. Company Overview
- 12.1.1.2. Products
- 12.1.1.3. Company Financials
- 12.1.1.4. SWOT Analysis
- 12.1.2 MISTRAS Group
- 12.1.2.1. Company Overview
- 12.1.2.2. Products
- 12.1.2.3. Company Financials
- 12.1.2.4. SWOT Analysis
- 12.1.3 Inc.
- 12.1.3.1. Company Overview
- 12.1.3.2. Products
- 12.1.3.3. Company Financials
- 12.1.3.4. SWOT Analysis
- 12.1.4 Technip FMC
- 12.1.4.1. Company Overview
- 12.1.4.2. Products
- 12.1.4.3. Company Financials
- 12.1.4.4. SWOT Analysis
- 12.1.5 Sinovoltaics Group
- 12.1.5.1. Company Overview
- 12.1.5.2. Products
- 12.1.5.3. Company Financials
- 12.1.5.4. SWOT Analysis
- 12.1.6 Rever Offshore
- 12.1.6.1. Company Overview
- 12.1.6.2. Products
- 12.1.6.3. Company Financials
- 12.1.6.4. SWOT Analysis
- 12.1.7 Bluestream
- 12.1.7.1. Company Overview
- 12.1.7.2. Products
- 12.1.7.3. Company Financials
- 12.1.7.4. SWOT Analysis
- 12.1.8 Baker Hughes
- 12.1.8.1. Company Overview
- 12.1.8.2. Products
- 12.1.8.3. Company Financials
- 12.1.8.4. SWOT Analysis
- 12.1.9 Teledyne FLIR
- 12.1.9.1. Company Overview
- 12.1.9.2. Products
- 12.1.9.3. Company Financials
- 12.1.9.4. SWOT Analysis
- 12.1.10 Petrofac
- 12.1.10.1. Company Overview
- 12.1.10.2. Products
- 12.1.10.3. Company Financials
- 12.1.10.4. SWOT Analysis
- 12.1.11 Starke Marine
- 12.1.11.1. Company Overview
- 12.1.11.2. Products
- 12.1.11.3. Company Financials
- 12.1.11.4. SWOT Analysis
- 12.1.12 James Fisher Marine Services
- 12.1.12.1. Company Overview
- 12.1.12.2. Products
- 12.1.12.3. Company Financials
- 12.1.12.4. SWOT Analysis
- 12.1.1 ABJ Drones
- 12.2. Market Entropy
- 12.2.1 Company's Key Areas Served
- 12.2.2 Recent Developments
- 12.3. Company Market Share Analysis 2025
- 12.3.1 Top 5 Companies Market Share Analysis
- 12.3.2 Top 3 Companies Market Share Analysis
- 12.4. List of Potential Customers
- 13. Research Methodology
List of Figures
- Figure 1: Global Offshore IRM Service Revenue Breakdown (million, %) by Region 2025 & 2033
- Figure 2: North America Offshore IRM Service Revenue (million), by Application 2025 & 2033
- Figure 3: North America Offshore IRM Service Revenue Share (%), by Application 2025 & 2033
- Figure 4: North America Offshore IRM Service Revenue (million), by Types 2025 & 2033
- Figure 5: North America Offshore IRM Service Revenue Share (%), by Types 2025 & 2033
- Figure 6: North America Offshore IRM Service Revenue (million), by Country 2025 & 2033
- Figure 7: North America Offshore IRM Service Revenue Share (%), by Country 2025 & 2033
- Figure 8: South America Offshore IRM Service Revenue (million), by Application 2025 & 2033
- Figure 9: South America Offshore IRM Service Revenue Share (%), by Application 2025 & 2033
- Figure 10: South America Offshore IRM Service Revenue (million), by Types 2025 & 2033
- Figure 11: South America Offshore IRM Service Revenue Share (%), by Types 2025 & 2033
- Figure 12: South America Offshore IRM Service Revenue (million), by Country 2025 & 2033
- Figure 13: South America Offshore IRM Service Revenue Share (%), by Country 2025 & 2033
- Figure 14: Europe Offshore IRM Service Revenue (million), by Application 2025 & 2033
- Figure 15: Europe Offshore IRM Service Revenue Share (%), by Application 2025 & 2033
- Figure 16: Europe Offshore IRM Service Revenue (million), by Types 2025 & 2033
- Figure 17: Europe Offshore IRM Service Revenue Share (%), by Types 2025 & 2033
- Figure 18: Europe Offshore IRM Service Revenue (million), by Country 2025 & 2033
- Figure 19: Europe Offshore IRM Service Revenue Share (%), by Country 2025 & 2033
- Figure 20: Middle East & Africa Offshore IRM Service Revenue (million), by Application 2025 & 2033
- Figure 21: Middle East & Africa Offshore IRM Service Revenue Share (%), by Application 2025 & 2033
- Figure 22: Middle East & Africa Offshore IRM Service Revenue (million), by Types 2025 & 2033
- Figure 23: Middle East & Africa Offshore IRM Service Revenue Share (%), by Types 2025 & 2033
- Figure 24: Middle East & Africa Offshore IRM Service Revenue (million), by Country 2025 & 2033
- Figure 25: Middle East & Africa Offshore IRM Service Revenue Share (%), by Country 2025 & 2033
- Figure 26: Asia Pacific Offshore IRM Service Revenue (million), by Application 2025 & 2033
- Figure 27: Asia Pacific Offshore IRM Service Revenue Share (%), by Application 2025 & 2033
- Figure 28: Asia Pacific Offshore IRM Service Revenue (million), by Types 2025 & 2033
- Figure 29: Asia Pacific Offshore IRM Service Revenue Share (%), by Types 2025 & 2033
- Figure 30: Asia Pacific Offshore IRM Service Revenue (million), by Country 2025 & 2033
- Figure 31: Asia Pacific Offshore IRM Service Revenue Share (%), by Country 2025 & 2033
List of Tables
- Table 1: Global Offshore IRM Service Revenue million Forecast, by Application 2020 & 2033
- Table 2: Global Offshore IRM Service Revenue million Forecast, by Types 2020 & 2033
- Table 3: Global Offshore IRM Service Revenue million Forecast, by Region 2020 & 2033
- Table 4: Global Offshore IRM Service Revenue million Forecast, by Application 2020 & 2033
- Table 5: Global Offshore IRM Service Revenue million Forecast, by Types 2020 & 2033
- Table 6: Global Offshore IRM Service Revenue million Forecast, by Country 2020 & 2033
- Table 7: United States Offshore IRM Service Revenue (million) Forecast, by Application 2020 & 2033
- Table 8: Canada Offshore IRM Service Revenue (million) Forecast, by Application 2020 & 2033
- Table 9: Mexico Offshore IRM Service Revenue (million) Forecast, by Application 2020 & 2033
- Table 10: Global Offshore IRM Service Revenue million Forecast, by Application 2020 & 2033
- Table 11: Global Offshore IRM Service Revenue million Forecast, by Types 2020 & 2033
- Table 12: Global Offshore IRM Service Revenue million Forecast, by Country 2020 & 2033
- Table 13: Brazil Offshore IRM Service Revenue (million) Forecast, by Application 2020 & 2033
- Table 14: Argentina Offshore IRM Service Revenue (million) Forecast, by Application 2020 & 2033
- Table 15: Rest of South America Offshore IRM Service Revenue (million) Forecast, by Application 2020 & 2033
- Table 16: Global Offshore IRM Service Revenue million Forecast, by Application 2020 & 2033
- Table 17: Global Offshore IRM Service Revenue million Forecast, by Types 2020 & 2033
- Table 18: Global Offshore IRM Service Revenue million Forecast, by Country 2020 & 2033
- Table 19: United Kingdom Offshore IRM Service Revenue (million) Forecast, by Application 2020 & 2033
- Table 20: Germany Offshore IRM Service Revenue (million) Forecast, by Application 2020 & 2033
- Table 21: France Offshore IRM Service Revenue (million) Forecast, by Application 2020 & 2033
- Table 22: Italy Offshore IRM Service Revenue (million) Forecast, by Application 2020 & 2033
- Table 23: Spain Offshore IRM Service Revenue (million) Forecast, by Application 2020 & 2033
- Table 24: Russia Offshore IRM Service Revenue (million) Forecast, by Application 2020 & 2033
- Table 25: Benelux Offshore IRM Service Revenue (million) Forecast, by Application 2020 & 2033
- Table 26: Nordics Offshore IRM Service Revenue (million) Forecast, by Application 2020 & 2033
- Table 27: Rest of Europe Offshore IRM Service Revenue (million) Forecast, by Application 2020 & 2033
- Table 28: Global Offshore IRM Service Revenue million Forecast, by Application 2020 & 2033
- Table 29: Global Offshore IRM Service Revenue million Forecast, by Types 2020 & 2033
- Table 30: Global Offshore IRM Service Revenue million Forecast, by Country 2020 & 2033
- Table 31: Turkey Offshore IRM Service Revenue (million) Forecast, by Application 2020 & 2033
- Table 32: Israel Offshore IRM Service Revenue (million) Forecast, by Application 2020 & 2033
- Table 33: GCC Offshore IRM Service Revenue (million) Forecast, by Application 2020 & 2033
- Table 34: North Africa Offshore IRM Service Revenue (million) Forecast, by Application 2020 & 2033
- Table 35: South Africa Offshore IRM Service Revenue (million) Forecast, by Application 2020 & 2033
- Table 36: Rest of Middle East & Africa Offshore IRM Service Revenue (million) Forecast, by Application 2020 & 2033
- Table 37: Global Offshore IRM Service Revenue million Forecast, by Application 2020 & 2033
- Table 38: Global Offshore IRM Service Revenue million Forecast, by Types 2020 & 2033
- Table 39: Global Offshore IRM Service Revenue million Forecast, by Country 2020 & 2033
- Table 40: China Offshore IRM Service Revenue (million) Forecast, by Application 2020 & 2033
- Table 41: India Offshore IRM Service Revenue (million) Forecast, by Application 2020 & 2033
- Table 42: Japan Offshore IRM Service Revenue (million) Forecast, by Application 2020 & 2033
- Table 43: South Korea Offshore IRM Service Revenue (million) Forecast, by Application 2020 & 2033
- Table 44: ASEAN Offshore IRM Service Revenue (million) Forecast, by Application 2020 & 2033
- Table 45: Oceania Offshore IRM Service Revenue (million) Forecast, by Application 2020 & 2033
- Table 46: Rest of Asia Pacific Offshore IRM Service Revenue (million) Forecast, by Application 2020 & 2033
Frequently Asked Questions
1. What is the projected Compound Annual Growth Rate (CAGR) of the Offshore IRM Service?
The projected CAGR is approximately 7.6%.
2. Which companies are prominent players in the Offshore IRM Service?
Key companies in the market include ABJ Drones, MISTRAS Group, Inc., Technip FMC, Sinovoltaics Group, Rever Offshore, Bluestream, Baker Hughes, Teledyne FLIR, Petrofac, Starke Marine, James Fisher Marine Services.
3. What are the main segments of the Offshore IRM Service?
The market segments include Application, Types.
4. Can you provide details about the market size?
The market size is estimated to be USD 3060 million as of 2022.
5. What are some drivers contributing to market growth?
N/A
6. What are the notable trends driving market growth?
N/A
7. Are there any restraints impacting market growth?
N/A
8. Can you provide examples of recent developments in the market?
N/A
9. What pricing options are available for accessing the report?
Pricing options include single-user, multi-user, and enterprise licenses priced at USD 3350.00, USD 5025.00, and USD 6700.00 respectively.
10. Is the market size provided in terms of value or volume?
The market size is provided in terms of value, measured in million.
11. Are there any specific market keywords associated with the report?
Yes, the market keyword associated with the report is "Offshore IRM Service," which aids in identifying and referencing the specific market segment covered.
12. How do I determine which pricing option suits my needs best?
The pricing options vary based on user requirements and access needs. Individual users may opt for single-user licenses, while businesses requiring broader access may choose multi-user or enterprise licenses for cost-effective access to the report.
13. Are there any additional resources or data provided in the Offshore IRM Service report?
While the report offers comprehensive insights, it's advisable to review the specific contents or supplementary materials provided to ascertain if additional resources or data are available.
14. How can I stay updated on further developments or reports in the Offshore IRM Service?
To stay informed about further developments, trends, and reports in the Offshore IRM Service, consider subscribing to industry newsletters, following relevant companies and organizations, or regularly checking reputable industry news sources and publications.
Methodology
Step 1 - Identification of Relevant Samples Size from Population Database


Step 2 - Approaches for Defining Global Market Size (Value, Volume* & Price*)

Note*: In applicable scenarios
Step 3 - Data Sources
Primary Research
- Web Analytics
- Survey Reports
- Research Institute
- Latest Research Reports
- Opinion Leaders
Secondary Research
- Annual Reports
- White Paper
- Latest Press Release
- Industry Association
- Paid Database
- Investor Presentations

Step 4 - Data Triangulation
Involves using different sources of information in order to increase the validity of a study
These sources are likely to be stakeholders in a program - participants, other researchers, program staff, other community members, and so on.
Then we put all data in single framework & apply various statistical tools to find out the dynamic on the market.
During the analysis stage, feedback from the stakeholder groups would be compared to determine areas of agreement as well as areas of divergence