

Key Insights
The global Offshore Support Vessels (OSV) market is projected to reach $46.2 billion by 2024, with a compound annual growth rate (CAGR) of 3.2% from 2024 to 2032. This growth is primarily driven by increasing offshore oil and gas exploration and production activities, particularly in the Asia-Pacific and Middle East regions. Specialized vessels like Anchor Handling Tug/Anchor Handling Towing Supply Vessels (AHT/AHTSs) and Platform Supply Vessels (PSVs) are in high demand. The expanding offshore wind energy sector also contributes significantly, requiring OSVs for installation and maintenance. Technological advancements in vessel design and operational efficiency, including automation and fuel efficiency, are enhancing market competitiveness. Key market restraints include oil price volatility, stringent environmental regulations, and the cyclical nature of the energy industry. Despite these challenges, the long-term outlook for the OSV market remains positive due to the continuous need for reliable offshore energy support services.
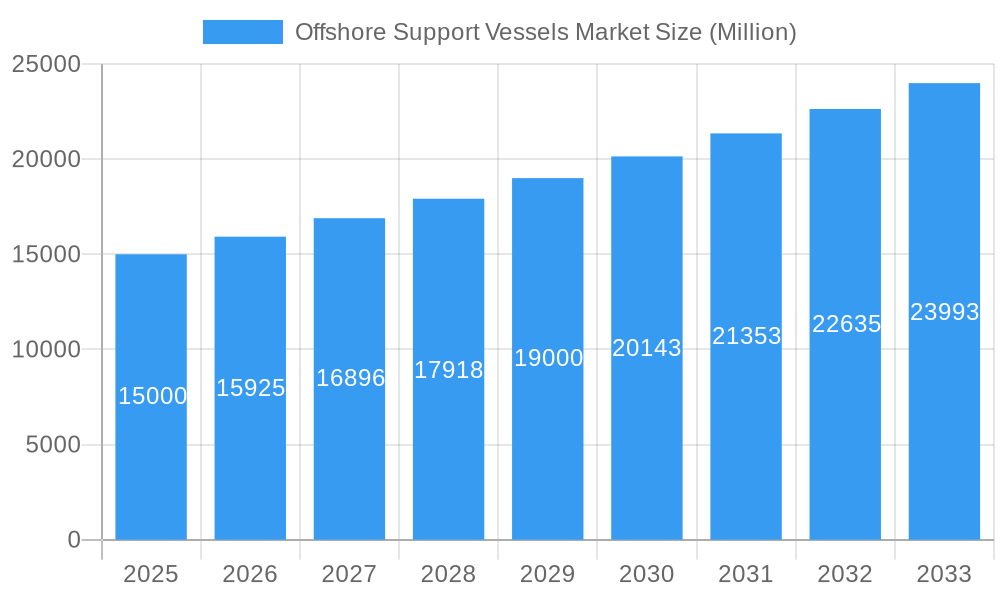
Offshore Support Vessels Market Market Size (In Billion)
Market segmentation shows AHT/AHTSs and PSVs currently leading in market share, essential for anchor handling and platform supply. The "Other Types" segment presents considerable future growth potential driven by technological evolution and diversification in offshore energy sources. North America and Asia-Pacific are expected to remain dominant markets, fueled by substantial energy exploration and renewable energy projects. The competitive landscape features established players such as Tidewater Inc., Harvey Gulf International Marine LLC, and Edison Chouest Offshore LLC, alongside other global companies. Strategic alliances, mergers, and acquisitions are anticipated to shape market dynamics. The forecast period (2024-2032) indicates substantial market expansion, offering opportunities for both established and new entrants. Detailed regional analysis across North America, Europe, Asia-Pacific, South America, and MEA provides deeper insights into growth patterns and investment prospects.
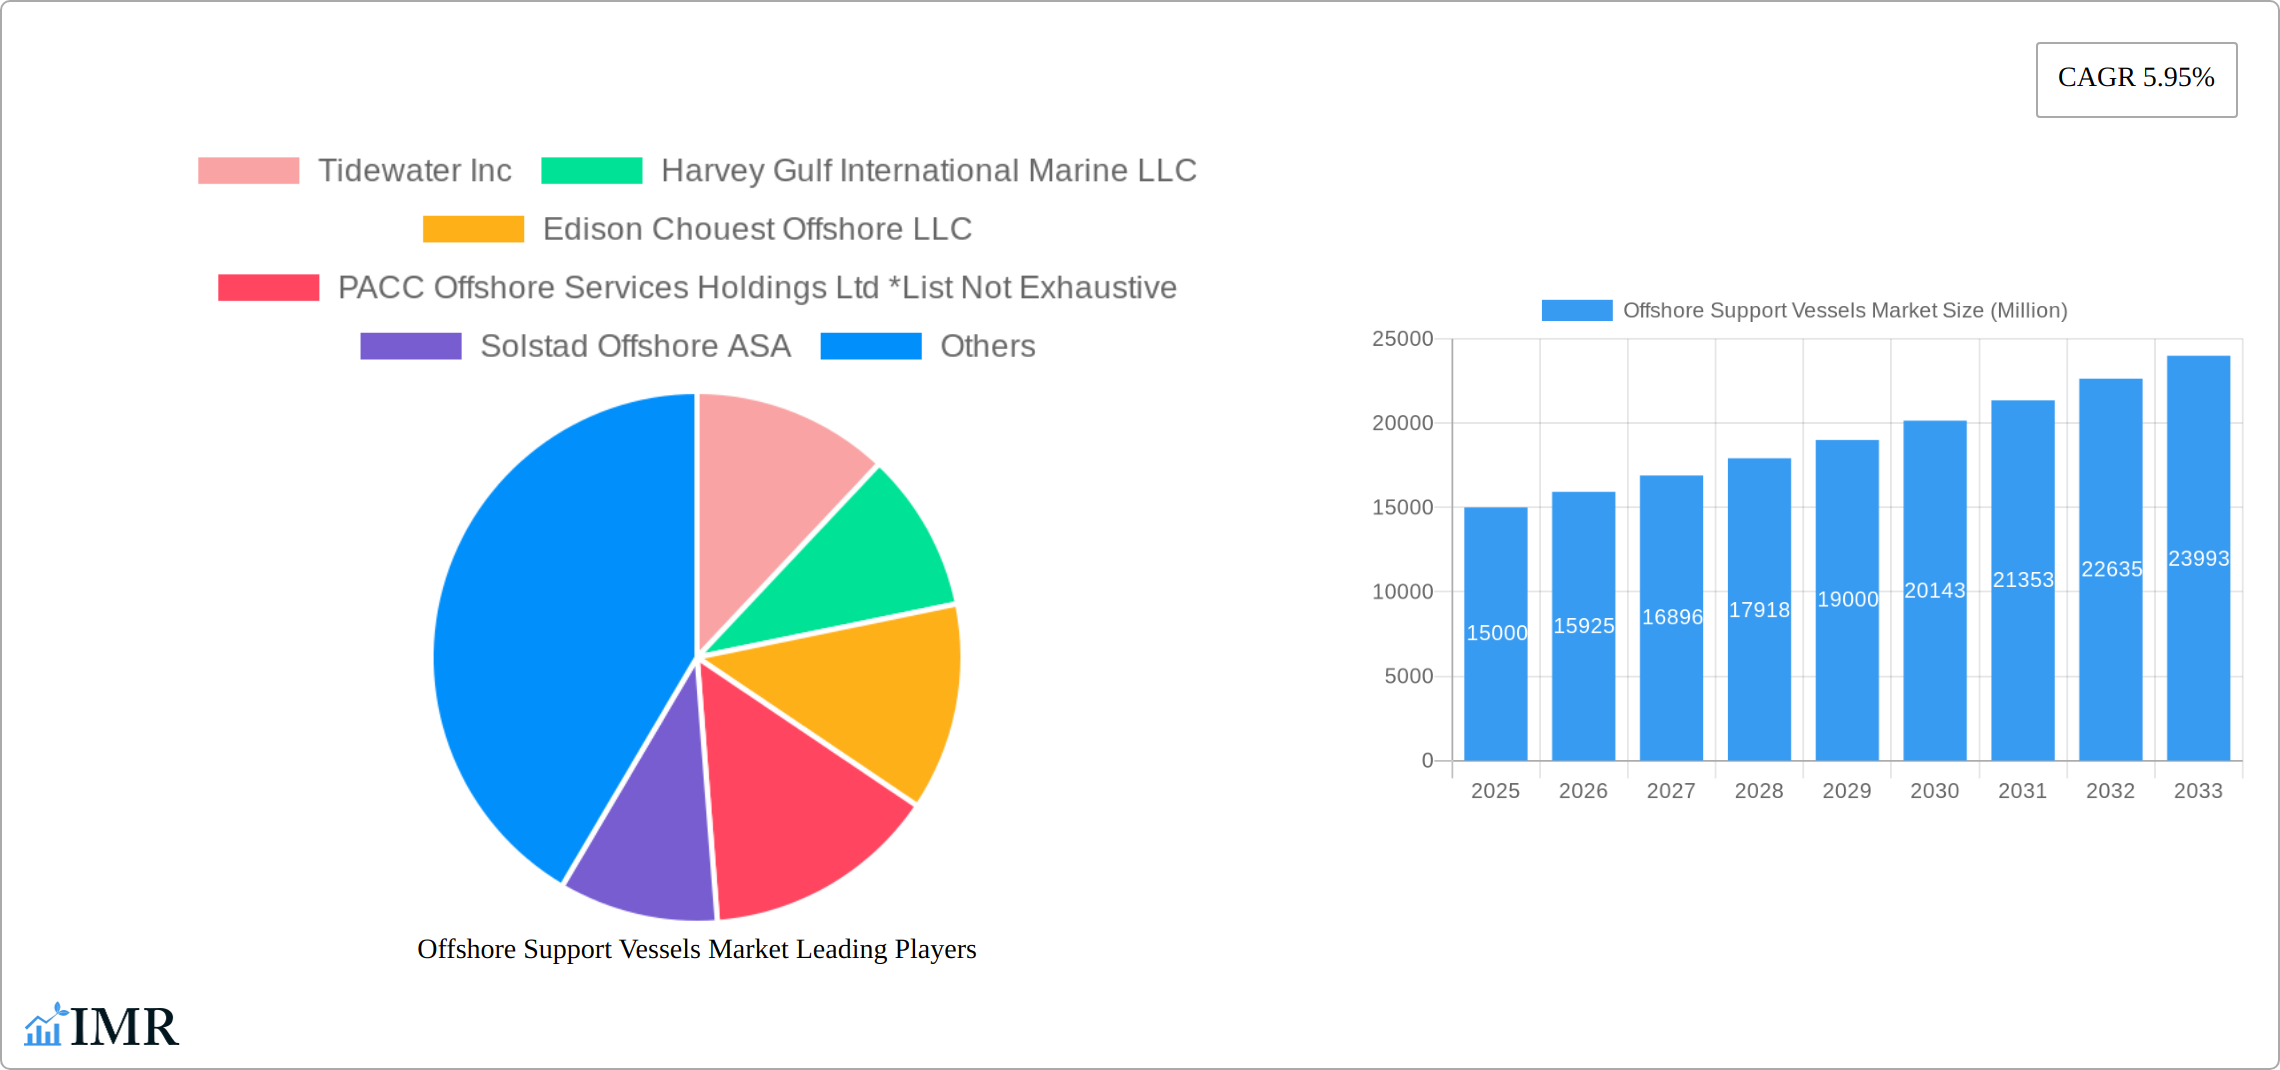
Offshore Support Vessels Market Company Market Share
Offshore Support Vessels Market Report: 2019-2033
This comprehensive report provides a deep dive into the Offshore Support Vessels (OSV) market, encompassing its dynamics, growth trends, leading players, and future outlook. With a detailed analysis spanning the period 2019-2033 (Historical Period: 2019-2024; Base Year: 2025; Forecast Period: 2025-2033), this report is an indispensable resource for industry professionals, investors, and strategic decision-makers. The market is segmented by vessel type: Anchor Handling Tug/Anchor Handling Towing Supply Vessels (AHT/AHTSs), Platform Supply Vessels (PSVs), and Other Types, offering granular insights into each segment's performance and growth trajectory. The total market value is predicted to reach xx Million by 2033.
Offshore Support Vessels Market Dynamics & Structure
The offshore support vessels market is characterized by moderate concentration, with several key players holding significant market share. Technological innovation, particularly in automation and emission reduction technologies, is a major driver, while stringent regulatory frameworks concerning safety and environmental impact influence market dynamics. The market faces competition from alternative solutions for offshore support, albeit limited. The end-user demographic primarily comprises oil & gas companies and renewable energy developers. M&A activity has been moderate in recent years, with several strategic acquisitions aimed at expanding fleet capacity and geographic reach. The overall market size in 2025 is estimated at xx Million.
- Market Concentration: Moderately concentrated, with top 5 players holding approximately xx% market share in 2025.
- Technological Innovation: Focus on automation, improved fuel efficiency, and emissions reduction technologies. Barriers include high R&D costs and integration challenges.
- Regulatory Framework: Stringent safety and environmental regulations driving adoption of advanced technologies and operational changes.
- Competitive Substitutes: Limited direct substitutes, with niche technologies gradually emerging in specific applications.
- End-User Demographics: Primarily oil & gas companies, with growing participation from renewable energy sector.
- M&A Trends: Moderate M&A activity, driven by consolidation and expansion strategies (xx deals in the past 5 years).
Offshore Support Vessels Market Growth Trends & Insights
The OSV market experienced fluctuating growth during the historical period (2019-2024), primarily influenced by oil price volatility and the global economic climate. However, the market is projected to witness a steady recovery and growth during the forecast period (2025-2033), driven by increased offshore oil and gas exploration activities, particularly in developing economies. The rising demand for offshore wind power installation and maintenance further fuels market expansion. The adoption of advanced technologies is steadily increasing, driven by a push for efficiency and cost-effectiveness. Consumer behavior shows preference for vessels with higher fuel efficiency and enhanced safety features. The CAGR during the forecast period is estimated at xx%. Market penetration for advanced technologies will reach xx% by 2033.
Dominant Regions, Countries, or Segments in Offshore Support Vessels Market
The Asia-Pacific region is currently dominating the offshore support vessels market, driven by significant oil and gas exploration and production activities in countries like China, Australia, and India. Furthermore, the rapidly growing offshore wind energy sector in this region presents substantial opportunities for OSV deployment. Within the segment breakdown, Platform Supply Vessels (PSVs) and Anchor Handling Tug/Anchor Handling Towing Supply Vessels (AHT/AHTSs) currently hold the largest market share, driven by their versatility and widespread applications in various offshore operations.
- Key Drivers in Asia-Pacific: High offshore energy activity, growing renewable energy sector, supportive government policies.
- PSV and AHT/AHTS Dominance: Versatility in operations, high demand in oil & gas and renewable energy projects.
- Market Share: Asia-Pacific holds approximately xx% of the global OSV market in 2025; PSVs and AHT/AHTSs collectively account for xx% of the total market.
- Growth Potential: Significant growth potential in other regions, driven by exploration in less developed regions and increasing offshore renewable energy projects.
Offshore Support Vessels Market Product Landscape
Recent innovations in OSV technology focus on enhancing fuel efficiency, reducing emissions, improving operational safety, and increasing payload capacity. Dynamic positioning systems, advanced automation features, and specialized equipment for specific tasks are key advancements. These improvements increase operational efficiency, reduce downtime, and enhance the overall performance of support vessels, leading to a competitive advantage in securing contracts. The market sees growing differentiation in design and functionality based on specific operational requirements.
Key Drivers, Barriers & Challenges in Offshore Support Vessels Market
Key Drivers: Increased offshore energy exploration and production activities, particularly in developing economies; Growth of the offshore wind power industry; Technological advancements, such as automation and emission reduction technologies; Favorable government policies promoting energy security and renewable energy development.
Key Challenges & Restraints: Fluctuations in oil prices; Stringent environmental regulations increasing operational costs; High initial investment and maintenance costs for advanced vessels; Competition from alternative support solutions; Supply chain disruptions impacting vessel construction and maintenance. The impact of these challenges can be quantified through reduced profitability and delays in project schedules, estimated at xx% in 2025.
Emerging Opportunities in Offshore Support Vessels Market
The offshore support vessel (OSV) market is experiencing a surge in growth fueled by several key factors. Developing economies represent vast untapped markets, offering significant expansion potential for OSV operators. The rapid growth of the offshore wind energy sector is a primary driver, creating substantial demand for specialized vessels designed for tasks such as turbine installation, maintenance, and subsea cable laying. Further opportunities arise from innovations in vessel design and functionality, leading to increased efficiency and reduced operational costs. The development and adoption of improved energy-efficient technologies and reduced-emission solutions are crucial for long-term market success and environmental sustainability. This focus on sustainability is increasingly important to securing contracts and maintaining a competitive edge.
Growth Accelerators in the Offshore Support Vessels Market Industry
Several factors are accelerating the growth of the OSV market. Ongoing technological advancements, such as automation and improved navigation systems, enhance operational efficiency and safety, thereby increasing demand. Strategic partnerships between vessel operators and energy companies are fostering collaborative innovation and securing long-term contracts. Expansion into new geographic regions, particularly in Asia and Africa, presents significant opportunities for market growth. Government incentives and policies supporting renewable energy initiatives and offshore exploration play a crucial role in driving demand. The development of specialized vessels tailored to meet the unique needs of specific sectors, including offshore wind, subsea construction, and oil and gas exploration, fuels further market expansion.
Key Players Shaping the Offshore Support Vessels Market Market
- Tidewater Inc
- Harvey Gulf International Marine LLC
- Edison Chouest Offshore LLC
- PACC Offshore Services Holdings Ltd
- Solstad Offshore ASA
- Maersk Supply Service AS
- Seacor Marine Holdings Inc
- Swire Pacific Limited
- Bourbon Corporation SA
- Hornbeck Offshore Services Inc
Notable Milestones in Offshore Support Vessels Market Sector
- March 2022: Island Offshore (Norway) secured USD 45.62 million in new contracts for platform supply vessels (PSVs), anchor handling tug supply (AHTS) vessels, and light well intervention vessels, highlighting strong demand across various OSV segments.
- March 2022: Havila Shipping's contract for the offshore construction vessel Havila Phoenix from Nexans Norway exemplifies the burgeoning subsea construction market and the increasing demand for specialized vessels equipped for complex subsea operations.
- [Add more recent milestones here with dates and brief descriptions. Include details like contract values and vessel types for stronger impact.]
In-Depth Offshore Support Vessels Market Market Outlook
The offshore support vessels market is projected to experience sustained growth in the coming years, driven by a confluence of factors. The continued exploration and extraction of oil and gas resources, coupled with the exponential growth of the offshore wind energy industry, ensures robust demand for a diverse range of OSVs. Strategic partnerships and investments in next-generation vessels, incorporating advanced technologies and sustainable practices, will further shape the market landscape. Companies prioritizing innovation, operational efficiency, and environmental sustainability are poised to gain a competitive advantage and capitalize on emerging opportunities. The long-term outlook remains positive, with significant expansion potential across both established and developing markets. The increasing focus on decarbonization within the energy sector will further influence vessel design and operational strategies.
Offshore Support Vessels Market Segmentation
-
1. Type
- 1.1. Anchor H
- 1.2. Platform Supply Vessels (PSVs)
- 1.3. Other Types
Offshore Support Vessels Market Segmentation By Geography
-
1. North America
- 1.1. United States
- 1.2. Canada
- 1.3. Rest of North America
-
2. Europe
- 2.1. United Kingdom
- 2.2. France
- 2.3. Russia
- 2.4. Norway
- 2.5. Italy
- 2.6. Germany
- 2.7. Rest of Europe
-
3. Asia Pacific
- 3.1. China
- 3.2. India
- 3.3. South Korea
- 3.4. Rest of Asia Pacific
-
4. South America
- 4.1. Brazil
- 4.2. Argentina
- 4.3. Rest of South America
-
5. Middle East and Africa
- 5.1. Saudi Arabia
- 5.2. Qatar
- 5.3. United Arab Emirates
- 5.4. Rest of Middle East and Africa
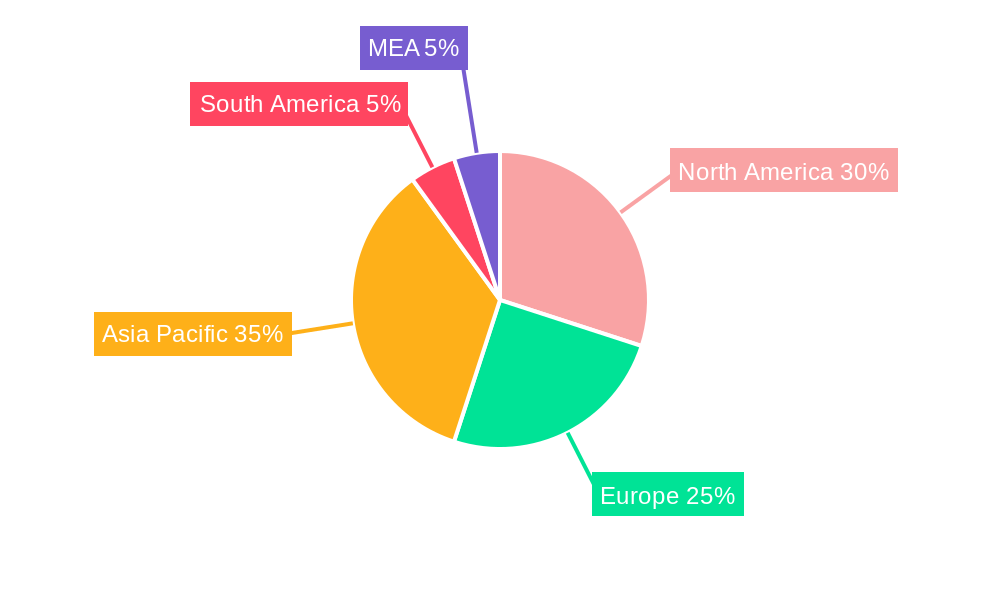
Offshore Support Vessels Market Regional Market Share
Geographic Coverage of Offshore Support Vessels Market
Offshore Support Vessels Market REPORT HIGHLIGHTS
| Aspects | Details |
|---|---|
| Study Period | 2020-2034 |
| Base Year | 2025 |
| Estimated Year | 2026 |
| Forecast Period | 2026-2034 |
| Historical Period | 2020-2025 |
| Growth Rate | CAGR of 3.2% from 2020-2034 |
| Segmentation |
|
Table of Contents
- 1. Introduction
- 1.1. Research Scope
- 1.2. Market Segmentation
- 1.3. Research Objective
- 1.4. Definitions and Assumptions
- 2. Executive Summary
- 2.1. Market Snapshot
- 3. Market Dynamics
- 3.1. Market Drivers
- 3.2. Market Restrains
- 3.3. Market Trends
- 3.4. Market Opportunities
- 4. Market Factor Analysis
- 4.1. Porters Five Forces
- 4.1.1. Bargaining Power of Suppliers
- 4.1.2. Bargaining Power of Buyers
- 4.1.3. Threat of New Entrants
- 4.1.4. Threat of Substitutes
- 4.1.5. Competitive Rivalry
- 4.2. PESTEL analysis
- 4.3. BCG Analysis
- 4.3.1. Stars (High Growth, High Market Share)
- 4.3.2. Cash Cows (Low Growth, High Market Share)
- 4.3.3. Question Mark (High Growth, Low Market Share)
- 4.3.4. Dogs (Low Growth, Low Market Share)
- 4.4. Ansoff Matrix Analysis
- 4.5. Supply Chain Analysis
- 4.6. Regulatory Landscape
- 4.7. Current Market Potential and Opportunity Assessment (TAM–SAM–SOM Framework)
- 4.8. IMR Analyst Note
- 4.1. Porters Five Forces
- 5. Market Analysis, Insights and Forecast 2021-2033
- 5.1. Market Analysis, Insights and Forecast - by Type
- 5.1.1. Anchor H
- 5.1.2. Platform Supply Vessels (PSVs)
- 5.1.3. Other Types
- 5.2. Market Analysis, Insights and Forecast - by Region
- 5.2.1. North America
- 5.2.2. Europe
- 5.2.3. Asia Pacific
- 5.2.4. South America
- 5.2.5. Middle East and Africa
- 5.1. Market Analysis, Insights and Forecast - by Type
- 6. Global Offshore Support Vessels Market Analysis, Insights and Forecast, 2021-2033
- 6.1. Market Analysis, Insights and Forecast - by Type
- 6.1.1. Anchor H
- 6.1.2. Platform Supply Vessels (PSVs)
- 6.1.3. Other Types
- 6.1. Market Analysis, Insights and Forecast - by Type
- 7. North America Offshore Support Vessels Market Analysis, Insights and Forecast, 2020-2032
- 7.1. Market Analysis, Insights and Forecast - by Type
- 7.1.1. Anchor H
- 7.1.2. Platform Supply Vessels (PSVs)
- 7.1.3. Other Types
- 7.1. Market Analysis, Insights and Forecast - by Type
- 8. Europe Offshore Support Vessels Market Analysis, Insights and Forecast, 2020-2032
- 8.1. Market Analysis, Insights and Forecast - by Type
- 8.1.1. Anchor H
- 8.1.2. Platform Supply Vessels (PSVs)
- 8.1.3. Other Types
- 8.1. Market Analysis, Insights and Forecast - by Type
- 9. Asia Pacific Offshore Support Vessels Market Analysis, Insights and Forecast, 2020-2032
- 9.1. Market Analysis, Insights and Forecast - by Type
- 9.1.1. Anchor H
- 9.1.2. Platform Supply Vessels (PSVs)
- 9.1.3. Other Types
- 9.1. Market Analysis, Insights and Forecast - by Type
- 10. South America Offshore Support Vessels Market Analysis, Insights and Forecast, 2020-2032
- 10.1. Market Analysis, Insights and Forecast - by Type
- 10.1.1. Anchor H
- 10.1.2. Platform Supply Vessels (PSVs)
- 10.1.3. Other Types
- 10.1. Market Analysis, Insights and Forecast - by Type
- 11. Middle East and Africa Offshore Support Vessels Market Analysis, Insights and Forecast, 2020-2032
- 11.1. Market Analysis, Insights and Forecast - by Type
- 11.1.1. Anchor H
- 11.1.2. Platform Supply Vessels (PSVs)
- 11.1.3. Other Types
- 11.1. Market Analysis, Insights and Forecast - by Type
- 12. Competitive Analysis
- 12.1. Company Profiles
- 12.1.1 Tidewater Inc
- 12.1.1.1. Company Overview
- 12.1.1.2. Products
- 12.1.1.3. Company Financials
- 12.1.1.4. SWOT Analysis
- 12.1.2 Harvey Gulf International Marine LLC
- 12.1.2.1. Company Overview
- 12.1.2.2. Products
- 12.1.2.3. Company Financials
- 12.1.2.4. SWOT Analysis
- 12.1.3 Edison Chouest Offshore LLC
- 12.1.3.1. Company Overview
- 12.1.3.2. Products
- 12.1.3.3. Company Financials
- 12.1.3.4. SWOT Analysis
- 12.1.4 PACC Offshore Services Holdings Ltd *List Not Exhaustive
- 12.1.4.1. Company Overview
- 12.1.4.2. Products
- 12.1.4.3. Company Financials
- 12.1.4.4. SWOT Analysis
- 12.1.5 Solstad Offshore ASA
- 12.1.5.1. Company Overview
- 12.1.5.2. Products
- 12.1.5.3. Company Financials
- 12.1.5.4. SWOT Analysis
- 12.1.6 Maersk Supply Service AS
- 12.1.6.1. Company Overview
- 12.1.6.2. Products
- 12.1.6.3. Company Financials
- 12.1.6.4. SWOT Analysis
- 12.1.7 Seacor Marine Holdings Inc
- 12.1.7.1. Company Overview
- 12.1.7.2. Products
- 12.1.7.3. Company Financials
- 12.1.7.4. SWOT Analysis
- 12.1.8 Swire Pacific Limited
- 12.1.8.1. Company Overview
- 12.1.8.2. Products
- 12.1.8.3. Company Financials
- 12.1.8.4. SWOT Analysis
- 12.1.9 Bourbon Corporation SA
- 12.1.9.1. Company Overview
- 12.1.9.2. Products
- 12.1.9.3. Company Financials
- 12.1.9.4. SWOT Analysis
- 12.1.10 Hornbeck Offshore Services Inc
- 12.1.10.1. Company Overview
- 12.1.10.2. Products
- 12.1.10.3. Company Financials
- 12.1.10.4. SWOT Analysis
- 12.1.1 Tidewater Inc
- 12.2. Market Entropy
- 12.2.1 Company's Key Areas Served
- 12.2.2 Recent Developments
- 12.3. Company Market Share Analysis 2025
- 12.3.1 Top 5 Companies Market Share Analysis
- 12.3.2 Top 3 Companies Market Share Analysis
- 12.4. List of Potential Customers
- 13. Research Methodology
List of Figures
- Figure 1: Global Offshore Support Vessels Market Revenue Breakdown (billion, %) by Region 2025 & 2033
- Figure 2: Global Offshore Support Vessels Market Volume Breakdown (K Unit, %) by Region 2025 & 2033
- Figure 3: North America Offshore Support Vessels Market Revenue (billion), by Type 2025 & 2033
- Figure 4: North America Offshore Support Vessels Market Volume (K Unit), by Type 2025 & 2033
- Figure 5: North America Offshore Support Vessels Market Revenue Share (%), by Type 2025 & 2033
- Figure 6: North America Offshore Support Vessels Market Volume Share (%), by Type 2025 & 2033
- Figure 7: North America Offshore Support Vessels Market Revenue (billion), by Country 2025 & 2033
- Figure 8: North America Offshore Support Vessels Market Volume (K Unit), by Country 2025 & 2033
- Figure 9: North America Offshore Support Vessels Market Revenue Share (%), by Country 2025 & 2033
- Figure 10: North America Offshore Support Vessels Market Volume Share (%), by Country 2025 & 2033
- Figure 11: Europe Offshore Support Vessels Market Revenue (billion), by Type 2025 & 2033
- Figure 12: Europe Offshore Support Vessels Market Volume (K Unit), by Type 2025 & 2033
- Figure 13: Europe Offshore Support Vessels Market Revenue Share (%), by Type 2025 & 2033
- Figure 14: Europe Offshore Support Vessels Market Volume Share (%), by Type 2025 & 2033
- Figure 15: Europe Offshore Support Vessels Market Revenue (billion), by Country 2025 & 2033
- Figure 16: Europe Offshore Support Vessels Market Volume (K Unit), by Country 2025 & 2033
- Figure 17: Europe Offshore Support Vessels Market Revenue Share (%), by Country 2025 & 2033
- Figure 18: Europe Offshore Support Vessels Market Volume Share (%), by Country 2025 & 2033
- Figure 19: Asia Pacific Offshore Support Vessels Market Revenue (billion), by Type 2025 & 2033
- Figure 20: Asia Pacific Offshore Support Vessels Market Volume (K Unit), by Type 2025 & 2033
- Figure 21: Asia Pacific Offshore Support Vessels Market Revenue Share (%), by Type 2025 & 2033
- Figure 22: Asia Pacific Offshore Support Vessels Market Volume Share (%), by Type 2025 & 2033
- Figure 23: Asia Pacific Offshore Support Vessels Market Revenue (billion), by Country 2025 & 2033
- Figure 24: Asia Pacific Offshore Support Vessels Market Volume (K Unit), by Country 2025 & 2033
- Figure 25: Asia Pacific Offshore Support Vessels Market Revenue Share (%), by Country 2025 & 2033
- Figure 26: Asia Pacific Offshore Support Vessels Market Volume Share (%), by Country 2025 & 2033
- Figure 27: South America Offshore Support Vessels Market Revenue (billion), by Type 2025 & 2033
- Figure 28: South America Offshore Support Vessels Market Volume (K Unit), by Type 2025 & 2033
- Figure 29: South America Offshore Support Vessels Market Revenue Share (%), by Type 2025 & 2033
- Figure 30: South America Offshore Support Vessels Market Volume Share (%), by Type 2025 & 2033
- Figure 31: South America Offshore Support Vessels Market Revenue (billion), by Country 2025 & 2033
- Figure 32: South America Offshore Support Vessels Market Volume (K Unit), by Country 2025 & 2033
- Figure 33: South America Offshore Support Vessels Market Revenue Share (%), by Country 2025 & 2033
- Figure 34: South America Offshore Support Vessels Market Volume Share (%), by Country 2025 & 2033
- Figure 35: Middle East and Africa Offshore Support Vessels Market Revenue (billion), by Type 2025 & 2033
- Figure 36: Middle East and Africa Offshore Support Vessels Market Volume (K Unit), by Type 2025 & 2033
- Figure 37: Middle East and Africa Offshore Support Vessels Market Revenue Share (%), by Type 2025 & 2033
- Figure 38: Middle East and Africa Offshore Support Vessels Market Volume Share (%), by Type 2025 & 2033
- Figure 39: Middle East and Africa Offshore Support Vessels Market Revenue (billion), by Country 2025 & 2033
- Figure 40: Middle East and Africa Offshore Support Vessels Market Volume (K Unit), by Country 2025 & 2033
- Figure 41: Middle East and Africa Offshore Support Vessels Market Revenue Share (%), by Country 2025 & 2033
- Figure 42: Middle East and Africa Offshore Support Vessels Market Volume Share (%), by Country 2025 & 2033
List of Tables
- Table 1: Global Offshore Support Vessels Market Revenue billion Forecast, by Type 2020 & 2033
- Table 2: Global Offshore Support Vessels Market Volume K Unit Forecast, by Type 2020 & 2033
- Table 3: Global Offshore Support Vessels Market Revenue billion Forecast, by Region 2020 & 2033
- Table 4: Global Offshore Support Vessels Market Volume K Unit Forecast, by Region 2020 & 2033
- Table 5: Global Offshore Support Vessels Market Revenue billion Forecast, by Type 2020 & 2033
- Table 6: Global Offshore Support Vessels Market Volume K Unit Forecast, by Type 2020 & 2033
- Table 7: Global Offshore Support Vessels Market Revenue billion Forecast, by Country 2020 & 2033
- Table 8: Global Offshore Support Vessels Market Volume K Unit Forecast, by Country 2020 & 2033
- Table 9: United States Offshore Support Vessels Market Revenue (billion) Forecast, by Application 2020 & 2033
- Table 10: United States Offshore Support Vessels Market Volume (K Unit) Forecast, by Application 2020 & 2033
- Table 11: Canada Offshore Support Vessels Market Revenue (billion) Forecast, by Application 2020 & 2033
- Table 12: Canada Offshore Support Vessels Market Volume (K Unit) Forecast, by Application 2020 & 2033
- Table 13: Rest of North America Offshore Support Vessels Market Revenue (billion) Forecast, by Application 2020 & 2033
- Table 14: Rest of North America Offshore Support Vessels Market Volume (K Unit) Forecast, by Application 2020 & 2033
- Table 15: Global Offshore Support Vessels Market Revenue billion Forecast, by Type 2020 & 2033
- Table 16: Global Offshore Support Vessels Market Volume K Unit Forecast, by Type 2020 & 2033
- Table 17: Global Offshore Support Vessels Market Revenue billion Forecast, by Country 2020 & 2033
- Table 18: Global Offshore Support Vessels Market Volume K Unit Forecast, by Country 2020 & 2033
- Table 19: United Kingdom Offshore Support Vessels Market Revenue (billion) Forecast, by Application 2020 & 2033
- Table 20: United Kingdom Offshore Support Vessels Market Volume (K Unit) Forecast, by Application 2020 & 2033
- Table 21: France Offshore Support Vessels Market Revenue (billion) Forecast, by Application 2020 & 2033
- Table 22: France Offshore Support Vessels Market Volume (K Unit) Forecast, by Application 2020 & 2033
- Table 23: Russia Offshore Support Vessels Market Revenue (billion) Forecast, by Application 2020 & 2033
- Table 24: Russia Offshore Support Vessels Market Volume (K Unit) Forecast, by Application 2020 & 2033
- Table 25: Norway Offshore Support Vessels Market Revenue (billion) Forecast, by Application 2020 & 2033
- Table 26: Norway Offshore Support Vessels Market Volume (K Unit) Forecast, by Application 2020 & 2033
- Table 27: Italy Offshore Support Vessels Market Revenue (billion) Forecast, by Application 2020 & 2033
- Table 28: Italy Offshore Support Vessels Market Volume (K Unit) Forecast, by Application 2020 & 2033
- Table 29: Germany Offshore Support Vessels Market Revenue (billion) Forecast, by Application 2020 & 2033
- Table 30: Germany Offshore Support Vessels Market Volume (K Unit) Forecast, by Application 2020 & 2033
- Table 31: Rest of Europe Offshore Support Vessels Market Revenue (billion) Forecast, by Application 2020 & 2033
- Table 32: Rest of Europe Offshore Support Vessels Market Volume (K Unit) Forecast, by Application 2020 & 2033
- Table 33: Global Offshore Support Vessels Market Revenue billion Forecast, by Type 2020 & 2033
- Table 34: Global Offshore Support Vessels Market Volume K Unit Forecast, by Type 2020 & 2033
- Table 35: Global Offshore Support Vessels Market Revenue billion Forecast, by Country 2020 & 2033
- Table 36: Global Offshore Support Vessels Market Volume K Unit Forecast, by Country 2020 & 2033
- Table 37: China Offshore Support Vessels Market Revenue (billion) Forecast, by Application 2020 & 2033
- Table 38: China Offshore Support Vessels Market Volume (K Unit) Forecast, by Application 2020 & 2033
- Table 39: India Offshore Support Vessels Market Revenue (billion) Forecast, by Application 2020 & 2033
- Table 40: India Offshore Support Vessels Market Volume (K Unit) Forecast, by Application 2020 & 2033
- Table 41: South Korea Offshore Support Vessels Market Revenue (billion) Forecast, by Application 2020 & 2033
- Table 42: South Korea Offshore Support Vessels Market Volume (K Unit) Forecast, by Application 2020 & 2033
- Table 43: Rest of Asia Pacific Offshore Support Vessels Market Revenue (billion) Forecast, by Application 2020 & 2033
- Table 44: Rest of Asia Pacific Offshore Support Vessels Market Volume (K Unit) Forecast, by Application 2020 & 2033
- Table 45: Global Offshore Support Vessels Market Revenue billion Forecast, by Type 2020 & 2033
- Table 46: Global Offshore Support Vessels Market Volume K Unit Forecast, by Type 2020 & 2033
- Table 47: Global Offshore Support Vessels Market Revenue billion Forecast, by Country 2020 & 2033
- Table 48: Global Offshore Support Vessels Market Volume K Unit Forecast, by Country 2020 & 2033
- Table 49: Brazil Offshore Support Vessels Market Revenue (billion) Forecast, by Application 2020 & 2033
- Table 50: Brazil Offshore Support Vessels Market Volume (K Unit) Forecast, by Application 2020 & 2033
- Table 51: Argentina Offshore Support Vessels Market Revenue (billion) Forecast, by Application 2020 & 2033
- Table 52: Argentina Offshore Support Vessels Market Volume (K Unit) Forecast, by Application 2020 & 2033
- Table 53: Rest of South America Offshore Support Vessels Market Revenue (billion) Forecast, by Application 2020 & 2033
- Table 54: Rest of South America Offshore Support Vessels Market Volume (K Unit) Forecast, by Application 2020 & 2033
- Table 55: Global Offshore Support Vessels Market Revenue billion Forecast, by Type 2020 & 2033
- Table 56: Global Offshore Support Vessels Market Volume K Unit Forecast, by Type 2020 & 2033
- Table 57: Global Offshore Support Vessels Market Revenue billion Forecast, by Country 2020 & 2033
- Table 58: Global Offshore Support Vessels Market Volume K Unit Forecast, by Country 2020 & 2033
- Table 59: Saudi Arabia Offshore Support Vessels Market Revenue (billion) Forecast, by Application 2020 & 2033
- Table 60: Saudi Arabia Offshore Support Vessels Market Volume (K Unit) Forecast, by Application 2020 & 2033
- Table 61: Qatar Offshore Support Vessels Market Revenue (billion) Forecast, by Application 2020 & 2033
- Table 62: Qatar Offshore Support Vessels Market Volume (K Unit) Forecast, by Application 2020 & 2033
- Table 63: United Arab Emirates Offshore Support Vessels Market Revenue (billion) Forecast, by Application 2020 & 2033
- Table 64: United Arab Emirates Offshore Support Vessels Market Volume (K Unit) Forecast, by Application 2020 & 2033
- Table 65: Rest of Middle East and Africa Offshore Support Vessels Market Revenue (billion) Forecast, by Application 2020 & 2033
- Table 66: Rest of Middle East and Africa Offshore Support Vessels Market Volume (K Unit) Forecast, by Application 2020 & 2033
Frequently Asked Questions
1. What is the projected Compound Annual Growth Rate (CAGR) of the Offshore Support Vessels Market?
The projected CAGR is approximately 3.2%.
2. Which companies are prominent players in the Offshore Support Vessels Market?
Key companies in the market include Tidewater Inc, Harvey Gulf International Marine LLC, Edison Chouest Offshore LLC, PACC Offshore Services Holdings Ltd *List Not Exhaustive, Solstad Offshore ASA, Maersk Supply Service AS, Seacor Marine Holdings Inc, Swire Pacific Limited, Bourbon Corporation SA, Hornbeck Offshore Services Inc.
3. What are the main segments of the Offshore Support Vessels Market?
The market segments include Type.
4. Can you provide details about the market size?
The market size is estimated to be USD 46.2 billion as of 2022.
5. What are some drivers contributing to market growth?
4.; Increasing Demand for Deepwater Oil and Gas Drilling Operations4.; The Improved Viability of Offshore Oil and Gas Projects.
6. What are the notable trends driving market growth?
Platform Supply Vessels (PSVs) Expected to Dominate the Market.
7. Are there any restraints impacting market growth?
4.; The Volatility in the Prices of Commodities Extracted.
8. Can you provide examples of recent developments in the market?
March 2022: Norway-based Island Offshore was awarded new support vessel contracts worth USD 45.62 million. The contracts include platform supply vessels, anchor handling tug supply (AHTS) vessels, and light well intervention vessels. The contract will be executed this year only.
9. What pricing options are available for accessing the report?
Pricing options include single-user, multi-user, and enterprise licenses priced at USD 4750, USD 5250, and USD 8750 respectively.
10. Is the market size provided in terms of value or volume?
The market size is provided in terms of value, measured in billion and volume, measured in K Unit.
11. Are there any specific market keywords associated with the report?
Yes, the market keyword associated with the report is "Offshore Support Vessels Market," which aids in identifying and referencing the specific market segment covered.
12. How do I determine which pricing option suits my needs best?
The pricing options vary based on user requirements and access needs. Individual users may opt for single-user licenses, while businesses requiring broader access may choose multi-user or enterprise licenses for cost-effective access to the report.
13. Are there any additional resources or data provided in the Offshore Support Vessels Market report?
While the report offers comprehensive insights, it's advisable to review the specific contents or supplementary materials provided to ascertain if additional resources or data are available.
14. How can I stay updated on further developments or reports in the Offshore Support Vessels Market?
To stay informed about further developments, trends, and reports in the Offshore Support Vessels Market, consider subscribing to industry newsletters, following relevant companies and organizations, or regularly checking reputable industry news sources and publications.
Methodology
Step 1 - Identification of Relevant Samples Size from Population Database


Step 2 - Approaches for Defining Global Market Size (Value, Volume* & Price*)

Note*: In applicable scenarios
Step 3 - Data Sources
Primary Research
- Web Analytics
- Survey Reports
- Research Institute
- Latest Research Reports
- Opinion Leaders
Secondary Research
- Annual Reports
- White Paper
- Latest Press Release
- Industry Association
- Paid Database
- Investor Presentations

Step 4 - Data Triangulation
Involves using different sources of information in order to increase the validity of a study
These sources are likely to be stakeholders in a program - participants, other researchers, program staff, other community members, and so on.
Then we put all data in single framework & apply various statistical tools to find out the dynamic on the market.
During the analysis stage, feedback from the stakeholder groups would be compared to determine areas of agreement as well as areas of divergence