

Key Insights
The global online fitness platform market is experiencing robust growth, driven by increasing health consciousness, technological advancements, and the convenience offered by digital fitness solutions. The market's expansion is fueled by the rising adoption of smartphones and wearable technology, which seamlessly integrate with online fitness platforms, providing personalized workout plans, progress tracking, and community engagement features. Furthermore, the COVID-19 pandemic accelerated the shift towards digital fitness, as individuals sought alternatives to traditional gyms and fitness centers. This surge in demand has attracted significant investment and innovation within the sector, leading to a diverse range of platforms catering to various fitness goals and preferences, from yoga and meditation to high-intensity interval training (HIIT) and strength training. The competitive landscape includes established players like Peloton and Beachbody, as well as numerous emerging companies offering niche services and specialized training programs.
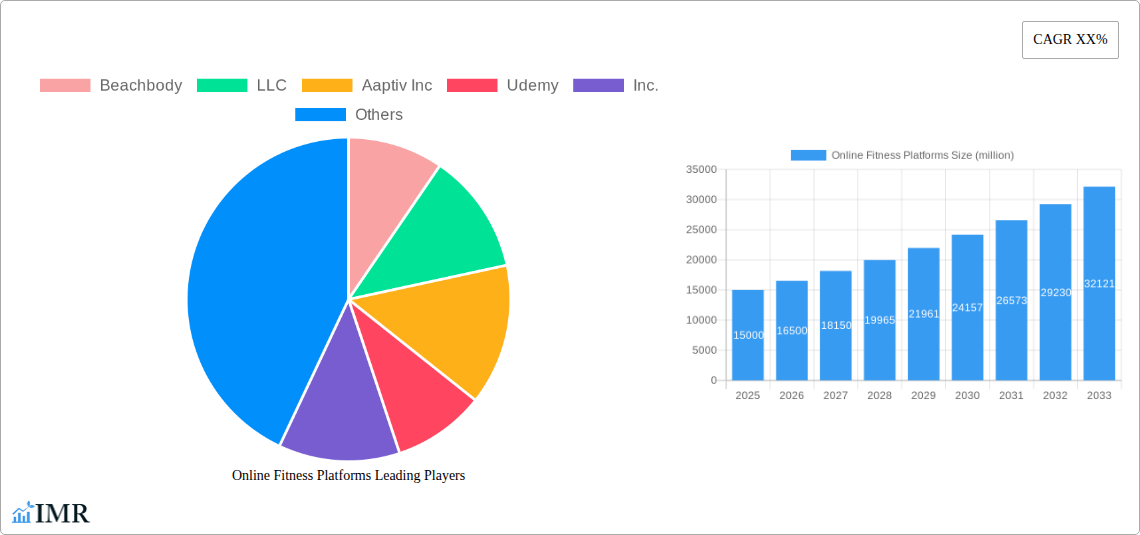
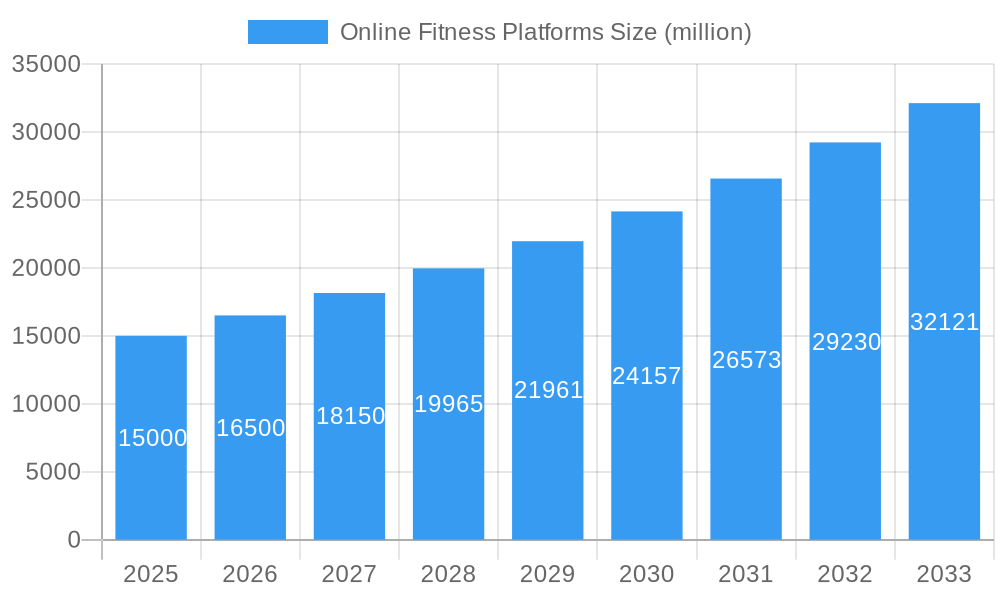
Online Fitness Platforms Market Size (In Billion)
Despite the rapid growth, the market faces certain challenges. Maintaining user engagement and retention is crucial, particularly given the competitive nature of the industry and the availability of free or low-cost alternatives. Ensuring data security and user privacy, while addressing concerns regarding the lack of in-person interaction and potential for injuries associated with unsupervised workouts, are also important considerations. The future of the online fitness platform market hinges on the continued innovation of personalized fitness experiences, the integration of advanced technologies such as AI and VR, and the ability of companies to build strong and supportive online communities. Geographic expansion, particularly into emerging markets with growing internet penetration, presents significant opportunities for market expansion in the coming years. We project continued strong growth, with a focus on premium subscription models and diversified revenue streams.
Online Fitness Platforms Company Market Share
Online Fitness Platforms Market Report: 2019-2033
This comprehensive report provides an in-depth analysis of the Online Fitness Platforms market, encompassing market dynamics, growth trends, regional dominance, product landscapes, and key players. The study period covers 2019-2033, with 2025 as the base and estimated year, and a forecast period of 2025-2033. The historical period analyzed is 2019-2024. This report is invaluable for industry professionals, investors, and anyone seeking to understand the evolving landscape of the online fitness sector. The market is segmented into various categories with the total market size predicted to reach xx million by 2033. The parent market is the broader fitness industry, while the child market includes sub-segments like online workout classes, fitness apps, and virtual personal training.
Online Fitness Platforms Market Dynamics & Structure
This section analyzes the competitive landscape of the online fitness market, examining factors driving growth and shaping its structure. The market is characterized by a mix of established players like Peloton and emerging companies vying for market share. Market concentration is currently moderate, with a few dominant players alongside numerous smaller niche providers. Technological innovation, particularly in areas such as virtual reality (VR) and artificial intelligence (AI)-powered personalized training, is a key driver. Regulatory frameworks related to data privacy and advertising are shaping the market, while competitive substitutes include traditional gyms and in-person fitness classes. End-user demographics are increasingly diverse, with a growing appeal to various age groups and fitness levels. Mergers and acquisitions (M&A) activity is expected to increase as larger players consolidate the market.
- Market Concentration: Moderate, with a few dominant players and many smaller competitors.
- Technological Innovation: VR, AI-powered personalization, gamification are major drivers.
- Regulatory Framework: Data privacy regulations and advertising standards are key considerations.
- Competitive Substitutes: Traditional gyms, in-person fitness classes, and other at-home fitness solutions.
- End-User Demographics: Expanding across age groups and fitness levels.
- M&A Activity: Expected increase in M&A activity, driven by consolidation. Deal volume estimated at xx million in 2024.
Online Fitness Platforms Growth Trends & Insights
The online fitness market has experienced significant growth over the past few years, driven by increasing smartphone penetration, rising health consciousness, and the convenience of at-home workouts. The market size is expected to grow at a Compound Annual Growth Rate (CAGR) of xx% during the forecast period, reaching xx million by 2033. Adoption rates are particularly high among younger demographics and those seeking convenient and cost-effective fitness solutions. Technological disruptions, such as the integration of wearables and personalized fitness plans, are further fueling market expansion. Consumer behavior is shifting towards on-demand fitness content and personalized workout experiences, creating new opportunities for platform providers.
- Market Size (2025): xx million
- Market Size (2033): xx million
- CAGR (2025-2033): xx%
- Market Penetration (2025): xx%
Dominant Regions, Countries, or Segments in Online Fitness Platforms
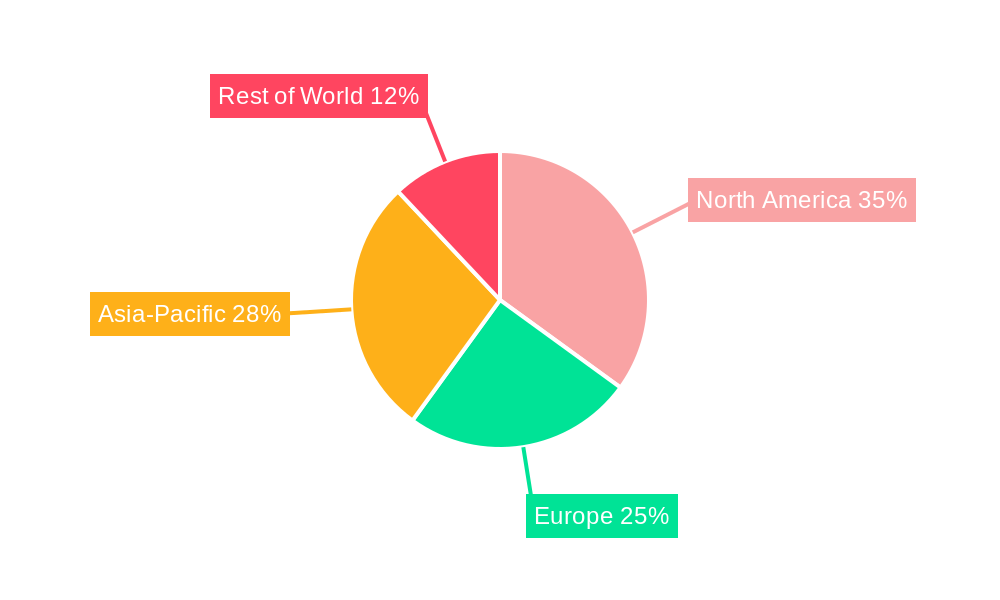
North America and Europe currently dominate the online fitness market, owing to high internet penetration, strong consumer spending power, and established fitness cultures. However, Asia-Pacific is expected to witness significant growth over the forecast period, driven by rising disposable incomes, increasing health awareness, and expanding smartphone usage. Specific countries like the US, China, and the UK are leading the charge, with the US holding the largest market share. This dominance is fueled by factors such as robust technological infrastructure, favorable government policies, and the presence of major players.
- Leading Region: North America
- Leading Countries: US, China, UK
- Key Growth Drivers (Asia-Pacific): Rising disposable incomes, increased health awareness, expanding smartphone penetration.
- Dominance Factors: Technological infrastructure, government support, established players, consumer preferences.
Online Fitness Platforms Product Landscape
The online fitness platform market offers a diverse range of products, from on-demand workout videos and live-streamed classes to personalized training programs and AI-powered fitness tracking apps. These platforms incorporate gamification, social features, and personalized recommendations to enhance user engagement. Technological advancements are constantly driving product innovation, leading to better user experiences and improved fitness outcomes. Unique selling propositions include personalized fitness plans, virtual coaching, and integration with wearable devices.
Key Drivers, Barriers & Challenges in Online Fitness Platforms
Key Drivers:
- Increasing smartphone penetration and internet access
- Rising health awareness and the pursuit of a healthy lifestyle
- Convenience and affordability compared to traditional gyms
- Technological advancements leading to personalized and engaging experiences
Challenges and Restraints:
- Competition: Intense competition from established players and new entrants.
- Data security and privacy: Concerns related to user data security and privacy.
- Lack of face-to-face interaction: Absence of direct interaction with trainers can be a drawback for some users.
- Internet connectivity issues: Access to reliable high-speed internet is crucial for optimal performance.
Emerging Opportunities in Online Fitness Platforms
- Expansion into underserved markets: Targeting emerging economies and demographic segments.
- Integration with virtual and augmented reality: Offering more immersive and interactive fitness experiences.
- Personalized fitness plans powered by AI and machine learning: Providing tailored workouts based on individual needs and goals.
- Development of niche fitness programs: Catering to specific interests and fitness goals.
Growth Accelerators in the Online Fitness Platforms Industry
Strategic partnerships between online fitness platforms and healthcare providers, fitness equipment manufacturers, and wearable technology companies are creating significant growth opportunities. Further technological advancements, such as the incorporation of virtual reality (VR) and augmented reality (AR) technologies, promise to enhance user engagement and create more immersive fitness experiences. Expansion into untapped markets, particularly in developing countries, represents another major growth driver.
Key Players Shaping the Online Fitness Platforms Market
- Beachbody, LLC
- Aaptiv Inc
- Udemy, Inc.
- Peloton Interactive, Inc.
- InstructorLive
- Muscle & Strength, LLC.
- Beijing Calorie Technology Co., Ltd. (Keep)
- Taixing Times Fitness Products Co., Ltd. (Exercise Now)
- Guangzhou Yuepao Information Technology Co., Ltd.
- Chengdu Ledong Information Technology Co., Ltd.
- Xi'an Yule Culture Technology Co., Ltd.
- Beijing HardPay Network Technology Co., Ltd.
- Chengdu Hong Song Culture Communication Co., Ltd. (BONBON FIT)
- Shanghai Qudong Network Technology Co., Ltd.
- Alibaba Group Holdings (Le Power)
Notable Milestones in Online Fitness Platforms Sector
- 2020: Peloton's significant increase in user base during the COVID-19 pandemic.
- 2021: Launch of several new AI-powered fitness apps incorporating personalized workout plans.
- 2022: Increased investment in virtual and augmented reality fitness technologies.
- 2023: Several key acquisitions and partnerships reshape the market landscape.
In-Depth Online Fitness Platforms Market Outlook
The online fitness market is poised for continued strong growth, driven by persistent technological innovation, evolving consumer preferences, and expansion into new markets. Strategic partnerships, investments in personalized fitness solutions, and the adoption of emerging technologies like VR and AR will play a critical role in shaping the future of the industry. The market presents significant opportunities for innovative companies to establish themselves and capture market share.
Online Fitness Platforms Segmentation
-
1. Application
- 1.1. App
- 1.2. Applets
-
2. Types
- 2.1. Yoga
- 2.2. Run
- 2.3. Strength Training
- 2.4. Aerobics
- 2.5. Dance
- 2.6. Other
Online Fitness Platforms Segmentation By Geography
-
1. North America
- 1.1. United States
- 1.2. Canada
- 1.3. Mexico
-
2. South America
- 2.1. Brazil
- 2.2. Argentina
- 2.3. Rest of South America
-
3. Europe
- 3.1. United Kingdom
- 3.2. Germany
- 3.3. France
- 3.4. Italy
- 3.5. Spain
- 3.6. Russia
- 3.7. Benelux
- 3.8. Nordics
- 3.9. Rest of Europe
-
4. Middle East & Africa
- 4.1. Turkey
- 4.2. Israel
- 4.3. GCC
- 4.4. North Africa
- 4.5. South Africa
- 4.6. Rest of Middle East & Africa
-
5. Asia Pacific
- 5.1. China
- 5.2. India
- 5.3. Japan
- 5.4. South Korea
- 5.5. ASEAN
- 5.6. Oceania
- 5.7. Rest of Asia Pacific
Online Fitness Platforms Regional Market Share
Geographic Coverage of Online Fitness Platforms
Online Fitness Platforms REPORT HIGHLIGHTS
| Aspects | Details |
|---|---|
| Study Period | 2020-2034 |
| Base Year | 2025 |
| Estimated Year | 2026 |
| Forecast Period | 2026-2034 |
| Historical Period | 2020-2025 |
| Growth Rate | CAGR of XX% from 2020-2034 |
| Segmentation |
|
Table of Contents
- 1. Introduction
- 1.1. Research Scope
- 1.2. Market Segmentation
- 1.3. Research Objective
- 1.4. Definitions and Assumptions
- 2. Executive Summary
- 2.1. Market Snapshot
- 3. Market Dynamics
- 3.1. Market Drivers
- 3.2. Market Restrains
- 3.3. Market Trends
- 3.4. Market Opportunities
- 4. Market Factor Analysis
- 4.1. Porters Five Forces
- 4.1.1. Bargaining Power of Suppliers
- 4.1.2. Bargaining Power of Buyers
- 4.1.3. Threat of New Entrants
- 4.1.4. Threat of Substitutes
- 4.1.5. Competitive Rivalry
- 4.2. PESTEL analysis
- 4.3. BCG Analysis
- 4.3.1. Stars (High Growth, High Market Share)
- 4.3.2. Cash Cows (Low Growth, High Market Share)
- 4.3.3. Question Mark (High Growth, Low Market Share)
- 4.3.4. Dogs (Low Growth, Low Market Share)
- 4.4. Ansoff Matrix Analysis
- 4.5. Supply Chain Analysis
- 4.6. Regulatory Landscape
- 4.7. Current Market Potential and Opportunity Assessment (TAM–SAM–SOM Framework)
- 4.8. IMR Analyst Note
- 4.1. Porters Five Forces
- 5. Market Analysis, Insights and Forecast 2021-2033
- 5.1. Market Analysis, Insights and Forecast - by Application
- 5.1.1. App
- 5.1.2. Applets
- 5.2. Market Analysis, Insights and Forecast - by Types
- 5.2.1. Yoga
- 5.2.2. Run
- 5.2.3. Strength Training
- 5.2.4. Aerobics
- 5.2.5. Dance
- 5.2.6. Other
- 5.3. Market Analysis, Insights and Forecast - by Region
- 5.3.1. North America
- 5.3.2. South America
- 5.3.3. Europe
- 5.3.4. Middle East & Africa
- 5.3.5. Asia Pacific
- 5.1. Market Analysis, Insights and Forecast - by Application
- 6. Global Online Fitness Platforms Analysis, Insights and Forecast, 2021-2033
- 6.1. Market Analysis, Insights and Forecast - by Application
- 6.1.1. App
- 6.1.2. Applets
- 6.2. Market Analysis, Insights and Forecast - by Types
- 6.2.1. Yoga
- 6.2.2. Run
- 6.2.3. Strength Training
- 6.2.4. Aerobics
- 6.2.5. Dance
- 6.2.6. Other
- 6.1. Market Analysis, Insights and Forecast - by Application
- 7. North America Online Fitness Platforms Analysis, Insights and Forecast, 2020-2032
- 7.1. Market Analysis, Insights and Forecast - by Application
- 7.1.1. App
- 7.1.2. Applets
- 7.2. Market Analysis, Insights and Forecast - by Types
- 7.2.1. Yoga
- 7.2.2. Run
- 7.2.3. Strength Training
- 7.2.4. Aerobics
- 7.2.5. Dance
- 7.2.6. Other
- 7.1. Market Analysis, Insights and Forecast - by Application
- 8. South America Online Fitness Platforms Analysis, Insights and Forecast, 2020-2032
- 8.1. Market Analysis, Insights and Forecast - by Application
- 8.1.1. App
- 8.1.2. Applets
- 8.2. Market Analysis, Insights and Forecast - by Types
- 8.2.1. Yoga
- 8.2.2. Run
- 8.2.3. Strength Training
- 8.2.4. Aerobics
- 8.2.5. Dance
- 8.2.6. Other
- 8.1. Market Analysis, Insights and Forecast - by Application
- 9. Europe Online Fitness Platforms Analysis, Insights and Forecast, 2020-2032
- 9.1. Market Analysis, Insights and Forecast - by Application
- 9.1.1. App
- 9.1.2. Applets
- 9.2. Market Analysis, Insights and Forecast - by Types
- 9.2.1. Yoga
- 9.2.2. Run
- 9.2.3. Strength Training
- 9.2.4. Aerobics
- 9.2.5. Dance
- 9.2.6. Other
- 9.1. Market Analysis, Insights and Forecast - by Application
- 10. Middle East & Africa Online Fitness Platforms Analysis, Insights and Forecast, 2020-2032
- 10.1. Market Analysis, Insights and Forecast - by Application
- 10.1.1. App
- 10.1.2. Applets
- 10.2. Market Analysis, Insights and Forecast - by Types
- 10.2.1. Yoga
- 10.2.2. Run
- 10.2.3. Strength Training
- 10.2.4. Aerobics
- 10.2.5. Dance
- 10.2.6. Other
- 10.1. Market Analysis, Insights and Forecast - by Application
- 11. Asia Pacific Online Fitness Platforms Analysis, Insights and Forecast, 2020-2032
- 11.1. Market Analysis, Insights and Forecast - by Application
- 11.1.1. App
- 11.1.2. Applets
- 11.2. Market Analysis, Insights and Forecast - by Types
- 11.2.1. Yoga
- 11.2.2. Run
- 11.2.3. Strength Training
- 11.2.4. Aerobics
- 11.2.5. Dance
- 11.2.6. Other
- 11.1. Market Analysis, Insights and Forecast - by Application
- 12. Competitive Analysis
- 12.1. Company Profiles
- 12.1.1 Beachbody
- 12.1.1.1. Company Overview
- 12.1.1.2. Products
- 12.1.1.3. Company Financials
- 12.1.1.4. SWOT Analysis
- 12.1.2 LLC
- 12.1.2.1. Company Overview
- 12.1.2.2. Products
- 12.1.2.3. Company Financials
- 12.1.2.4. SWOT Analysis
- 12.1.3 Aaptiv Inc
- 12.1.3.1. Company Overview
- 12.1.3.2. Products
- 12.1.3.3. Company Financials
- 12.1.3.4. SWOT Analysis
- 12.1.4 Udemy
- 12.1.4.1. Company Overview
- 12.1.4.2. Products
- 12.1.4.3. Company Financials
- 12.1.4.4. SWOT Analysis
- 12.1.5 Inc.
- 12.1.5.1. Company Overview
- 12.1.5.2. Products
- 12.1.5.3. Company Financials
- 12.1.5.4. SWOT Analysis
- 12.1.6 Peloton Interactive
- 12.1.6.1. Company Overview
- 12.1.6.2. Products
- 12.1.6.3. Company Financials
- 12.1.6.4. SWOT Analysis
- 12.1.7 Inc.
- 12.1.7.1. Company Overview
- 12.1.7.2. Products
- 12.1.7.3. Company Financials
- 12.1.7.4. SWOT Analysis
- 12.1.8 InstructorLive
- 12.1.8.1. Company Overview
- 12.1.8.2. Products
- 12.1.8.3. Company Financials
- 12.1.8.4. SWOT Analysis
- 12.1.9 Muscle & Strength
- 12.1.9.1. Company Overview
- 12.1.9.2. Products
- 12.1.9.3. Company Financials
- 12.1.9.4. SWOT Analysis
- 12.1.10 LLC.
- 12.1.10.1. Company Overview
- 12.1.10.2. Products
- 12.1.10.3. Company Financials
- 12.1.10.4. SWOT Analysis
- 12.1.11 Beijing Calorie Technology Co.
- 12.1.11.1. Company Overview
- 12.1.11.2. Products
- 12.1.11.3. Company Financials
- 12.1.11.4. SWOT Analysis
- 12.1.12 Ltd. (Keep)
- 12.1.12.1. Company Overview
- 12.1.12.2. Products
- 12.1.12.3. Company Financials
- 12.1.12.4. SWOT Analysis
- 12.1.13 Taixing Times Fitness Products Co.
- 12.1.13.1. Company Overview
- 12.1.13.2. Products
- 12.1.13.3. Company Financials
- 12.1.13.4. SWOT Analysis
- 12.1.14 Ltd. (Exercise Now)
- 12.1.14.1. Company Overview
- 12.1.14.2. Products
- 12.1.14.3. Company Financials
- 12.1.14.4. SWOT Analysis
- 12.1.15 Guangzhou Yuepao Information Technology Co.
- 12.1.15.1. Company Overview
- 12.1.15.2. Products
- 12.1.15.3. Company Financials
- 12.1.15.4. SWOT Analysis
- 12.1.16 Ltd.
- 12.1.16.1. Company Overview
- 12.1.16.2. Products
- 12.1.16.3. Company Financials
- 12.1.16.4. SWOT Analysis
- 12.1.17 Chengdu Ledong Information Technology Co.
- 12.1.17.1. Company Overview
- 12.1.17.2. Products
- 12.1.17.3. Company Financials
- 12.1.17.4. SWOT Analysis
- 12.1.18 Ltd.
- 12.1.18.1. Company Overview
- 12.1.18.2. Products
- 12.1.18.3. Company Financials
- 12.1.18.4. SWOT Analysis
- 12.1.19 Xi'an Yule Culture Technology Co.
- 12.1.19.1. Company Overview
- 12.1.19.2. Products
- 12.1.19.3. Company Financials
- 12.1.19.4. SWOT Analysis
- 12.1.20 Ltd.
- 12.1.20.1. Company Overview
- 12.1.20.2. Products
- 12.1.20.3. Company Financials
- 12.1.20.4. SWOT Analysis
- 12.1.21 Beijing HardPay Network Technology Co.
- 12.1.21.1. Company Overview
- 12.1.21.2. Products
- 12.1.21.3. Company Financials
- 12.1.21.4. SWOT Analysis
- 12.1.22 Ltd.
- 12.1.22.1. Company Overview
- 12.1.22.2. Products
- 12.1.22.3. Company Financials
- 12.1.22.4. SWOT Analysis
- 12.1.23 Chengdu Hong Song Culture Communication Co.
- 12.1.23.1. Company Overview
- 12.1.23.2. Products
- 12.1.23.3. Company Financials
- 12.1.23.4. SWOT Analysis
- 12.1.24 Ltd. (BONBON FIT)
- 12.1.24.1. Company Overview
- 12.1.24.2. Products
- 12.1.24.3. Company Financials
- 12.1.24.4. SWOT Analysis
- 12.1.25 Shanghai Qudong Network Technology Co.
- 12.1.25.1. Company Overview
- 12.1.25.2. Products
- 12.1.25.3. Company Financials
- 12.1.25.4. SWOT Analysis
- 12.1.26 Ltd.
- 12.1.26.1. Company Overview
- 12.1.26.2. Products
- 12.1.26.3. Company Financials
- 12.1.26.4. SWOT Analysis
- 12.1.27 Alibaba Group Holdings (Le Power)
- 12.1.27.1. Company Overview
- 12.1.27.2. Products
- 12.1.27.3. Company Financials
- 12.1.27.4. SWOT Analysis
- 12.1.1 Beachbody
- 12.2. Market Entropy
- 12.2.1 Company's Key Areas Served
- 12.2.2 Recent Developments
- 12.3. Company Market Share Analysis 2025
- 12.3.1 Top 5 Companies Market Share Analysis
- 12.3.2 Top 3 Companies Market Share Analysis
- 12.4. List of Potential Customers
- 13. Research Methodology
List of Figures
- Figure 1: Global Online Fitness Platforms Revenue Breakdown (million, %) by Region 2025 & 2033
- Figure 2: North America Online Fitness Platforms Revenue (million), by Application 2025 & 2033
- Figure 3: North America Online Fitness Platforms Revenue Share (%), by Application 2025 & 2033
- Figure 4: North America Online Fitness Platforms Revenue (million), by Types 2025 & 2033
- Figure 5: North America Online Fitness Platforms Revenue Share (%), by Types 2025 & 2033
- Figure 6: North America Online Fitness Platforms Revenue (million), by Country 2025 & 2033
- Figure 7: North America Online Fitness Platforms Revenue Share (%), by Country 2025 & 2033
- Figure 8: South America Online Fitness Platforms Revenue (million), by Application 2025 & 2033
- Figure 9: South America Online Fitness Platforms Revenue Share (%), by Application 2025 & 2033
- Figure 10: South America Online Fitness Platforms Revenue (million), by Types 2025 & 2033
- Figure 11: South America Online Fitness Platforms Revenue Share (%), by Types 2025 & 2033
- Figure 12: South America Online Fitness Platforms Revenue (million), by Country 2025 & 2033
- Figure 13: South America Online Fitness Platforms Revenue Share (%), by Country 2025 & 2033
- Figure 14: Europe Online Fitness Platforms Revenue (million), by Application 2025 & 2033
- Figure 15: Europe Online Fitness Platforms Revenue Share (%), by Application 2025 & 2033
- Figure 16: Europe Online Fitness Platforms Revenue (million), by Types 2025 & 2033
- Figure 17: Europe Online Fitness Platforms Revenue Share (%), by Types 2025 & 2033
- Figure 18: Europe Online Fitness Platforms Revenue (million), by Country 2025 & 2033
- Figure 19: Europe Online Fitness Platforms Revenue Share (%), by Country 2025 & 2033
- Figure 20: Middle East & Africa Online Fitness Platforms Revenue (million), by Application 2025 & 2033
- Figure 21: Middle East & Africa Online Fitness Platforms Revenue Share (%), by Application 2025 & 2033
- Figure 22: Middle East & Africa Online Fitness Platforms Revenue (million), by Types 2025 & 2033
- Figure 23: Middle East & Africa Online Fitness Platforms Revenue Share (%), by Types 2025 & 2033
- Figure 24: Middle East & Africa Online Fitness Platforms Revenue (million), by Country 2025 & 2033
- Figure 25: Middle East & Africa Online Fitness Platforms Revenue Share (%), by Country 2025 & 2033
- Figure 26: Asia Pacific Online Fitness Platforms Revenue (million), by Application 2025 & 2033
- Figure 27: Asia Pacific Online Fitness Platforms Revenue Share (%), by Application 2025 & 2033
- Figure 28: Asia Pacific Online Fitness Platforms Revenue (million), by Types 2025 & 2033
- Figure 29: Asia Pacific Online Fitness Platforms Revenue Share (%), by Types 2025 & 2033
- Figure 30: Asia Pacific Online Fitness Platforms Revenue (million), by Country 2025 & 2033
- Figure 31: Asia Pacific Online Fitness Platforms Revenue Share (%), by Country 2025 & 2033
List of Tables
- Table 1: Global Online Fitness Platforms Revenue million Forecast, by Application 2020 & 2033
- Table 2: Global Online Fitness Platforms Revenue million Forecast, by Types 2020 & 2033
- Table 3: Global Online Fitness Platforms Revenue million Forecast, by Region 2020 & 2033
- Table 4: Global Online Fitness Platforms Revenue million Forecast, by Application 2020 & 2033
- Table 5: Global Online Fitness Platforms Revenue million Forecast, by Types 2020 & 2033
- Table 6: Global Online Fitness Platforms Revenue million Forecast, by Country 2020 & 2033
- Table 7: United States Online Fitness Platforms Revenue (million) Forecast, by Application 2020 & 2033
- Table 8: Canada Online Fitness Platforms Revenue (million) Forecast, by Application 2020 & 2033
- Table 9: Mexico Online Fitness Platforms Revenue (million) Forecast, by Application 2020 & 2033
- Table 10: Global Online Fitness Platforms Revenue million Forecast, by Application 2020 & 2033
- Table 11: Global Online Fitness Platforms Revenue million Forecast, by Types 2020 & 2033
- Table 12: Global Online Fitness Platforms Revenue million Forecast, by Country 2020 & 2033
- Table 13: Brazil Online Fitness Platforms Revenue (million) Forecast, by Application 2020 & 2033
- Table 14: Argentina Online Fitness Platforms Revenue (million) Forecast, by Application 2020 & 2033
- Table 15: Rest of South America Online Fitness Platforms Revenue (million) Forecast, by Application 2020 & 2033
- Table 16: Global Online Fitness Platforms Revenue million Forecast, by Application 2020 & 2033
- Table 17: Global Online Fitness Platforms Revenue million Forecast, by Types 2020 & 2033
- Table 18: Global Online Fitness Platforms Revenue million Forecast, by Country 2020 & 2033
- Table 19: United Kingdom Online Fitness Platforms Revenue (million) Forecast, by Application 2020 & 2033
- Table 20: Germany Online Fitness Platforms Revenue (million) Forecast, by Application 2020 & 2033
- Table 21: France Online Fitness Platforms Revenue (million) Forecast, by Application 2020 & 2033
- Table 22: Italy Online Fitness Platforms Revenue (million) Forecast, by Application 2020 & 2033
- Table 23: Spain Online Fitness Platforms Revenue (million) Forecast, by Application 2020 & 2033
- Table 24: Russia Online Fitness Platforms Revenue (million) Forecast, by Application 2020 & 2033
- Table 25: Benelux Online Fitness Platforms Revenue (million) Forecast, by Application 2020 & 2033
- Table 26: Nordics Online Fitness Platforms Revenue (million) Forecast, by Application 2020 & 2033
- Table 27: Rest of Europe Online Fitness Platforms Revenue (million) Forecast, by Application 2020 & 2033
- Table 28: Global Online Fitness Platforms Revenue million Forecast, by Application 2020 & 2033
- Table 29: Global Online Fitness Platforms Revenue million Forecast, by Types 2020 & 2033
- Table 30: Global Online Fitness Platforms Revenue million Forecast, by Country 2020 & 2033
- Table 31: Turkey Online Fitness Platforms Revenue (million) Forecast, by Application 2020 & 2033
- Table 32: Israel Online Fitness Platforms Revenue (million) Forecast, by Application 2020 & 2033
- Table 33: GCC Online Fitness Platforms Revenue (million) Forecast, by Application 2020 & 2033
- Table 34: North Africa Online Fitness Platforms Revenue (million) Forecast, by Application 2020 & 2033
- Table 35: South Africa Online Fitness Platforms Revenue (million) Forecast, by Application 2020 & 2033
- Table 36: Rest of Middle East & Africa Online Fitness Platforms Revenue (million) Forecast, by Application 2020 & 2033
- Table 37: Global Online Fitness Platforms Revenue million Forecast, by Application 2020 & 2033
- Table 38: Global Online Fitness Platforms Revenue million Forecast, by Types 2020 & 2033
- Table 39: Global Online Fitness Platforms Revenue million Forecast, by Country 2020 & 2033
- Table 40: China Online Fitness Platforms Revenue (million) Forecast, by Application 2020 & 2033
- Table 41: India Online Fitness Platforms Revenue (million) Forecast, by Application 2020 & 2033
- Table 42: Japan Online Fitness Platforms Revenue (million) Forecast, by Application 2020 & 2033
- Table 43: South Korea Online Fitness Platforms Revenue (million) Forecast, by Application 2020 & 2033
- Table 44: ASEAN Online Fitness Platforms Revenue (million) Forecast, by Application 2020 & 2033
- Table 45: Oceania Online Fitness Platforms Revenue (million) Forecast, by Application 2020 & 2033
- Table 46: Rest of Asia Pacific Online Fitness Platforms Revenue (million) Forecast, by Application 2020 & 2033
Frequently Asked Questions
1. What is the projected Compound Annual Growth Rate (CAGR) of the Online Fitness Platforms?
The projected CAGR is approximately XX%.
2. Which companies are prominent players in the Online Fitness Platforms?
Key companies in the market include Beachbody, LLC, Aaptiv Inc, Udemy, Inc., Peloton Interactive, Inc., InstructorLive, Muscle & Strength, LLC., Beijing Calorie Technology Co., Ltd. (Keep), Taixing Times Fitness Products Co., Ltd. (Exercise Now), Guangzhou Yuepao Information Technology Co., Ltd., Chengdu Ledong Information Technology Co., Ltd., Xi'an Yule Culture Technology Co., Ltd., Beijing HardPay Network Technology Co., Ltd., Chengdu Hong Song Culture Communication Co., Ltd. (BONBON FIT), Shanghai Qudong Network Technology Co., Ltd., Alibaba Group Holdings (Le Power).
3. What are the main segments of the Online Fitness Platforms?
The market segments include Application, Types.
4. Can you provide details about the market size?
The market size is estimated to be USD XXX million as of 2022.
5. What are some drivers contributing to market growth?
N/A
6. What are the notable trends driving market growth?
N/A
7. Are there any restraints impacting market growth?
N/A
8. Can you provide examples of recent developments in the market?
N/A
9. What pricing options are available for accessing the report?
Pricing options include single-user, multi-user, and enterprise licenses priced at USD 3350.00, USD 5025.00, and USD 6700.00 respectively.
10. Is the market size provided in terms of value or volume?
The market size is provided in terms of value, measured in million.
11. Are there any specific market keywords associated with the report?
Yes, the market keyword associated with the report is "Online Fitness Platforms," which aids in identifying and referencing the specific market segment covered.
12. How do I determine which pricing option suits my needs best?
The pricing options vary based on user requirements and access needs. Individual users may opt for single-user licenses, while businesses requiring broader access may choose multi-user or enterprise licenses for cost-effective access to the report.
13. Are there any additional resources or data provided in the Online Fitness Platforms report?
While the report offers comprehensive insights, it's advisable to review the specific contents or supplementary materials provided to ascertain if additional resources or data are available.
14. How can I stay updated on further developments or reports in the Online Fitness Platforms?
To stay informed about further developments, trends, and reports in the Online Fitness Platforms, consider subscribing to industry newsletters, following relevant companies and organizations, or regularly checking reputable industry news sources and publications.
Methodology
Step 1 - Identification of Relevant Samples Size from Population Database


Step 2 - Approaches for Defining Global Market Size (Value, Volume* & Price*)

Note*: In applicable scenarios
Step 3 - Data Sources
Primary Research
- Web Analytics
- Survey Reports
- Research Institute
- Latest Research Reports
- Opinion Leaders
Secondary Research
- Annual Reports
- White Paper
- Latest Press Release
- Industry Association
- Paid Database
- Investor Presentations

Step 4 - Data Triangulation
Involves using different sources of information in order to increase the validity of a study
These sources are likely to be stakeholders in a program - participants, other researchers, program staff, other community members, and so on.
Then we put all data in single framework & apply various statistical tools to find out the dynamic on the market.
During the analysis stage, feedback from the stakeholder groups would be compared to determine areas of agreement as well as areas of divergence