

Key Insights
The global organic honey market is poised for significant expansion, projected to reach USD 990.9 million by 2025, driven by a compelling CAGR of 7.8% from 2019 to 2033. This robust growth is fueled by a growing consumer consciousness towards health and wellness, leading to an increased demand for natural and pesticide-free food products. The inherent nutritional benefits and perceived purity of organic honey make it a preferred choice over conventional alternatives. Key market drivers include rising disposable incomes, particularly in emerging economies, which allows consumers to opt for premium and healthier food options. Furthermore, evolving dietary trends favoring natural sweeteners and the increasing prevalence of food allergies and intolerances are also bolstering the market. The expanding e-commerce landscape is further facilitating accessibility to a wider range of organic honey products, catering to niche preferences and expanding the market's reach globally.

Organic Honey Market Size (In Million)
The market segmentation reveals diverse consumer preferences and applications. In terms of packaging, both Glass Jars and Plastic Containers hold significant market share, reflecting varying consumer needs for storage, portability, and sustainability. By type, Mixed Organic Honey and Manuka Organic Honey are anticipated to dominate, with Manuka honey garnering special attention due to its unique medicinal properties and premium pricing. Clover Organic Honey and Other Organic Honey varieties also contribute to market diversity. Geographically, North America and Europe are expected to remain dominant regions, owing to established health trends and a mature consumer base. However, the Asia Pacific region is poised for substantial growth, driven by increasing awareness and adoption of organic products. Restraints such as fluctuating raw material availability due to environmental factors and the potential for adulteration in the wider honey market are challenges that industry players are actively addressing through stringent quality control and certifications.

Organic Honey Company Market Share
Unlocking the Sweet Potential: A Comprehensive Report on the Global Organic Honey Market
This in-depth report provides a granular analysis of the global organic honey market, offering actionable insights for industry stakeholders. Spanning from 2019 to 2033, with a base and estimated year of 2025 and a forecast period of 2025–2033, this study delves into market dynamics, growth trends, regional dominance, product innovation, and the strategic landscape. We dissect key drivers, barriers, and emerging opportunities, empowering businesses to navigate this evolving sector and capitalize on its substantial growth potential.
Organic Honey Market Dynamics & Structure
The global organic honey market, currently valued at xx million units in 2025, exhibits a moderately concentrated structure. Major players like Dutch Gold, Nature Nate’s, Rowse, Barkman Honey, Langnese, Little Bee Impex, GloryBee, Madhava Honey, Sue Bee, Y.S. Organic Bee Farms, Conscious Food, Heavenly Organics, Comvita, and Manuka Health collectively hold a significant market share, indicating robust competition. Technological innovation is primarily driven by advancements in sustainable beekeeping practices, improved extraction and processing techniques to preserve honey's natural properties, and sophisticated traceability systems ensuring organic certification. Regulatory frameworks, while crucial for maintaining organic integrity and consumer trust, can also present barriers to entry for smaller producers. Competitive product substitutes, such as artificial sweeteners and other natural sweeteners, pose a constant challenge, although the perceived health benefits and natural origin of organic honey differentiate it. End-user demographics reveal a growing segment of health-conscious consumers, millennials, and individuals seeking premium, ethically sourced food products. Mergers and acquisitions (M&A) have been a notable trend, with xx M&A deals valued at xx million units recorded in the historical period (2019-2024), indicating consolidation and strategic expansion by key players.
- Market Concentration: Moderately concentrated, with key players dominating market share.
- Technological Innovation Drivers: Sustainable beekeeping, advanced processing, traceability systems.
- Regulatory Frameworks: Crucial for organic integrity; can pose entry barriers.
- Competitive Product Substitutes: Artificial sweeteners, other natural sweeteners.
- End-User Demographics: Health-conscious consumers, millennials, premium product seekers.
- M&A Trends: Active consolidation, xx deals valued at xx million units historically.
Organic Honey Growth Trends & Insights
The global organic honey market is poised for significant expansion, projected to grow at a Compound Annual Growth Rate (CAGR) of xx% during the forecast period (2025–2033). In the base year 2025, the market is estimated at xx million units, a testament to its steady historical growth from xx million units in 2019. This upward trajectory is fueled by an escalating consumer demand for natural, healthy, and sustainably produced food items. Adoption rates for organic honey are increasing across both developed and emerging economies, driven by greater awareness of its purported health benefits, including its antioxidant properties and natural antibacterial qualities. Technological disruptions, while not as rapid as in some other food sectors, are subtly reshaping the industry through advancements in apiculture technology that enhance bee health and productivity, and improved cold-chain logistics for preserving honey quality. Consumer behavior shifts are pivotal, with a growing preference for transparency and traceability in food sourcing, leading consumers to actively seek out certified organic products. The market penetration of organic honey, currently at xx%, is expected to rise substantially as more consumers integrate it into their daily diets for its culinary and wellness applications. The parent market for honey, valued at xx billion units in 2025, provides a vast playground for the niche but rapidly growing organic segment. The child market, specifically within functional foods and natural sweeteners, is also exhibiting strong growth, further bolstering the prospects of organic honey.
- Market Size Evolution: Projected CAGR of xx% (2025–2033).
- Historical Growth: From xx million units (2019) to xx million units (2025).
- Adoption Rates: Increasing across developed and emerging economies.
- Technological Disruptions: Enhancements in apiculture technology and logistics.
- Consumer Behavior Shifts: Demand for transparency, traceability, and natural products.
- Market Penetration: Expected to rise from xx% to reach xx% by 2033.
- Parent Market Context: Organic honey is a growing segment within the xx billion units honey market.
- Child Market Linkages: Strong growth in functional foods and natural sweeteners.
Dominant Regions, Countries, or Segments in Organic Honey
The Type: Manuka Organic Honey segment is emerging as a significant growth driver within the global organic honey market, demonstrating remarkable dominance in terms of both current market share and projected growth potential. In 2025, this segment alone is estimated to account for xx million units, representing xx% of the total organic honey market. The dominance of Manuka organic honey is underpinned by its unique UMF (Unique Manuka Factor) grading system, which signifies its potent antibacterial and therapeutic properties, making it a sought-after product for health and wellness enthusiasts. The primary growth drivers for this segment include robust economic policies in countries like New Zealand and Australia that support beekeeping and export, coupled with well-established infrastructure for processing and distribution of high-value honey products. Furthermore, the increasing global awareness and marketing efforts highlighting the distinct health benefits of Manuka honey have significantly amplified its appeal.
The Application: Glass Jar segment also plays a crucial role in market dominance, accounting for xx million units in 2025. Glass jars are preferred by consumers for their premium perception, inertness, and reusability, aligning with the values of the organic consumer. This segment's growth potential is linked to the overall demand for high-quality, artisanal food products and the desire for aesthetically pleasing packaging.
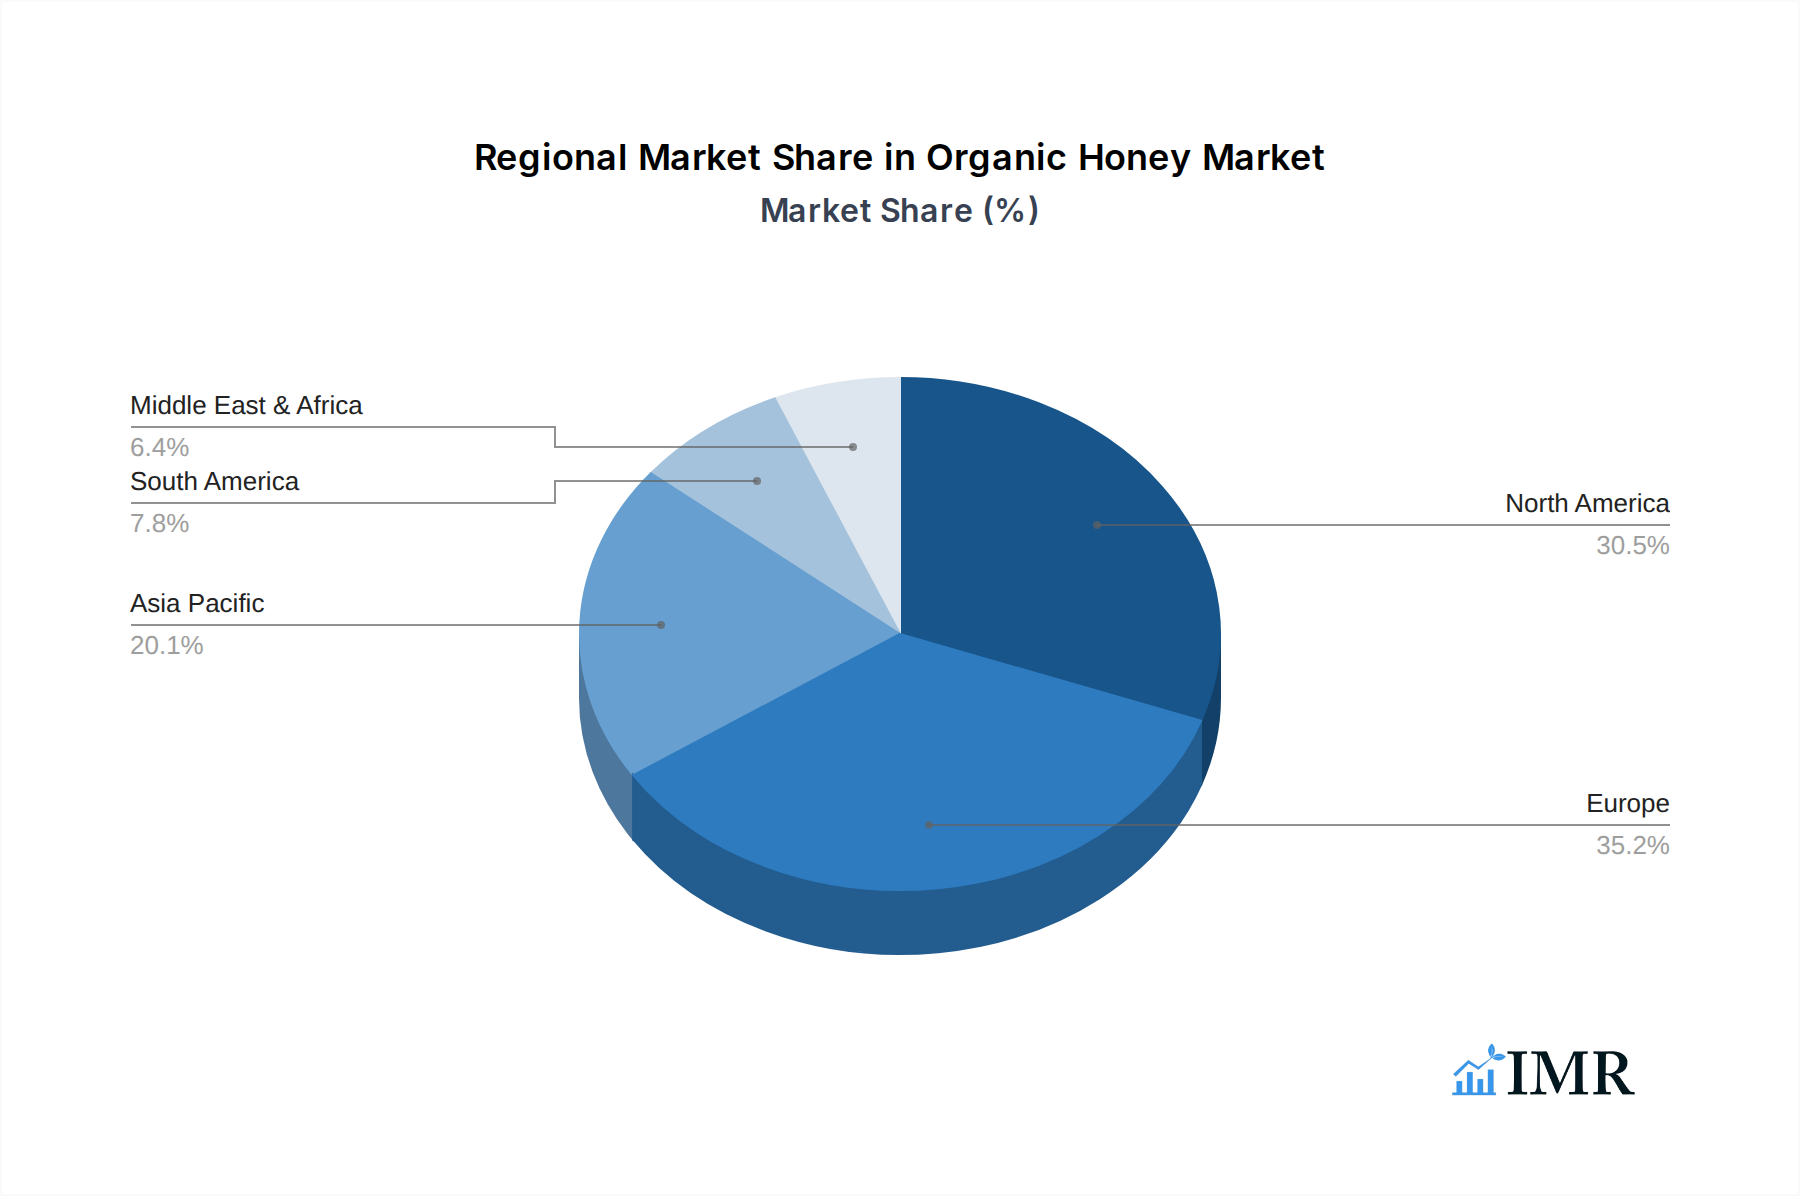
Geographically, North America and Europe currently lead the organic honey market, with the United States and Germany, respectively, being key individual country markets. The market share for North America is estimated at xx% in 2025, with the US alone contributing xx million units. Europe follows closely with xx% market share, driven by Germany's xx million units contribution. These regions boast a higher disposable income, a more established organic food culture, and stringent organic certification standards, which collectively foster higher consumption of organic honey.
- Dominant Segment (Type): Manuka Organic Honey (estimated xx million units in 2025, xx% market share).
- Key Drivers: Unique UMF grading, recognized therapeutic properties, health and wellness appeal.
- Growth Potential: High, driven by specialized health benefits and premium positioning.
- Dominant Segment (Application): Glass Jar (estimated xx million units in 2025).
- Key Drivers: Premium perception, inertness, reusability, aesthetic appeal.
- Growth Potential: Strong, linked to demand for artisanal and high-quality food products.
- Leading Regions: North America (xx% market share in 2025) and Europe (xx% market share in 2025).
- Dominance Factors: High disposable income, established organic food culture, stringent certification standards.
- Key Countries: United States (xx million units in 2025) and Germany (xx million units in 2025).
- Economic Policies: Supportive for beekeeping and export in producing nations.
- Infrastructure: Well-developed for processing and distribution.
Organic Honey Product Landscape
The organic honey product landscape is characterized by continuous innovation focused on enhancing purity, potency, and consumer experience. Mixed Organic Honey varieties continue to offer a broad appeal, blending flavors from various floral sources to create unique taste profiles valued by a wide consumer base. Clover Organic Honey remains a staple due to its mild flavor and widespread availability. However, the real excitement lies in the evolution of Manuka Organic Honey, with advancements in UMF grading technology and targeted applications for skincare and medicinal use. Innovations also extend to packaging, with a growing emphasis on eco-friendly Plastic Containers that are recyclable and biodegradable, alongside the traditional Glass Jar options. Performance metrics are increasingly scrutinized, with consumers and industry bodies focusing on parameters like enzymatic activity, pollen analysis, and absence of pesticides to validate organic claims and therapeutic efficacy. Unique selling propositions often revolve around specific floral sources, single-origin traceability, and artisanal production methods, distinguishing brands in a competitive market. Technological advancements are subtly improving honey’s shelf life and nutrient retention through gentler processing techniques.
Key Drivers, Barriers & Challenges in Organic Honey
The organic honey industry is propelled by several key drivers, primarily the surging global demand for natural and healthy food alternatives. Growing consumer awareness regarding the health benefits of organic honey, coupled with increasing disposable incomes, fuels its adoption. Technological advancements in sustainable beekeeping and traceability solutions further bolster market growth. Furthermore, favorable government initiatives and certifications promoting organic agriculture contribute significantly.
However, the sector faces substantial barriers and challenges. Supply chain disruptions, often exacerbated by climate change and declining bee populations, pose a significant threat to raw material availability. Stringent and varied organic certification processes across different regions can be a regulatory hurdle, increasing compliance costs. Competitive pricing pressure from conventional honey and other sweeteners also remains a considerable restraint. Lastly, the risk of adulteration and mislabeling in the honey market, while not exclusive to organic products, can erode consumer trust.
- Key Drivers:
- Growing demand for natural and healthy food.
- Increased consumer awareness of health benefits.
- Rising disposable incomes.
- Technological advancements in beekeeping and traceability.
- Supportive government policies and certifications.
- Barriers & Challenges:
- Supply chain disruptions due to climate change and bee population decline.
- Complex and varied organic certification processes.
- Price competition from conventional honey and sweeteners.
- Risk of adulteration and mislabeling impacting consumer trust.
Emerging Opportunities in Organic Honey
Emerging opportunities in the organic honey market are abundant, driven by evolving consumer preferences and untapped market potential. The growing demand for functional foods presents a significant avenue, with organic honey being incorporated into beverages, supplements, and wellness products for its inherent health properties. Untapped markets in developing economies, where awareness of organic products is on the rise, offer substantial growth prospects. Furthermore, innovative applications in the cosmetic and pharmaceutical industries, leveraging honey's antibacterial and moisturizing qualities, are beginning to gain traction. The development of specialized organic honeys with distinct flavor profiles and therapeutic benefits, catering to niche consumer segments, also represents a burgeoning opportunity.
- Functional Foods Integration: Incorporating organic honey into beverages, supplements, and wellness products.
- Untapped Markets: Expansion into emerging economies with growing organic awareness.
- Cosmetic and Pharmaceutical Applications: Leveraging honey's inherent health properties.
- Niche Product Development: Creating specialized organic honeys with unique flavor and therapeutic profiles.
Growth Accelerators in the Organic Honey Industry
Several catalysts are accelerating growth in the organic honey industry. Technological breakthroughs in sustainable beekeeping, such as precision beekeeping and bee health monitoring systems, are enhancing honey yields and quality. Strategic partnerships between organic honey producers, retailers, and health and wellness brands are expanding market reach and consumer engagement. Market expansion strategies, including targeted marketing campaigns highlighting the unique selling propositions of organic honey and its benefits, are proving highly effective. The increasing emphasis on ethical sourcing and environmental sustainability within the food industry also acts as a significant growth accelerator, resonating with a growing segment of conscious consumers.
Key Players Shaping the Organic Honey Market
- Dutch Gold
- Nature Nate’s
- Rowse
- Barkman Honey
- Langnese
- Little Bee Impex
- GloryBee
- Madhava Honey
- Sue Bee
- Y.S. Organic Bee Farms
- Conscious Food
- Heavenly Organics
- Comvita
- Manuka Health
Notable Milestones in Organic Honey Sector
- 2019/05: Launch of innovative traceability platform by [Company Name], enhancing consumer confidence in organic origin.
- 2020/11: Significant increase in M&A activity, with [Company Name] acquiring [Company Name] to expand its organic honey portfolio.
- 2021/07: Introduction of new sustainable packaging solutions by [Company Name], reducing environmental impact.
- 2022/03: Release of comprehensive studies on the health benefits of Manuka organic honey, driving consumer interest and demand.
- 2023/09: Implementation of advanced bee health monitoring technologies by [Company Name], leading to improved honey quality and yield.
- 2024/02: Expansion of organic honey product lines into functional food categories by major players, broadening application scope.
In-Depth Organic Honey Market Outlook
The future outlook for the organic honey market is exceptionally bright, fueled by an enduring consumer pursuit of health, wellness, and sustainable consumption. Growth accelerators such as technological innovations in apiculture, strategic collaborations, and expanding market reach will continue to drive expansion. The increasing integration of organic honey into functional foods and beverages, alongside its growing adoption in niche cosmetic and pharmaceutical applications, presents substantial untapped potential. As global awareness of the environmental and health benefits of organic products intensifies, the organic honey market is well-positioned for sustained and accelerated growth in the coming years, offering significant opportunities for market players and investors alike.
Organic Honey Segmentation
-
1. Application
- 1.1. Glass Jar
- 1.2. Plastic Containers
-
2. Type
- 2.1. Mixed Organic Honey
- 2.2. Manuka Organic Honey
- 2.3. Clover Organic Honey
- 2.4. Other Organic Honey
Organic Honey Segmentation By Geography
-
1. North America
- 1.1. United States
- 1.2. Canada
- 1.3. Mexico
-
2. South America
- 2.1. Brazil
- 2.2. Argentina
- 2.3. Rest of South America
-
3. Europe
- 3.1. United Kingdom
- 3.2. Germany
- 3.3. France
- 3.4. Italy
- 3.5. Spain
- 3.6. Russia
- 3.7. Benelux
- 3.8. Nordics
- 3.9. Rest of Europe
-
4. Middle East & Africa
- 4.1. Turkey
- 4.2. Israel
- 4.3. GCC
- 4.4. North Africa
- 4.5. South Africa
- 4.6. Rest of Middle East & Africa
-
5. Asia Pacific
- 5.1. China
- 5.2. India
- 5.3. Japan
- 5.4. South Korea
- 5.5. ASEAN
- 5.6. Oceania
- 5.7. Rest of Asia Pacific
Organic Honey Regional Market Share
Geographic Coverage of Organic Honey
Organic Honey REPORT HIGHLIGHTS
| Aspects | Details |
|---|---|
| Study Period | 2020-2034 |
| Base Year | 2025 |
| Estimated Year | 2026 |
| Forecast Period | 2026-2034 |
| Historical Period | 2020-2025 |
| Growth Rate | CAGR of 7.8% from 2020-2034 |
| Segmentation |
|
Table of Contents
- 1. Introduction
- 1.1. Research Scope
- 1.2. Market Segmentation
- 1.3. Research Methodology
- 1.4. Definitions and Assumptions
- 2. Executive Summary
- 2.1. Introduction
- 3. Market Dynamics
- 3.1. Introduction
- 3.2. Market Drivers
- 3.3. Market Restrains
- 3.4. Market Trends
- 4. Market Factor Analysis
- 4.1. Porters Five Forces
- 4.2. Supply/Value Chain
- 4.3. PESTEL analysis
- 4.4. Market Entropy
- 4.5. Patent/Trademark Analysis
- 5. Global Organic Honey Analysis, Insights and Forecast, 2020-2032
- 5.1. Market Analysis, Insights and Forecast - by Application
- 5.1.1. Glass Jar
- 5.1.2. Plastic Containers
- 5.2. Market Analysis, Insights and Forecast - by Type
- 5.2.1. Mixed Organic Honey
- 5.2.2. Manuka Organic Honey
- 5.2.3. Clover Organic Honey
- 5.2.4. Other Organic Honey
- 5.3. Market Analysis, Insights and Forecast - by Region
- 5.3.1. North America
- 5.3.2. South America
- 5.3.3. Europe
- 5.3.4. Middle East & Africa
- 5.3.5. Asia Pacific
- 5.1. Market Analysis, Insights and Forecast - by Application
- 6. North America Organic Honey Analysis, Insights and Forecast, 2020-2032
- 6.1. Market Analysis, Insights and Forecast - by Application
- 6.1.1. Glass Jar
- 6.1.2. Plastic Containers
- 6.2. Market Analysis, Insights and Forecast - by Type
- 6.2.1. Mixed Organic Honey
- 6.2.2. Manuka Organic Honey
- 6.2.3. Clover Organic Honey
- 6.2.4. Other Organic Honey
- 6.1. Market Analysis, Insights and Forecast - by Application
- 7. South America Organic Honey Analysis, Insights and Forecast, 2020-2032
- 7.1. Market Analysis, Insights and Forecast - by Application
- 7.1.1. Glass Jar
- 7.1.2. Plastic Containers
- 7.2. Market Analysis, Insights and Forecast - by Type
- 7.2.1. Mixed Organic Honey
- 7.2.2. Manuka Organic Honey
- 7.2.3. Clover Organic Honey
- 7.2.4. Other Organic Honey
- 7.1. Market Analysis, Insights and Forecast - by Application
- 8. Europe Organic Honey Analysis, Insights and Forecast, 2020-2032
- 8.1. Market Analysis, Insights and Forecast - by Application
- 8.1.1. Glass Jar
- 8.1.2. Plastic Containers
- 8.2. Market Analysis, Insights and Forecast - by Type
- 8.2.1. Mixed Organic Honey
- 8.2.2. Manuka Organic Honey
- 8.2.3. Clover Organic Honey
- 8.2.4. Other Organic Honey
- 8.1. Market Analysis, Insights and Forecast - by Application
- 9. Middle East & Africa Organic Honey Analysis, Insights and Forecast, 2020-2032
- 9.1. Market Analysis, Insights and Forecast - by Application
- 9.1.1. Glass Jar
- 9.1.2. Plastic Containers
- 9.2. Market Analysis, Insights and Forecast - by Type
- 9.2.1. Mixed Organic Honey
- 9.2.2. Manuka Organic Honey
- 9.2.3. Clover Organic Honey
- 9.2.4. Other Organic Honey
- 9.1. Market Analysis, Insights and Forecast - by Application
- 10. Asia Pacific Organic Honey Analysis, Insights and Forecast, 2020-2032
- 10.1. Market Analysis, Insights and Forecast - by Application
- 10.1.1. Glass Jar
- 10.1.2. Plastic Containers
- 10.2. Market Analysis, Insights and Forecast - by Type
- 10.2.1. Mixed Organic Honey
- 10.2.2. Manuka Organic Honey
- 10.2.3. Clover Organic Honey
- 10.2.4. Other Organic Honey
- 10.1. Market Analysis, Insights and Forecast - by Application
- 11. Competitive Analysis
- 11.1. Global Market Share Analysis 2025
- 11.2. Company Profiles
- 11.2.1 Dutch Gold
- 11.2.1.1. Overview
- 11.2.1.2. Products
- 11.2.1.3. SWOT Analysis
- 11.2.1.4. Recent Developments
- 11.2.1.5. Financials (Based on Availability)
- 11.2.2 Nature Nate’s
- 11.2.2.1. Overview
- 11.2.2.2. Products
- 11.2.2.3. SWOT Analysis
- 11.2.2.4. Recent Developments
- 11.2.2.5. Financials (Based on Availability)
- 11.2.3 Rowse
- 11.2.3.1. Overview
- 11.2.3.2. Products
- 11.2.3.3. SWOT Analysis
- 11.2.3.4. Recent Developments
- 11.2.3.5. Financials (Based on Availability)
- 11.2.4 Barkman Honey
- 11.2.4.1. Overview
- 11.2.4.2. Products
- 11.2.4.3. SWOT Analysis
- 11.2.4.4. Recent Developments
- 11.2.4.5. Financials (Based on Availability)
- 11.2.5 Langnese
- 11.2.5.1. Overview
- 11.2.5.2. Products
- 11.2.5.3. SWOT Analysis
- 11.2.5.4. Recent Developments
- 11.2.5.5. Financials (Based on Availability)
- 11.2.6 Little Bee Impex
- 11.2.6.1. Overview
- 11.2.6.2. Products
- 11.2.6.3. SWOT Analysis
- 11.2.6.4. Recent Developments
- 11.2.6.5. Financials (Based on Availability)
- 11.2.7 GloryBee
- 11.2.7.1. Overview
- 11.2.7.2. Products
- 11.2.7.3. SWOT Analysis
- 11.2.7.4. Recent Developments
- 11.2.7.5. Financials (Based on Availability)
- 11.2.8 Madhava Honey
- 11.2.8.1. Overview
- 11.2.8.2. Products
- 11.2.8.3. SWOT Analysis
- 11.2.8.4. Recent Developments
- 11.2.8.5. Financials (Based on Availability)
- 11.2.9 Sue Bee
- 11.2.9.1. Overview
- 11.2.9.2. Products
- 11.2.9.3. SWOT Analysis
- 11.2.9.4. Recent Developments
- 11.2.9.5. Financials (Based on Availability)
- 11.2.10 Y.S. Organic Bee Farms
- 11.2.10.1. Overview
- 11.2.10.2. Products
- 11.2.10.3. SWOT Analysis
- 11.2.10.4. Recent Developments
- 11.2.10.5. Financials (Based on Availability)
- 11.2.11 Conscious Food
- 11.2.11.1. Overview
- 11.2.11.2. Products
- 11.2.11.3. SWOT Analysis
- 11.2.11.4. Recent Developments
- 11.2.11.5. Financials (Based on Availability)
- 11.2.12 Heavenly Organics
- 11.2.12.1. Overview
- 11.2.12.2. Products
- 11.2.12.3. SWOT Analysis
- 11.2.12.4. Recent Developments
- 11.2.12.5. Financials (Based on Availability)
- 11.2.13 Comvita
- 11.2.13.1. Overview
- 11.2.13.2. Products
- 11.2.13.3. SWOT Analysis
- 11.2.13.4. Recent Developments
- 11.2.13.5. Financials (Based on Availability)
- 11.2.14 Manuka Health
- 11.2.14.1. Overview
- 11.2.14.2. Products
- 11.2.14.3. SWOT Analysis
- 11.2.14.4. Recent Developments
- 11.2.14.5. Financials (Based on Availability)
- 11.2.1 Dutch Gold
List of Figures
- Figure 1: Global Organic Honey Revenue Breakdown (million, %) by Region 2025 & 2033
- Figure 2: North America Organic Honey Revenue (million), by Application 2025 & 2033
- Figure 3: North America Organic Honey Revenue Share (%), by Application 2025 & 2033
- Figure 4: North America Organic Honey Revenue (million), by Type 2025 & 2033
- Figure 5: North America Organic Honey Revenue Share (%), by Type 2025 & 2033
- Figure 6: North America Organic Honey Revenue (million), by Country 2025 & 2033
- Figure 7: North America Organic Honey Revenue Share (%), by Country 2025 & 2033
- Figure 8: South America Organic Honey Revenue (million), by Application 2025 & 2033
- Figure 9: South America Organic Honey Revenue Share (%), by Application 2025 & 2033
- Figure 10: South America Organic Honey Revenue (million), by Type 2025 & 2033
- Figure 11: South America Organic Honey Revenue Share (%), by Type 2025 & 2033
- Figure 12: South America Organic Honey Revenue (million), by Country 2025 & 2033
- Figure 13: South America Organic Honey Revenue Share (%), by Country 2025 & 2033
- Figure 14: Europe Organic Honey Revenue (million), by Application 2025 & 2033
- Figure 15: Europe Organic Honey Revenue Share (%), by Application 2025 & 2033
- Figure 16: Europe Organic Honey Revenue (million), by Type 2025 & 2033
- Figure 17: Europe Organic Honey Revenue Share (%), by Type 2025 & 2033
- Figure 18: Europe Organic Honey Revenue (million), by Country 2025 & 2033
- Figure 19: Europe Organic Honey Revenue Share (%), by Country 2025 & 2033
- Figure 20: Middle East & Africa Organic Honey Revenue (million), by Application 2025 & 2033
- Figure 21: Middle East & Africa Organic Honey Revenue Share (%), by Application 2025 & 2033
- Figure 22: Middle East & Africa Organic Honey Revenue (million), by Type 2025 & 2033
- Figure 23: Middle East & Africa Organic Honey Revenue Share (%), by Type 2025 & 2033
- Figure 24: Middle East & Africa Organic Honey Revenue (million), by Country 2025 & 2033
- Figure 25: Middle East & Africa Organic Honey Revenue Share (%), by Country 2025 & 2033
- Figure 26: Asia Pacific Organic Honey Revenue (million), by Application 2025 & 2033
- Figure 27: Asia Pacific Organic Honey Revenue Share (%), by Application 2025 & 2033
- Figure 28: Asia Pacific Organic Honey Revenue (million), by Type 2025 & 2033
- Figure 29: Asia Pacific Organic Honey Revenue Share (%), by Type 2025 & 2033
- Figure 30: Asia Pacific Organic Honey Revenue (million), by Country 2025 & 2033
- Figure 31: Asia Pacific Organic Honey Revenue Share (%), by Country 2025 & 2033
List of Tables
- Table 1: Global Organic Honey Revenue million Forecast, by Application 2020 & 2033
- Table 2: Global Organic Honey Revenue million Forecast, by Type 2020 & 2033
- Table 3: Global Organic Honey Revenue million Forecast, by Region 2020 & 2033
- Table 4: Global Organic Honey Revenue million Forecast, by Application 2020 & 2033
- Table 5: Global Organic Honey Revenue million Forecast, by Type 2020 & 2033
- Table 6: Global Organic Honey Revenue million Forecast, by Country 2020 & 2033
- Table 7: United States Organic Honey Revenue (million) Forecast, by Application 2020 & 2033
- Table 8: Canada Organic Honey Revenue (million) Forecast, by Application 2020 & 2033
- Table 9: Mexico Organic Honey Revenue (million) Forecast, by Application 2020 & 2033
- Table 10: Global Organic Honey Revenue million Forecast, by Application 2020 & 2033
- Table 11: Global Organic Honey Revenue million Forecast, by Type 2020 & 2033
- Table 12: Global Organic Honey Revenue million Forecast, by Country 2020 & 2033
- Table 13: Brazil Organic Honey Revenue (million) Forecast, by Application 2020 & 2033
- Table 14: Argentina Organic Honey Revenue (million) Forecast, by Application 2020 & 2033
- Table 15: Rest of South America Organic Honey Revenue (million) Forecast, by Application 2020 & 2033
- Table 16: Global Organic Honey Revenue million Forecast, by Application 2020 & 2033
- Table 17: Global Organic Honey Revenue million Forecast, by Type 2020 & 2033
- Table 18: Global Organic Honey Revenue million Forecast, by Country 2020 & 2033
- Table 19: United Kingdom Organic Honey Revenue (million) Forecast, by Application 2020 & 2033
- Table 20: Germany Organic Honey Revenue (million) Forecast, by Application 2020 & 2033
- Table 21: France Organic Honey Revenue (million) Forecast, by Application 2020 & 2033
- Table 22: Italy Organic Honey Revenue (million) Forecast, by Application 2020 & 2033
- Table 23: Spain Organic Honey Revenue (million) Forecast, by Application 2020 & 2033
- Table 24: Russia Organic Honey Revenue (million) Forecast, by Application 2020 & 2033
- Table 25: Benelux Organic Honey Revenue (million) Forecast, by Application 2020 & 2033
- Table 26: Nordics Organic Honey Revenue (million) Forecast, by Application 2020 & 2033
- Table 27: Rest of Europe Organic Honey Revenue (million) Forecast, by Application 2020 & 2033
- Table 28: Global Organic Honey Revenue million Forecast, by Application 2020 & 2033
- Table 29: Global Organic Honey Revenue million Forecast, by Type 2020 & 2033
- Table 30: Global Organic Honey Revenue million Forecast, by Country 2020 & 2033
- Table 31: Turkey Organic Honey Revenue (million) Forecast, by Application 2020 & 2033
- Table 32: Israel Organic Honey Revenue (million) Forecast, by Application 2020 & 2033
- Table 33: GCC Organic Honey Revenue (million) Forecast, by Application 2020 & 2033
- Table 34: North Africa Organic Honey Revenue (million) Forecast, by Application 2020 & 2033
- Table 35: South Africa Organic Honey Revenue (million) Forecast, by Application 2020 & 2033
- Table 36: Rest of Middle East & Africa Organic Honey Revenue (million) Forecast, by Application 2020 & 2033
- Table 37: Global Organic Honey Revenue million Forecast, by Application 2020 & 2033
- Table 38: Global Organic Honey Revenue million Forecast, by Type 2020 & 2033
- Table 39: Global Organic Honey Revenue million Forecast, by Country 2020 & 2033
- Table 40: China Organic Honey Revenue (million) Forecast, by Application 2020 & 2033
- Table 41: India Organic Honey Revenue (million) Forecast, by Application 2020 & 2033
- Table 42: Japan Organic Honey Revenue (million) Forecast, by Application 2020 & 2033
- Table 43: South Korea Organic Honey Revenue (million) Forecast, by Application 2020 & 2033
- Table 44: ASEAN Organic Honey Revenue (million) Forecast, by Application 2020 & 2033
- Table 45: Oceania Organic Honey Revenue (million) Forecast, by Application 2020 & 2033
- Table 46: Rest of Asia Pacific Organic Honey Revenue (million) Forecast, by Application 2020 & 2033
Frequently Asked Questions
1. What is the projected Compound Annual Growth Rate (CAGR) of the Organic Honey?
The projected CAGR is approximately 7.8%.
2. Which companies are prominent players in the Organic Honey?
Key companies in the market include Dutch Gold, Nature Nate’s, Rowse, Barkman Honey, Langnese, Little Bee Impex, GloryBee, Madhava Honey, Sue Bee, Y.S. Organic Bee Farms, Conscious Food, Heavenly Organics, Comvita, Manuka Health.
3. What are the main segments of the Organic Honey?
The market segments include Application, Type.
4. Can you provide details about the market size?
The market size is estimated to be USD 990.9 million as of 2022.
5. What are some drivers contributing to market growth?
N/A
6. What are the notable trends driving market growth?
N/A
7. Are there any restraints impacting market growth?
N/A
8. Can you provide examples of recent developments in the market?
N/A
9. What pricing options are available for accessing the report?
Pricing options include single-user, multi-user, and enterprise licenses priced at USD 4250.00, USD 6375.00, and USD 8500.00 respectively.
10. Is the market size provided in terms of value or volume?
The market size is provided in terms of value, measured in million.
11. Are there any specific market keywords associated with the report?
Yes, the market keyword associated with the report is "Organic Honey," which aids in identifying and referencing the specific market segment covered.
12. How do I determine which pricing option suits my needs best?
The pricing options vary based on user requirements and access needs. Individual users may opt for single-user licenses, while businesses requiring broader access may choose multi-user or enterprise licenses for cost-effective access to the report.
13. Are there any additional resources or data provided in the Organic Honey report?
While the report offers comprehensive insights, it's advisable to review the specific contents or supplementary materials provided to ascertain if additional resources or data are available.
14. How can I stay updated on further developments or reports in the Organic Honey?
To stay informed about further developments, trends, and reports in the Organic Honey, consider subscribing to industry newsletters, following relevant companies and organizations, or regularly checking reputable industry news sources and publications.
Methodology
Step 1 - Identification of Relevant Samples Size from Population Database


Step 2 - Approaches for Defining Global Market Size (Value, Volume* & Price*)

Note*: In applicable scenarios
Step 3 - Data Sources
Primary Research
- Web Analytics
- Survey Reports
- Research Institute
- Latest Research Reports
- Opinion Leaders
Secondary Research
- Annual Reports
- White Paper
- Latest Press Release
- Industry Association
- Paid Database
- Investor Presentations

Step 4 - Data Triangulation
Involves using different sources of information in order to increase the validity of a study
These sources are likely to be stakeholders in a program - participants, other researchers, program staff, other community members, and so on.
Then we put all data in single framework & apply various statistical tools to find out the dynamic on the market.
During the analysis stage, feedback from the stakeholder groups would be compared to determine areas of agreement as well as areas of divergence