

Key Insights
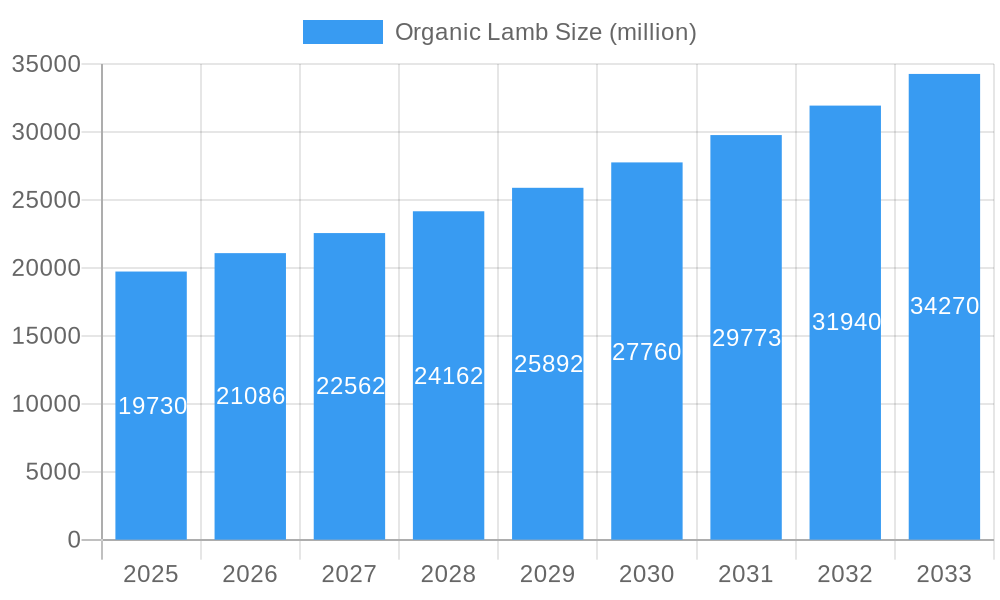
The global organic lamb market is projected to reach $4.4 billion by 2025, demonstrating a Compound Annual Growth Rate (CAGR) of 5.5%. This expansion is propelled by heightened consumer awareness of health and sustainability, a growing preference for ethically sourced food, and increasing disposable incomes, particularly in emerging economies. Key growth drivers include the escalating demand for high-quality protein, the adoption of organic dietary practices, and stringent regulations promoting sustainable agriculture. The market also benefits from the increasing popularity of gourmet and specialty food products, where organic lamb often garners a premium. Despite potential restraints from supply chain complexities and raw material cost fluctuations, the market outlook remains optimistic. The market is segmented by product type (e.g., whole lamb, cuts), distribution channels (retail, food service), and geography. Leading companies such as Arcadian Organic and Natural Meat Co. and Thomas Food International are actively influencing market dynamics through innovation, strategic alliances, and global expansion.
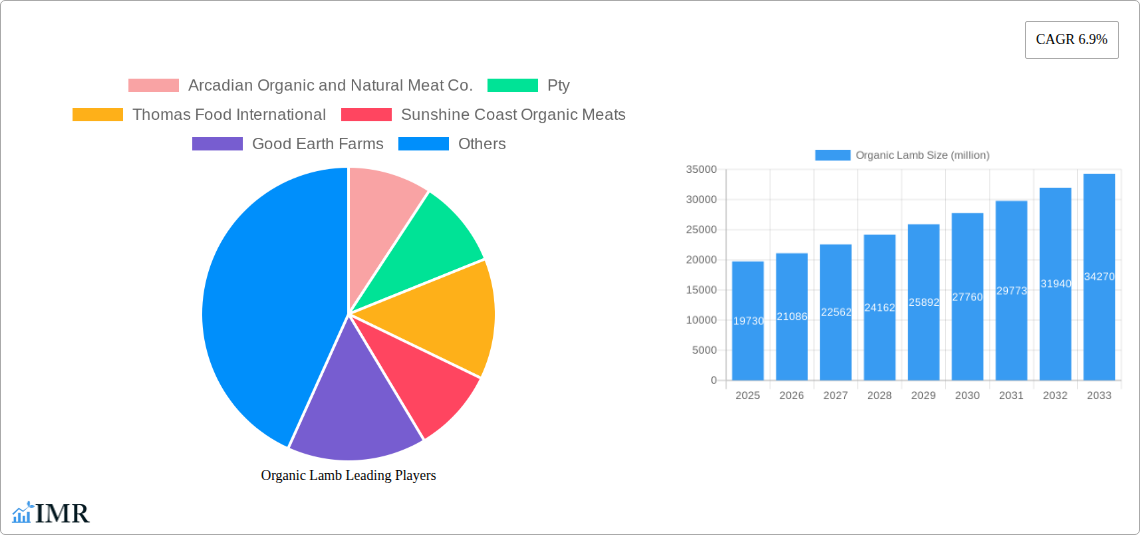
Organic Lamb Market Size (In Billion)
Continued market growth will be supported by government initiatives promoting organic and sustainable farming, alongside the expanding reach of online grocery platforms and e-commerce. The increasing influence of health and wellness trends, coupled with a greater emphasis on lean protein and ethical sourcing, further underpins this expansion. Addressing challenges like price volatility and ensuring robust supply chain management will be crucial for sustaining growth. Market participants are anticipated to concentrate on product innovation, supply chain optimization, and targeted marketing to secure a larger market share in this high-value sector.
Organic Lamb Company Market Share
Organic Lamb Market Report: 2019-2033
This comprehensive report provides a detailed analysis of the global organic lamb market, encompassing market dynamics, growth trends, regional dominance, product landscape, key players, and future outlook. The study period covers 2019-2033, with 2025 as the base and estimated year. This report is invaluable for industry professionals, investors, and strategic decision-makers seeking to understand and capitalize on opportunities within this dynamic sector. The report leverages extensive primary and secondary research to deliver actionable insights. Market values are presented in million units.
Organic Lamb Market Dynamics & Structure
The organic lamb market is characterized by moderate concentration, with key players such as Arcadian Organic and Natural Meat Co., Pty, Thomas Food International, and others holding significant market share, estimated at xx% collectively in 2025. Technological innovation, primarily focused on improving farming practices and enhancing supply chain efficiency, is a key driver. Stringent regulatory frameworks governing organic certification and animal welfare significantly impact market dynamics. Competitive substitutes include conventionally raised lamb and other protein sources, influencing consumer choices. The market caters primarily to health-conscious consumers with higher disposable incomes, concentrated mainly in developed nations. M&A activity in the organic lamb sector has been moderate, with approximately xx deals recorded between 2019 and 2024, driven by expansion and market consolidation strategies.
- Market Concentration: Moderately concentrated, with top players holding xx% market share in 2025.
- Technological Innovation: Focus on sustainable farming practices and supply chain optimization.
- Regulatory Framework: Stringent organic certification standards and animal welfare regulations.
- Competitive Substitutes: Conventionally raised lamb and alternative protein sources.
- End-User Demographics: Health-conscious consumers with higher disposable incomes in developed markets.
- M&A Trends: Moderate activity (xx deals between 2019-2024) driven by expansion and consolidation.
Organic Lamb Growth Trends & Insights
The global organic lamb market experienced a CAGR of xx% during the historical period (2019-2024), reaching a market size of xx million units in 2024. This growth is attributed to increasing consumer demand for healthier and ethically sourced food products, fueled by rising awareness of animal welfare and environmental sustainability. Market penetration of organic lamb remains relatively low compared to conventional lamb, presenting significant growth opportunities. Technological advancements in farming techniques and processing methods have further propelled market expansion. Shifts in consumer behavior, including a preference for direct-to-consumer models and increased online purchases, are reshaping the market landscape. The forecast period (2025-2033) projects continued growth, with a projected CAGR of xx%, driven by factors outlined above. By 2033, the market size is expected to reach xx million units.
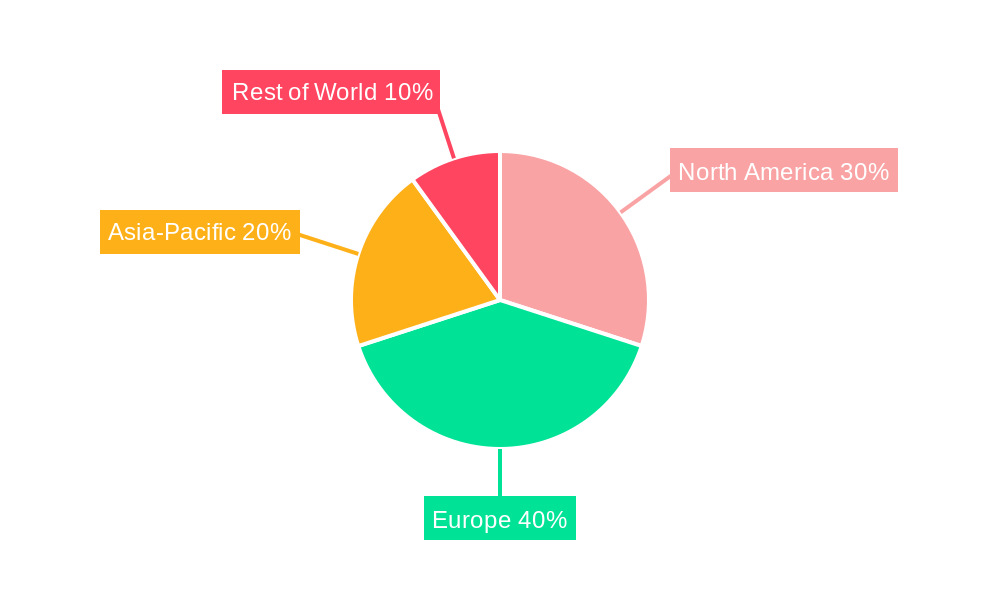
Dominant Regions, Countries, or Segments in Organic Lamb
The North American and European regions dominate the global organic lamb market, accounting for a combined xx% of global market share in 2025. This dominance is attributable to factors such as higher consumer disposable incomes, increased awareness of healthy eating habits, and well-established organic farming infrastructure. Australia and New Zealand also hold significant market share due to their robust organic lamb production capabilities. Strong government support for organic farming, coupled with favorable climatic conditions and efficient supply chains, contribute to regional growth.
- Key Drivers (North America & Europe): High consumer disposable income, health consciousness, established organic farming infrastructure.
- Key Drivers (Australia & New Zealand): Robust organic lamb production capabilities, government support, favorable climate.
- Market Share: North America and Europe account for xx% of the global market in 2025.
- Growth Potential: Continued expansion expected, particularly in emerging markets.
Organic Lamb Product Landscape
The organic lamb product landscape is witnessing innovation in packaging, processing methods, and value-added products. Premium cuts and specialized organic lamb products are gaining traction, catering to diverse consumer preferences. Technological advancements are enhancing traceability and transparency within the supply chain, building consumer trust. Unique selling propositions (USPs) include certifications, sustainable farming practices, and ethical sourcing, differentiating organic lamb from conventional counterparts.
Key Drivers, Barriers & Challenges in Organic Lamb
Key Drivers:
- Increasing consumer demand for healthy and ethically sourced food.
- Growing awareness of animal welfare and environmental sustainability.
- Government support and subsidies for organic farming.
- Technological advancements in farming and processing.
Challenges & Restraints:
- Higher production costs compared to conventional lamb, limiting market accessibility.
- Supply chain inefficiencies and challenges in meeting increasing demand.
- Stringent regulations and certification processes can pose barriers for producers.
- Competition from conventional lamb and alternative protein sources. This results in a xx% price difference in 2025 compared to conventional lamb.
Emerging Opportunities in Organic Lamb
Emerging opportunities lie in expanding into untapped markets, particularly in Asia and Latin America, where growing middle classes and increasing health consciousness present significant potential. Innovation in value-added products, such as ready-to-eat organic lamb meals and specialized organic lamb cuts, can cater to evolving consumer preferences. Furthermore, exploring alternative distribution channels, including direct-to-consumer models and online sales, can enhance market penetration and accessibility.
Growth Accelerators in the Organic Lamb Industry
Technological breakthroughs in precision agriculture and improved breeding techniques are driving productivity gains and enhancing the sustainability of organic lamb production. Strategic partnerships between producers, processors, and retailers are optimizing supply chains and improving market access. Expanding into new markets and developing innovative product offerings will further stimulate long-term growth.
Key Players Shaping the Organic Lamb Market
- Arcadian Organic and Natural Meat Co., Pty
- Thomas Food International
- Sunshine Coast Organic Meats
- Good Earth Farms
- Irish Country Meats
- Tulip Ltd
- The Lamb Company North America
- Niman Ranch
- Strauss Brands Incorporated
- Pitney Farm Shop
- Mallow Farm and Cottage
- Colin and Sally's Organic Lamb and Beef
- Hollyburton Pick's Organic Farm
- Elliott Agriculture Pty Ltd
- Swillington Organic Farm Ltd
Notable Milestones in Organic Lamb Sector
- 2020: Increased adoption of blockchain technology for improved traceability.
- 2021: Launch of several new organic lamb product lines by key players.
- 2022: Significant investment in sustainable farming practices by leading producers.
- 2023: Expansion of organic lamb exports to new international markets.
In-Depth Organic Lamb Market Outlook
The organic lamb market is poised for sustained growth over the forecast period (2025-2033), driven by increasing consumer demand, technological innovation, and supportive government policies. Strategic opportunities abound for companies focused on sustainable production, efficient supply chain management, and innovative product development. Expansion into new geographical markets and catering to evolving consumer preferences will be crucial for maximizing long-term success in this promising sector.
Organic Lamb Segmentation
-
1. Application
- 1.1. Households
- 1.2. Food
- 1.3. Commercial
- 1.4. Others
-
2. Type
- 2.1. Raw Lambs
- 2.2. Processed Lambs
Organic Lamb Segmentation By Geography
-
1. North America
- 1.1. United States
- 1.2. Canada
- 1.3. Mexico
-
2. South America
- 2.1. Brazil
- 2.2. Argentina
- 2.3. Rest of South America
-
3. Europe
- 3.1. United Kingdom
- 3.2. Germany
- 3.3. France
- 3.4. Italy
- 3.5. Spain
- 3.6. Russia
- 3.7. Benelux
- 3.8. Nordics
- 3.9. Rest of Europe
-
4. Middle East & Africa
- 4.1. Turkey
- 4.2. Israel
- 4.3. GCC
- 4.4. North Africa
- 4.5. South Africa
- 4.6. Rest of Middle East & Africa
-
5. Asia Pacific
- 5.1. China
- 5.2. India
- 5.3. Japan
- 5.4. South Korea
- 5.5. ASEAN
- 5.6. Oceania
- 5.7. Rest of Asia Pacific
Organic Lamb Regional Market Share
Geographic Coverage of Organic Lamb
Organic Lamb REPORT HIGHLIGHTS
| Aspects | Details |
|---|---|
| Study Period | 2020-2034 |
| Base Year | 2025 |
| Estimated Year | 2026 |
| Forecast Period | 2026-2034 |
| Historical Period | 2020-2025 |
| Growth Rate | CAGR of 5.5% from 2020-2034 |
| Segmentation |
|
Table of Contents
- 1. Introduction
- 1.1. Research Scope
- 1.2. Market Segmentation
- 1.3. Research Objective
- 1.4. Definitions and Assumptions
- 2. Executive Summary
- 2.1. Market Snapshot
- 3. Market Dynamics
- 3.1. Market Drivers
- 3.2. Market Restrains
- 3.3. Market Trends
- 3.4. Market Opportunities
- 4. Market Factor Analysis
- 4.1. Porters Five Forces
- 4.1.1. Bargaining Power of Suppliers
- 4.1.2. Bargaining Power of Buyers
- 4.1.3. Threat of New Entrants
- 4.1.4. Threat of Substitutes
- 4.1.5. Competitive Rivalry
- 4.2. PESTEL analysis
- 4.3. BCG Analysis
- 4.3.1. Stars (High Growth, High Market Share)
- 4.3.2. Cash Cows (Low Growth, High Market Share)
- 4.3.3. Question Mark (High Growth, Low Market Share)
- 4.3.4. Dogs (Low Growth, Low Market Share)
- 4.4. Ansoff Matrix Analysis
- 4.5. Supply Chain Analysis
- 4.6. Regulatory Landscape
- 4.7. Current Market Potential and Opportunity Assessment (TAM–SAM–SOM Framework)
- 4.8. IMR Analyst Note
- 4.1. Porters Five Forces
- 5. Market Analysis, Insights and Forecast 2021-2033
- 5.1. Market Analysis, Insights and Forecast - by Application
- 5.1.1. Households
- 5.1.2. Food
- 5.1.3. Commercial
- 5.1.4. Others
- 5.2. Market Analysis, Insights and Forecast - by Type
- 5.2.1. Raw Lambs
- 5.2.2. Processed Lambs
- 5.3. Market Analysis, Insights and Forecast - by Region
- 5.3.1. North America
- 5.3.2. South America
- 5.3.3. Europe
- 5.3.4. Middle East & Africa
- 5.3.5. Asia Pacific
- 5.1. Market Analysis, Insights and Forecast - by Application
- 6. Global Organic Lamb Analysis, Insights and Forecast, 2021-2033
- 6.1. Market Analysis, Insights and Forecast - by Application
- 6.1.1. Households
- 6.1.2. Food
- 6.1.3. Commercial
- 6.1.4. Others
- 6.2. Market Analysis, Insights and Forecast - by Type
- 6.2.1. Raw Lambs
- 6.2.2. Processed Lambs
- 6.1. Market Analysis, Insights and Forecast - by Application
- 7. North America Organic Lamb Analysis, Insights and Forecast, 2020-2032
- 7.1. Market Analysis, Insights and Forecast - by Application
- 7.1.1. Households
- 7.1.2. Food
- 7.1.3. Commercial
- 7.1.4. Others
- 7.2. Market Analysis, Insights and Forecast - by Type
- 7.2.1. Raw Lambs
- 7.2.2. Processed Lambs
- 7.1. Market Analysis, Insights and Forecast - by Application
- 8. South America Organic Lamb Analysis, Insights and Forecast, 2020-2032
- 8.1. Market Analysis, Insights and Forecast - by Application
- 8.1.1. Households
- 8.1.2. Food
- 8.1.3. Commercial
- 8.1.4. Others
- 8.2. Market Analysis, Insights and Forecast - by Type
- 8.2.1. Raw Lambs
- 8.2.2. Processed Lambs
- 8.1. Market Analysis, Insights and Forecast - by Application
- 9. Europe Organic Lamb Analysis, Insights and Forecast, 2020-2032
- 9.1. Market Analysis, Insights and Forecast - by Application
- 9.1.1. Households
- 9.1.2. Food
- 9.1.3. Commercial
- 9.1.4. Others
- 9.2. Market Analysis, Insights and Forecast - by Type
- 9.2.1. Raw Lambs
- 9.2.2. Processed Lambs
- 9.1. Market Analysis, Insights and Forecast - by Application
- 10. Middle East & Africa Organic Lamb Analysis, Insights and Forecast, 2020-2032
- 10.1. Market Analysis, Insights and Forecast - by Application
- 10.1.1. Households
- 10.1.2. Food
- 10.1.3. Commercial
- 10.1.4. Others
- 10.2. Market Analysis, Insights and Forecast - by Type
- 10.2.1. Raw Lambs
- 10.2.2. Processed Lambs
- 10.1. Market Analysis, Insights and Forecast - by Application
- 11. Asia Pacific Organic Lamb Analysis, Insights and Forecast, 2020-2032
- 11.1. Market Analysis, Insights and Forecast - by Application
- 11.1.1. Households
- 11.1.2. Food
- 11.1.3. Commercial
- 11.1.4. Others
- 11.2. Market Analysis, Insights and Forecast - by Type
- 11.2.1. Raw Lambs
- 11.2.2. Processed Lambs
- 11.1. Market Analysis, Insights and Forecast - by Application
- 12. Competitive Analysis
- 12.1. Company Profiles
- 12.1.1 Arcadian Organic and Natural Meat Co.
- 12.1.1.1. Company Overview
- 12.1.1.2. Products
- 12.1.1.3. Company Financials
- 12.1.1.4. SWOT Analysis
- 12.1.2 Pty
- 12.1.2.1. Company Overview
- 12.1.2.2. Products
- 12.1.2.3. Company Financials
- 12.1.2.4. SWOT Analysis
- 12.1.3 Thomas Food International
- 12.1.3.1. Company Overview
- 12.1.3.2. Products
- 12.1.3.3. Company Financials
- 12.1.3.4. SWOT Analysis
- 12.1.4 Sunshine Coast Organic Meats
- 12.1.4.1. Company Overview
- 12.1.4.2. Products
- 12.1.4.3. Company Financials
- 12.1.4.4. SWOT Analysis
- 12.1.5 Good Earth Farms
- 12.1.5.1. Company Overview
- 12.1.5.2. Products
- 12.1.5.3. Company Financials
- 12.1.5.4. SWOT Analysis
- 12.1.6 Irish Country Meats
- 12.1.6.1. Company Overview
- 12.1.6.2. Products
- 12.1.6.3. Company Financials
- 12.1.6.4. SWOT Analysis
- 12.1.7 Tulip Ltd
- 12.1.7.1. Company Overview
- 12.1.7.2. Products
- 12.1.7.3. Company Financials
- 12.1.7.4. SWOT Analysis
- 12.1.8 The Lamb Company North America
- 12.1.8.1. Company Overview
- 12.1.8.2. Products
- 12.1.8.3. Company Financials
- 12.1.8.4. SWOT Analysis
- 12.1.9 Niman Ranch
- 12.1.9.1. Company Overview
- 12.1.9.2. Products
- 12.1.9.3. Company Financials
- 12.1.9.4. SWOT Analysis
- 12.1.10 Strauss Brands Incorporated
- 12.1.10.1. Company Overview
- 12.1.10.2. Products
- 12.1.10.3. Company Financials
- 12.1.10.4. SWOT Analysis
- 12.1.11 Pitney Farm Shop
- 12.1.11.1. Company Overview
- 12.1.11.2. Products
- 12.1.11.3. Company Financials
- 12.1.11.4. SWOT Analysis
- 12.1.12 Mallow Farm and Cottage
- 12.1.12.1. Company Overview
- 12.1.12.2. Products
- 12.1.12.3. Company Financials
- 12.1.12.4. SWOT Analysis
- 12.1.13 Colin and Sally's Organic Lamb and Beef
- 12.1.13.1. Company Overview
- 12.1.13.2. Products
- 12.1.13.3. Company Financials
- 12.1.13.4. SWOT Analysis
- 12.1.14 Hollyburton Pick's Organic Farm
- 12.1.14.1. Company Overview
- 12.1.14.2. Products
- 12.1.14.3. Company Financials
- 12.1.14.4. SWOT Analysis
- 12.1.15 Elliott Agriculture Pty Ltd
- 12.1.15.1. Company Overview
- 12.1.15.2. Products
- 12.1.15.3. Company Financials
- 12.1.15.4. SWOT Analysis
- 12.1.16 Swillington Organic Farm Ltd
- 12.1.16.1. Company Overview
- 12.1.16.2. Products
- 12.1.16.3. Company Financials
- 12.1.16.4. SWOT Analysis
- 12.1.1 Arcadian Organic and Natural Meat Co.
- 12.2. Market Entropy
- 12.2.1 Company's Key Areas Served
- 12.2.2 Recent Developments
- 12.3. Company Market Share Analysis 2025
- 12.3.1 Top 5 Companies Market Share Analysis
- 12.3.2 Top 3 Companies Market Share Analysis
- 12.4. List of Potential Customers
- 13. Research Methodology
List of Figures
- Figure 1: Global Organic Lamb Revenue Breakdown (billion, %) by Region 2025 & 2033
- Figure 2: Global Organic Lamb Volume Breakdown (K, %) by Region 2025 & 2033
- Figure 3: North America Organic Lamb Revenue (billion), by Application 2025 & 2033
- Figure 4: North America Organic Lamb Volume (K), by Application 2025 & 2033
- Figure 5: North America Organic Lamb Revenue Share (%), by Application 2025 & 2033
- Figure 6: North America Organic Lamb Volume Share (%), by Application 2025 & 2033
- Figure 7: North America Organic Lamb Revenue (billion), by Type 2025 & 2033
- Figure 8: North America Organic Lamb Volume (K), by Type 2025 & 2033
- Figure 9: North America Organic Lamb Revenue Share (%), by Type 2025 & 2033
- Figure 10: North America Organic Lamb Volume Share (%), by Type 2025 & 2033
- Figure 11: North America Organic Lamb Revenue (billion), by Country 2025 & 2033
- Figure 12: North America Organic Lamb Volume (K), by Country 2025 & 2033
- Figure 13: North America Organic Lamb Revenue Share (%), by Country 2025 & 2033
- Figure 14: North America Organic Lamb Volume Share (%), by Country 2025 & 2033
- Figure 15: South America Organic Lamb Revenue (billion), by Application 2025 & 2033
- Figure 16: South America Organic Lamb Volume (K), by Application 2025 & 2033
- Figure 17: South America Organic Lamb Revenue Share (%), by Application 2025 & 2033
- Figure 18: South America Organic Lamb Volume Share (%), by Application 2025 & 2033
- Figure 19: South America Organic Lamb Revenue (billion), by Type 2025 & 2033
- Figure 20: South America Organic Lamb Volume (K), by Type 2025 & 2033
- Figure 21: South America Organic Lamb Revenue Share (%), by Type 2025 & 2033
- Figure 22: South America Organic Lamb Volume Share (%), by Type 2025 & 2033
- Figure 23: South America Organic Lamb Revenue (billion), by Country 2025 & 2033
- Figure 24: South America Organic Lamb Volume (K), by Country 2025 & 2033
- Figure 25: South America Organic Lamb Revenue Share (%), by Country 2025 & 2033
- Figure 26: South America Organic Lamb Volume Share (%), by Country 2025 & 2033
- Figure 27: Europe Organic Lamb Revenue (billion), by Application 2025 & 2033
- Figure 28: Europe Organic Lamb Volume (K), by Application 2025 & 2033
- Figure 29: Europe Organic Lamb Revenue Share (%), by Application 2025 & 2033
- Figure 30: Europe Organic Lamb Volume Share (%), by Application 2025 & 2033
- Figure 31: Europe Organic Lamb Revenue (billion), by Type 2025 & 2033
- Figure 32: Europe Organic Lamb Volume (K), by Type 2025 & 2033
- Figure 33: Europe Organic Lamb Revenue Share (%), by Type 2025 & 2033
- Figure 34: Europe Organic Lamb Volume Share (%), by Type 2025 & 2033
- Figure 35: Europe Organic Lamb Revenue (billion), by Country 2025 & 2033
- Figure 36: Europe Organic Lamb Volume (K), by Country 2025 & 2033
- Figure 37: Europe Organic Lamb Revenue Share (%), by Country 2025 & 2033
- Figure 38: Europe Organic Lamb Volume Share (%), by Country 2025 & 2033
- Figure 39: Middle East & Africa Organic Lamb Revenue (billion), by Application 2025 & 2033
- Figure 40: Middle East & Africa Organic Lamb Volume (K), by Application 2025 & 2033
- Figure 41: Middle East & Africa Organic Lamb Revenue Share (%), by Application 2025 & 2033
- Figure 42: Middle East & Africa Organic Lamb Volume Share (%), by Application 2025 & 2033
- Figure 43: Middle East & Africa Organic Lamb Revenue (billion), by Type 2025 & 2033
- Figure 44: Middle East & Africa Organic Lamb Volume (K), by Type 2025 & 2033
- Figure 45: Middle East & Africa Organic Lamb Revenue Share (%), by Type 2025 & 2033
- Figure 46: Middle East & Africa Organic Lamb Volume Share (%), by Type 2025 & 2033
- Figure 47: Middle East & Africa Organic Lamb Revenue (billion), by Country 2025 & 2033
- Figure 48: Middle East & Africa Organic Lamb Volume (K), by Country 2025 & 2033
- Figure 49: Middle East & Africa Organic Lamb Revenue Share (%), by Country 2025 & 2033
- Figure 50: Middle East & Africa Organic Lamb Volume Share (%), by Country 2025 & 2033
- Figure 51: Asia Pacific Organic Lamb Revenue (billion), by Application 2025 & 2033
- Figure 52: Asia Pacific Organic Lamb Volume (K), by Application 2025 & 2033
- Figure 53: Asia Pacific Organic Lamb Revenue Share (%), by Application 2025 & 2033
- Figure 54: Asia Pacific Organic Lamb Volume Share (%), by Application 2025 & 2033
- Figure 55: Asia Pacific Organic Lamb Revenue (billion), by Type 2025 & 2033
- Figure 56: Asia Pacific Organic Lamb Volume (K), by Type 2025 & 2033
- Figure 57: Asia Pacific Organic Lamb Revenue Share (%), by Type 2025 & 2033
- Figure 58: Asia Pacific Organic Lamb Volume Share (%), by Type 2025 & 2033
- Figure 59: Asia Pacific Organic Lamb Revenue (billion), by Country 2025 & 2033
- Figure 60: Asia Pacific Organic Lamb Volume (K), by Country 2025 & 2033
- Figure 61: Asia Pacific Organic Lamb Revenue Share (%), by Country 2025 & 2033
- Figure 62: Asia Pacific Organic Lamb Volume Share (%), by Country 2025 & 2033
List of Tables
- Table 1: Global Organic Lamb Revenue billion Forecast, by Application 2020 & 2033
- Table 2: Global Organic Lamb Volume K Forecast, by Application 2020 & 2033
- Table 3: Global Organic Lamb Revenue billion Forecast, by Type 2020 & 2033
- Table 4: Global Organic Lamb Volume K Forecast, by Type 2020 & 2033
- Table 5: Global Organic Lamb Revenue billion Forecast, by Region 2020 & 2033
- Table 6: Global Organic Lamb Volume K Forecast, by Region 2020 & 2033
- Table 7: Global Organic Lamb Revenue billion Forecast, by Application 2020 & 2033
- Table 8: Global Organic Lamb Volume K Forecast, by Application 2020 & 2033
- Table 9: Global Organic Lamb Revenue billion Forecast, by Type 2020 & 2033
- Table 10: Global Organic Lamb Volume K Forecast, by Type 2020 & 2033
- Table 11: Global Organic Lamb Revenue billion Forecast, by Country 2020 & 2033
- Table 12: Global Organic Lamb Volume K Forecast, by Country 2020 & 2033
- Table 13: United States Organic Lamb Revenue (billion) Forecast, by Application 2020 & 2033
- Table 14: United States Organic Lamb Volume (K) Forecast, by Application 2020 & 2033
- Table 15: Canada Organic Lamb Revenue (billion) Forecast, by Application 2020 & 2033
- Table 16: Canada Organic Lamb Volume (K) Forecast, by Application 2020 & 2033
- Table 17: Mexico Organic Lamb Revenue (billion) Forecast, by Application 2020 & 2033
- Table 18: Mexico Organic Lamb Volume (K) Forecast, by Application 2020 & 2033
- Table 19: Global Organic Lamb Revenue billion Forecast, by Application 2020 & 2033
- Table 20: Global Organic Lamb Volume K Forecast, by Application 2020 & 2033
- Table 21: Global Organic Lamb Revenue billion Forecast, by Type 2020 & 2033
- Table 22: Global Organic Lamb Volume K Forecast, by Type 2020 & 2033
- Table 23: Global Organic Lamb Revenue billion Forecast, by Country 2020 & 2033
- Table 24: Global Organic Lamb Volume K Forecast, by Country 2020 & 2033
- Table 25: Brazil Organic Lamb Revenue (billion) Forecast, by Application 2020 & 2033
- Table 26: Brazil Organic Lamb Volume (K) Forecast, by Application 2020 & 2033
- Table 27: Argentina Organic Lamb Revenue (billion) Forecast, by Application 2020 & 2033
- Table 28: Argentina Organic Lamb Volume (K) Forecast, by Application 2020 & 2033
- Table 29: Rest of South America Organic Lamb Revenue (billion) Forecast, by Application 2020 & 2033
- Table 30: Rest of South America Organic Lamb Volume (K) Forecast, by Application 2020 & 2033
- Table 31: Global Organic Lamb Revenue billion Forecast, by Application 2020 & 2033
- Table 32: Global Organic Lamb Volume K Forecast, by Application 2020 & 2033
- Table 33: Global Organic Lamb Revenue billion Forecast, by Type 2020 & 2033
- Table 34: Global Organic Lamb Volume K Forecast, by Type 2020 & 2033
- Table 35: Global Organic Lamb Revenue billion Forecast, by Country 2020 & 2033
- Table 36: Global Organic Lamb Volume K Forecast, by Country 2020 & 2033
- Table 37: United Kingdom Organic Lamb Revenue (billion) Forecast, by Application 2020 & 2033
- Table 38: United Kingdom Organic Lamb Volume (K) Forecast, by Application 2020 & 2033
- Table 39: Germany Organic Lamb Revenue (billion) Forecast, by Application 2020 & 2033
- Table 40: Germany Organic Lamb Volume (K) Forecast, by Application 2020 & 2033
- Table 41: France Organic Lamb Revenue (billion) Forecast, by Application 2020 & 2033
- Table 42: France Organic Lamb Volume (K) Forecast, by Application 2020 & 2033
- Table 43: Italy Organic Lamb Revenue (billion) Forecast, by Application 2020 & 2033
- Table 44: Italy Organic Lamb Volume (K) Forecast, by Application 2020 & 2033
- Table 45: Spain Organic Lamb Revenue (billion) Forecast, by Application 2020 & 2033
- Table 46: Spain Organic Lamb Volume (K) Forecast, by Application 2020 & 2033
- Table 47: Russia Organic Lamb Revenue (billion) Forecast, by Application 2020 & 2033
- Table 48: Russia Organic Lamb Volume (K) Forecast, by Application 2020 & 2033
- Table 49: Benelux Organic Lamb Revenue (billion) Forecast, by Application 2020 & 2033
- Table 50: Benelux Organic Lamb Volume (K) Forecast, by Application 2020 & 2033
- Table 51: Nordics Organic Lamb Revenue (billion) Forecast, by Application 2020 & 2033
- Table 52: Nordics Organic Lamb Volume (K) Forecast, by Application 2020 & 2033
- Table 53: Rest of Europe Organic Lamb Revenue (billion) Forecast, by Application 2020 & 2033
- Table 54: Rest of Europe Organic Lamb Volume (K) Forecast, by Application 2020 & 2033
- Table 55: Global Organic Lamb Revenue billion Forecast, by Application 2020 & 2033
- Table 56: Global Organic Lamb Volume K Forecast, by Application 2020 & 2033
- Table 57: Global Organic Lamb Revenue billion Forecast, by Type 2020 & 2033
- Table 58: Global Organic Lamb Volume K Forecast, by Type 2020 & 2033
- Table 59: Global Organic Lamb Revenue billion Forecast, by Country 2020 & 2033
- Table 60: Global Organic Lamb Volume K Forecast, by Country 2020 & 2033
- Table 61: Turkey Organic Lamb Revenue (billion) Forecast, by Application 2020 & 2033
- Table 62: Turkey Organic Lamb Volume (K) Forecast, by Application 2020 & 2033
- Table 63: Israel Organic Lamb Revenue (billion) Forecast, by Application 2020 & 2033
- Table 64: Israel Organic Lamb Volume (K) Forecast, by Application 2020 & 2033
- Table 65: GCC Organic Lamb Revenue (billion) Forecast, by Application 2020 & 2033
- Table 66: GCC Organic Lamb Volume (K) Forecast, by Application 2020 & 2033
- Table 67: North Africa Organic Lamb Revenue (billion) Forecast, by Application 2020 & 2033
- Table 68: North Africa Organic Lamb Volume (K) Forecast, by Application 2020 & 2033
- Table 69: South Africa Organic Lamb Revenue (billion) Forecast, by Application 2020 & 2033
- Table 70: South Africa Organic Lamb Volume (K) Forecast, by Application 2020 & 2033
- Table 71: Rest of Middle East & Africa Organic Lamb Revenue (billion) Forecast, by Application 2020 & 2033
- Table 72: Rest of Middle East & Africa Organic Lamb Volume (K) Forecast, by Application 2020 & 2033
- Table 73: Global Organic Lamb Revenue billion Forecast, by Application 2020 & 2033
- Table 74: Global Organic Lamb Volume K Forecast, by Application 2020 & 2033
- Table 75: Global Organic Lamb Revenue billion Forecast, by Type 2020 & 2033
- Table 76: Global Organic Lamb Volume K Forecast, by Type 2020 & 2033
- Table 77: Global Organic Lamb Revenue billion Forecast, by Country 2020 & 2033
- Table 78: Global Organic Lamb Volume K Forecast, by Country 2020 & 2033
- Table 79: China Organic Lamb Revenue (billion) Forecast, by Application 2020 & 2033
- Table 80: China Organic Lamb Volume (K) Forecast, by Application 2020 & 2033
- Table 81: India Organic Lamb Revenue (billion) Forecast, by Application 2020 & 2033
- Table 82: India Organic Lamb Volume (K) Forecast, by Application 2020 & 2033
- Table 83: Japan Organic Lamb Revenue (billion) Forecast, by Application 2020 & 2033
- Table 84: Japan Organic Lamb Volume (K) Forecast, by Application 2020 & 2033
- Table 85: South Korea Organic Lamb Revenue (billion) Forecast, by Application 2020 & 2033
- Table 86: South Korea Organic Lamb Volume (K) Forecast, by Application 2020 & 2033
- Table 87: ASEAN Organic Lamb Revenue (billion) Forecast, by Application 2020 & 2033
- Table 88: ASEAN Organic Lamb Volume (K) Forecast, by Application 2020 & 2033
- Table 89: Oceania Organic Lamb Revenue (billion) Forecast, by Application 2020 & 2033
- Table 90: Oceania Organic Lamb Volume (K) Forecast, by Application 2020 & 2033
- Table 91: Rest of Asia Pacific Organic Lamb Revenue (billion) Forecast, by Application 2020 & 2033
- Table 92: Rest of Asia Pacific Organic Lamb Volume (K) Forecast, by Application 2020 & 2033
Frequently Asked Questions
1. What is the projected Compound Annual Growth Rate (CAGR) of the Organic Lamb?
The projected CAGR is approximately 5.5%.
2. Which companies are prominent players in the Organic Lamb?
Key companies in the market include Arcadian Organic and Natural Meat Co., Pty, Thomas Food International, Sunshine Coast Organic Meats, Good Earth Farms, Irish Country Meats, Tulip Ltd, The Lamb Company North America, Niman Ranch, Strauss Brands Incorporated, Pitney Farm Shop, Mallow Farm and Cottage, Colin and Sally's Organic Lamb and Beef, Hollyburton Pick's Organic Farm, Elliott Agriculture Pty Ltd, Swillington Organic Farm Ltd.
3. What are the main segments of the Organic Lamb?
The market segments include Application, Type.
4. Can you provide details about the market size?
The market size is estimated to be USD 4.4 billion as of 2022.
5. What are some drivers contributing to market growth?
N/A
6. What are the notable trends driving market growth?
N/A
7. Are there any restraints impacting market growth?
N/A
8. Can you provide examples of recent developments in the market?
N/A
9. What pricing options are available for accessing the report?
Pricing options include single-user, multi-user, and enterprise licenses priced at USD 3950.00, USD 5925.00, and USD 7900.00 respectively.
10. Is the market size provided in terms of value or volume?
The market size is provided in terms of value, measured in billion and volume, measured in K.
11. Are there any specific market keywords associated with the report?
Yes, the market keyword associated with the report is "Organic Lamb," which aids in identifying and referencing the specific market segment covered.
12. How do I determine which pricing option suits my needs best?
The pricing options vary based on user requirements and access needs. Individual users may opt for single-user licenses, while businesses requiring broader access may choose multi-user or enterprise licenses for cost-effective access to the report.
13. Are there any additional resources or data provided in the Organic Lamb report?
While the report offers comprehensive insights, it's advisable to review the specific contents or supplementary materials provided to ascertain if additional resources or data are available.
14. How can I stay updated on further developments or reports in the Organic Lamb?
To stay informed about further developments, trends, and reports in the Organic Lamb, consider subscribing to industry newsletters, following relevant companies and organizations, or regularly checking reputable industry news sources and publications.
Methodology
Step 1 - Identification of Relevant Samples Size from Population Database


Step 2 - Approaches for Defining Global Market Size (Value, Volume* & Price*)

Note*: In applicable scenarios
Step 3 - Data Sources
Primary Research
- Web Analytics
- Survey Reports
- Research Institute
- Latest Research Reports
- Opinion Leaders
Secondary Research
- Annual Reports
- White Paper
- Latest Press Release
- Industry Association
- Paid Database
- Investor Presentations

Step 4 - Data Triangulation
Involves using different sources of information in order to increase the validity of a study
These sources are likely to be stakeholders in a program - participants, other researchers, program staff, other community members, and so on.
Then we put all data in single framework & apply various statistical tools to find out the dynamic on the market.
During the analysis stage, feedback from the stakeholder groups would be compared to determine areas of agreement as well as areas of divergence