

Key Insights
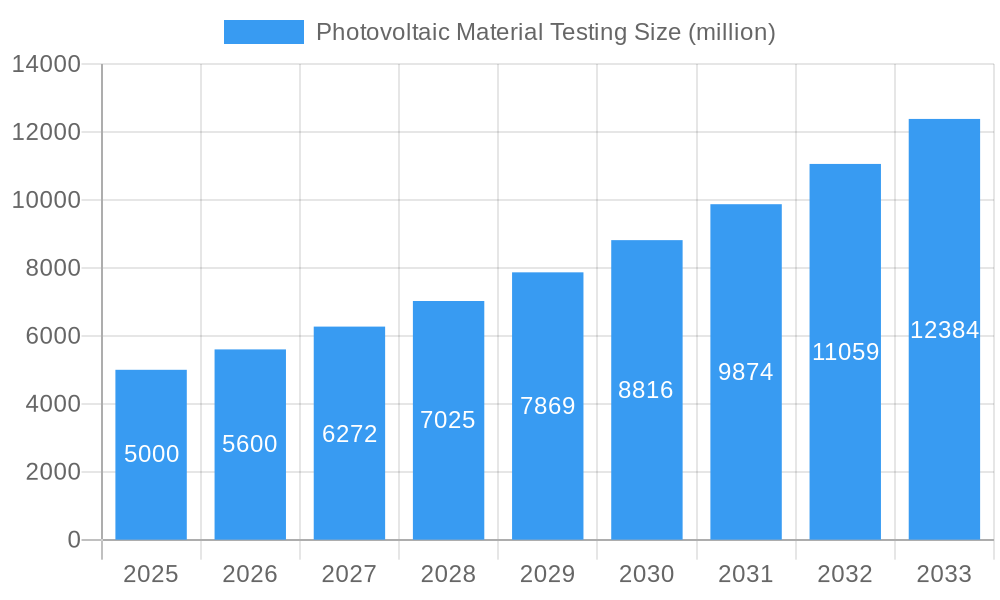
The photovoltaic (PV) material testing market is experiencing robust growth, driven by the global expansion of renewable energy initiatives and increasing demand for efficient and reliable solar energy solutions. The market's size in 2025 is estimated at $5 billion, reflecting a Compound Annual Growth Rate (CAGR) of approximately 12% from 2019 to 2025. This growth is fueled by several key factors: stringent quality control requirements for solar panels, increasing investments in research and development of advanced PV materials, and growing government support for solar energy adoption through subsidies and favorable policies. Major trends include the increasing demand for testing services for advanced PV technologies like Perovskite solar cells and the rising adoption of automated and advanced testing methodologies to improve efficiency and reduce testing time. However, the market faces certain restraints, including the high cost of advanced testing equipment and the need for skilled professionals to operate and interpret the test results.
Photovoltaic Material Testing Market Size (In Billion)
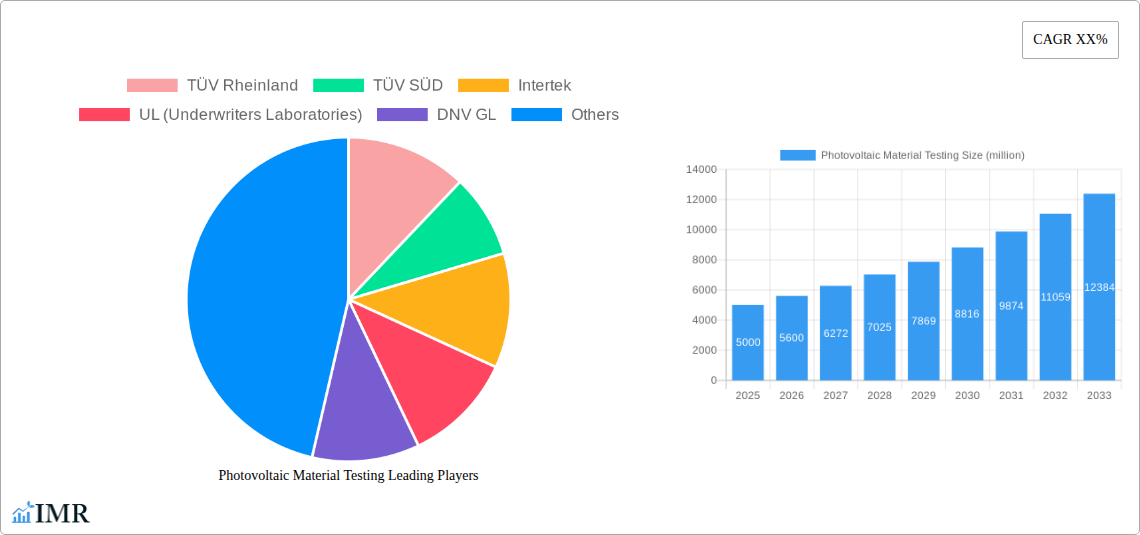
The competitive landscape is characterized by the presence of several prominent global players, including TÜV Rheinland, TÜV SÜD, Intertek, UL, DNV GL, Bureau Veritas, SGS, and others. These companies offer a comprehensive range of testing and certification services across various PV materials, ensuring compliance with international standards. The market segmentation includes testing services for different PV material types (crystalline silicon, thin-film, etc.), testing methods (electrical performance, material characterization, etc.), and geographical regions. The continued growth of the solar energy sector, coupled with innovation in PV materials and testing technologies, indicates a promising outlook for the PV material testing market, with significant opportunities for expansion into emerging markets and the development of specialized testing services for next-generation solar technologies. The forecast period (2025-2033) predicts sustained growth driven by the continued global shift towards clean energy sources and technological advancements within the PV industry.
Photovoltaic Material Testing Company Market Share
Photovoltaic Material Testing Market Report: 2019-2033
This comprehensive report provides an in-depth analysis of the Photovoltaic (PV) Material Testing market, encompassing market dynamics, growth trends, regional segmentation, product landscape, key players, and future outlook. The study period covers 2019-2033, with 2025 as the base and estimated year. The forecast period spans 2025-2033, and the historical period encompasses 2019-2024. This report is crucial for industry professionals, investors, and stakeholders seeking to understand and capitalize on opportunities within the rapidly evolving PV sector. The parent market is the broader renewable energy testing market, while the child market is specifically PV material testing.
Photovoltaic Material Testing Market Dynamics & Structure
The global Photovoltaic Material Testing market, valued at xx million USD in 2025, is characterized by a moderately concentrated landscape. Key players like TÜV Rheinland, TÜV SÜD, Intertek, UL (Underwriters Laboratories), and DNV GL hold significant market share, with the top 5 players accounting for approximately xx% of the total market in 2025. Technological innovation, driven by advancements in PV material science and efficiency demands, is a key driver. Stringent regulatory frameworks and increasing environmental concerns further propel market growth. However, the emergence of substitute technologies and fluctuating raw material prices present challenges.
- Market Concentration: Highly concentrated, with top 5 players controlling xx% in 2025.
- Technological Innovation: Focus on higher efficiency materials, improved testing methods, and automation.
- Regulatory Landscape: Stringent standards and certifications drive demand for testing services.
- Competitive Landscape: Intense competition among established players and emerging service providers.
- M&A Activity: xx major M&A deals recorded between 2019 and 2024, indicating consolidation within the sector. The average deal size was approximately xx million USD.
- End-User Demographics: Primarily comprised of PV manufacturers, solar energy developers, and independent testing organizations.
Photovoltaic Material Testing Growth Trends & Insights
The PV Material Testing market exhibited a CAGR of xx% during the historical period (2019-2024) and is projected to maintain a CAGR of xx% from 2025 to 2033, reaching a market value of xx million USD by 2033. This growth is fueled by the escalating global demand for renewable energy, particularly solar power. The rising adoption of solar PV systems in both residential and utility-scale applications drives the need for rigorous material testing to ensure quality, reliability, and performance. Technological disruptions, such as the introduction of novel PV materials (e.g., perovskites) and advanced testing techniques, are further accelerating market expansion. The shift towards standardized testing protocols and increased awareness of product quality amongst consumers also contribute to market growth. Market penetration in developing economies is also a significant growth factor, expected to reach xx% by 2033.
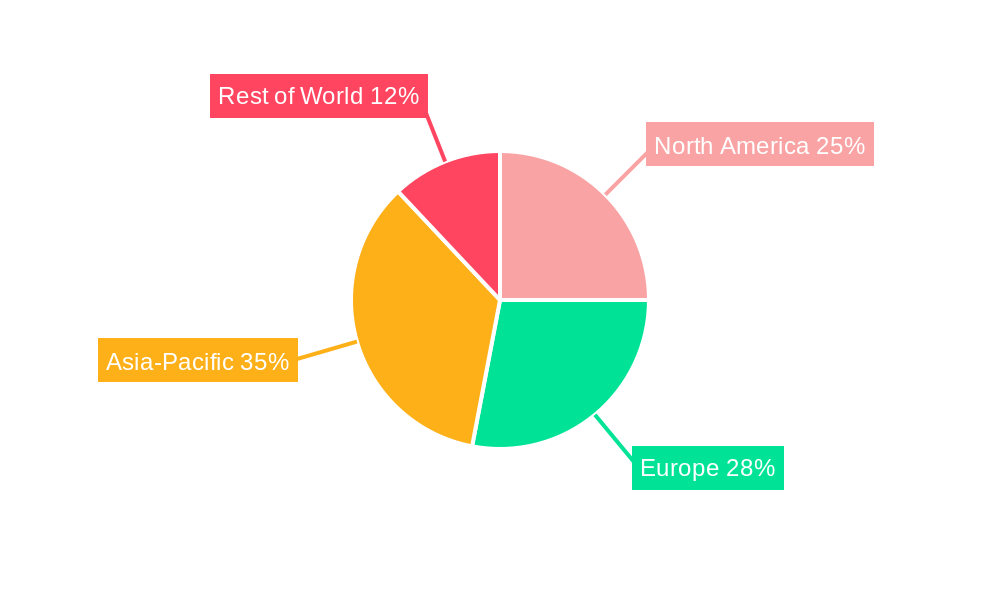
Dominant Regions, Countries, or Segments in Photovoltaic Material Testing
The Asia-Pacific region, particularly China, dominates the global PV Material Testing market, holding a xx% market share in 2025. This dominance is attributed to the substantial growth of the solar PV industry in the region, coupled with supportive government policies promoting renewable energy adoption and stringent quality control regulations. Europe and North America also represent significant markets, driven by strong environmental regulations and a commitment to clean energy initiatives.
- Key Drivers in Asia-Pacific:
- Massive solar PV installations and manufacturing capacity.
- Government support for renewable energy and stringent quality standards.
- Growing demand for reliable and efficient solar energy solutions.
- Key Drivers in Europe & North America:
- Stringent environmental regulations and renewable energy targets.
- High awareness of solar energy benefits amongst consumers.
- Focus on grid integration and stability.
Photovoltaic Material Testing Product Landscape
The PV material testing market offers a wide array of services, including material characterization, performance testing, and reliability assessment. Innovations include advanced spectroscopic techniques, accelerated life testing methods, and automated testing systems. These advancements ensure faster turnaround times, improved accuracy, and reduced testing costs. Unique selling propositions (USPs) include specialized expertise in specific material types (e.g., silicon, thin-film), rapid results, and robust data analysis capabilities. The continued focus on enhancing testing accuracy and reliability, coupled with the development of standardized testing procedures, remains a key area of innovation within the market.
Key Drivers, Barriers & Challenges in Photovoltaic Material Testing
Key Drivers: The increasing demand for renewable energy, stringent regulatory requirements for PV module certification, and the emergence of new PV materials are key drivers. Government incentives and investments in renewable energy infrastructure further accelerate market growth.
Challenges & Restraints: High upfront investment costs for advanced testing equipment, a shortage of skilled technicians, and intense competition among testing laboratories represent major challenges. Supply chain disruptions due to geopolitical events can impact the availability of testing materials and equipment, while evolving regulatory frameworks necessitate continuous adaptation. These factors impact market growth by approximately xx% annually.
Emerging Opportunities in Photovoltaic Material Testing
Emerging opportunities lie in testing novel PV materials like perovskites and organic photovoltaics, as well as the integration of advanced testing techniques with artificial intelligence and machine learning for improved efficiency and data analysis. The growing adoption of distributed generation and rooftop solar applications creates a demand for localized testing services, opening opportunities for smaller, specialized testing laboratories. Untapped markets in developing countries also present significant expansion potential.
Growth Accelerators in the Photovoltaic Material Testing Industry
Technological breakthroughs in testing equipment and methodologies, strategic partnerships between testing laboratories and PV manufacturers, and the expansion of testing services into new geographical markets are key catalysts driving long-term growth. Increased awareness of product quality among consumers and heightened regulatory scrutiny are also accelerating market expansion.
Key Players Shaping the Photovoltaic Material Testing Market
- TÜV Rheinland
- TÜV SÜD
- Intertek
- UL (Underwriters Laboratories)
- DNV GL
- Bureau Veritas
- SGS
- Kiwa
- CSA Group
- TÜV NORD
- Applus+
- CETC Solar Energy
- JinkoSolar
- Hanwha Q CELLS
- LONGi Solar
- Icas Testing Technology Service (Shanghai)
- NOA Group
Notable Milestones in Photovoltaic Material Testing Sector
- 2020: Introduction of a new standardized testing protocol for perovskite solar cells by IEC.
- 2022: Acquisition of a smaller testing laboratory by TÜV SÜD, expanding its market reach.
- 2023: Launch of a fully automated PV material testing system by a major equipment manufacturer.
- 2024: Implementation of stricter regulatory standards for PV module testing in several key markets.
In-Depth Photovoltaic Material Testing Market Outlook
The future of the PV Material Testing market is exceptionally promising, fueled by continuous growth in solar energy adoption, technological innovation, and supportive government policies. Strategic partnerships, geographical expansion, and the development of specialized testing services for next-generation PV materials will create significant opportunities for market participants. The market is expected to maintain a robust growth trajectory, presenting substantial returns on investment for stakeholders involved in this rapidly evolving sector.
Photovoltaic Material Testing Segmentation
-
1. Application
- 1.1. Photovoltaic Material Manufacturers
- 1.2. Photovoltaic Module Manufacturers
- 1.3. Photovoltaic Power Station Operators
- 1.4. Others
-
2. Types
- 2.1. Photovoltaic Silicon Wafer Testing
- 2.2. Photovoltaic Cell Testing
- 2.3. Photovoltaic Module Testing
Photovoltaic Material Testing Segmentation By Geography
-
1. North America
- 1.1. United States
- 1.2. Canada
- 1.3. Mexico
-
2. South America
- 2.1. Brazil
- 2.2. Argentina
- 2.3. Rest of South America
-
3. Europe
- 3.1. United Kingdom
- 3.2. Germany
- 3.3. France
- 3.4. Italy
- 3.5. Spain
- 3.6. Russia
- 3.7. Benelux
- 3.8. Nordics
- 3.9. Rest of Europe
-
4. Middle East & Africa
- 4.1. Turkey
- 4.2. Israel
- 4.3. GCC
- 4.4. North Africa
- 4.5. South Africa
- 4.6. Rest of Middle East & Africa
-
5. Asia Pacific
- 5.1. China
- 5.2. India
- 5.3. Japan
- 5.4. South Korea
- 5.5. ASEAN
- 5.6. Oceania
- 5.7. Rest of Asia Pacific
Photovoltaic Material Testing Regional Market Share
Geographic Coverage of Photovoltaic Material Testing
Photovoltaic Material Testing REPORT HIGHLIGHTS
| Aspects | Details |
|---|---|
| Study Period | 2020-2034 |
| Base Year | 2025 |
| Estimated Year | 2026 |
| Forecast Period | 2026-2034 |
| Historical Period | 2020-2025 |
| Growth Rate | CAGR of 8.92% from 2020-2034 |
| Segmentation |
|
Table of Contents
- 1. Introduction
- 1.1. Research Scope
- 1.2. Market Segmentation
- 1.3. Research Objective
- 1.4. Definitions and Assumptions
- 2. Executive Summary
- 2.1. Market Snapshot
- 3. Market Dynamics
- 3.1. Market Drivers
- 3.2. Market Restrains
- 3.3. Market Trends
- 3.4. Market Opportunities
- 4. Market Factor Analysis
- 4.1. Porters Five Forces
- 4.1.1. Bargaining Power of Suppliers
- 4.1.2. Bargaining Power of Buyers
- 4.1.3. Threat of New Entrants
- 4.1.4. Threat of Substitutes
- 4.1.5. Competitive Rivalry
- 4.2. PESTEL analysis
- 4.3. BCG Analysis
- 4.3.1. Stars (High Growth, High Market Share)
- 4.3.2. Cash Cows (Low Growth, High Market Share)
- 4.3.3. Question Mark (High Growth, Low Market Share)
- 4.3.4. Dogs (Low Growth, Low Market Share)
- 4.4. Ansoff Matrix Analysis
- 4.5. Supply Chain Analysis
- 4.6. Regulatory Landscape
- 4.7. Current Market Potential and Opportunity Assessment (TAM–SAM–SOM Framework)
- 4.8. IMR Analyst Note
- 4.1. Porters Five Forces
- 5. Market Analysis, Insights and Forecast 2021-2033
- 5.1. Market Analysis, Insights and Forecast - by Application
- 5.1.1. Photovoltaic Material Manufacturers
- 5.1.2. Photovoltaic Module Manufacturers
- 5.1.3. Photovoltaic Power Station Operators
- 5.1.4. Others
- 5.2. Market Analysis, Insights and Forecast - by Types
- 5.2.1. Photovoltaic Silicon Wafer Testing
- 5.2.2. Photovoltaic Cell Testing
- 5.2.3. Photovoltaic Module Testing
- 5.3. Market Analysis, Insights and Forecast - by Region
- 5.3.1. North America
- 5.3.2. South America
- 5.3.3. Europe
- 5.3.4. Middle East & Africa
- 5.3.5. Asia Pacific
- 5.1. Market Analysis, Insights and Forecast - by Application
- 6. Global Photovoltaic Material Testing Analysis, Insights and Forecast, 2021-2033
- 6.1. Market Analysis, Insights and Forecast - by Application
- 6.1.1. Photovoltaic Material Manufacturers
- 6.1.2. Photovoltaic Module Manufacturers
- 6.1.3. Photovoltaic Power Station Operators
- 6.1.4. Others
- 6.2. Market Analysis, Insights and Forecast - by Types
- 6.2.1. Photovoltaic Silicon Wafer Testing
- 6.2.2. Photovoltaic Cell Testing
- 6.2.3. Photovoltaic Module Testing
- 6.1. Market Analysis, Insights and Forecast - by Application
- 7. North America Photovoltaic Material Testing Analysis, Insights and Forecast, 2020-2032
- 7.1. Market Analysis, Insights and Forecast - by Application
- 7.1.1. Photovoltaic Material Manufacturers
- 7.1.2. Photovoltaic Module Manufacturers
- 7.1.3. Photovoltaic Power Station Operators
- 7.1.4. Others
- 7.2. Market Analysis, Insights and Forecast - by Types
- 7.2.1. Photovoltaic Silicon Wafer Testing
- 7.2.2. Photovoltaic Cell Testing
- 7.2.3. Photovoltaic Module Testing
- 7.1. Market Analysis, Insights and Forecast - by Application
- 8. South America Photovoltaic Material Testing Analysis, Insights and Forecast, 2020-2032
- 8.1. Market Analysis, Insights and Forecast - by Application
- 8.1.1. Photovoltaic Material Manufacturers
- 8.1.2. Photovoltaic Module Manufacturers
- 8.1.3. Photovoltaic Power Station Operators
- 8.1.4. Others
- 8.2. Market Analysis, Insights and Forecast - by Types
- 8.2.1. Photovoltaic Silicon Wafer Testing
- 8.2.2. Photovoltaic Cell Testing
- 8.2.3. Photovoltaic Module Testing
- 8.1. Market Analysis, Insights and Forecast - by Application
- 9. Europe Photovoltaic Material Testing Analysis, Insights and Forecast, 2020-2032
- 9.1. Market Analysis, Insights and Forecast - by Application
- 9.1.1. Photovoltaic Material Manufacturers
- 9.1.2. Photovoltaic Module Manufacturers
- 9.1.3. Photovoltaic Power Station Operators
- 9.1.4. Others
- 9.2. Market Analysis, Insights and Forecast - by Types
- 9.2.1. Photovoltaic Silicon Wafer Testing
- 9.2.2. Photovoltaic Cell Testing
- 9.2.3. Photovoltaic Module Testing
- 9.1. Market Analysis, Insights and Forecast - by Application
- 10. Middle East & Africa Photovoltaic Material Testing Analysis, Insights and Forecast, 2020-2032
- 10.1. Market Analysis, Insights and Forecast - by Application
- 10.1.1. Photovoltaic Material Manufacturers
- 10.1.2. Photovoltaic Module Manufacturers
- 10.1.3. Photovoltaic Power Station Operators
- 10.1.4. Others
- 10.2. Market Analysis, Insights and Forecast - by Types
- 10.2.1. Photovoltaic Silicon Wafer Testing
- 10.2.2. Photovoltaic Cell Testing
- 10.2.3. Photovoltaic Module Testing
- 10.1. Market Analysis, Insights and Forecast - by Application
- 11. Asia Pacific Photovoltaic Material Testing Analysis, Insights and Forecast, 2020-2032
- 11.1. Market Analysis, Insights and Forecast - by Application
- 11.1.1. Photovoltaic Material Manufacturers
- 11.1.2. Photovoltaic Module Manufacturers
- 11.1.3. Photovoltaic Power Station Operators
- 11.1.4. Others
- 11.2. Market Analysis, Insights and Forecast - by Types
- 11.2.1. Photovoltaic Silicon Wafer Testing
- 11.2.2. Photovoltaic Cell Testing
- 11.2.3. Photovoltaic Module Testing
- 11.1. Market Analysis, Insights and Forecast - by Application
- 12. Competitive Analysis
- 12.1. Company Profiles
- 12.1.1 TÜV Rheinland
- 12.1.1.1. Company Overview
- 12.1.1.2. Products
- 12.1.1.3. Company Financials
- 12.1.1.4. SWOT Analysis
- 12.1.2 TÜV SÜD
- 12.1.2.1. Company Overview
- 12.1.2.2. Products
- 12.1.2.3. Company Financials
- 12.1.2.4. SWOT Analysis
- 12.1.3 Intertek
- 12.1.3.1. Company Overview
- 12.1.3.2. Products
- 12.1.3.3. Company Financials
- 12.1.3.4. SWOT Analysis
- 12.1.4 UL (Underwriters Laboratories)
- 12.1.4.1. Company Overview
- 12.1.4.2. Products
- 12.1.4.3. Company Financials
- 12.1.4.4. SWOT Analysis
- 12.1.5 DNV GL
- 12.1.5.1. Company Overview
- 12.1.5.2. Products
- 12.1.5.3. Company Financials
- 12.1.5.4. SWOT Analysis
- 12.1.6 Bureau Veritas
- 12.1.6.1. Company Overview
- 12.1.6.2. Products
- 12.1.6.3. Company Financials
- 12.1.6.4. SWOT Analysis
- 12.1.7 SGS
- 12.1.7.1. Company Overview
- 12.1.7.2. Products
- 12.1.7.3. Company Financials
- 12.1.7.4. SWOT Analysis
- 12.1.8 Kiwa
- 12.1.8.1. Company Overview
- 12.1.8.2. Products
- 12.1.8.3. Company Financials
- 12.1.8.4. SWOT Analysis
- 12.1.9 CSA Group
- 12.1.9.1. Company Overview
- 12.1.9.2. Products
- 12.1.9.3. Company Financials
- 12.1.9.4. SWOT Analysis
- 12.1.10 TÜV NORD
- 12.1.10.1. Company Overview
- 12.1.10.2. Products
- 12.1.10.3. Company Financials
- 12.1.10.4. SWOT Analysis
- 12.1.11 Applus+
- 12.1.11.1. Company Overview
- 12.1.11.2. Products
- 12.1.11.3. Company Financials
- 12.1.11.4. SWOT Analysis
- 12.1.12 CETC Solar Energy
- 12.1.12.1. Company Overview
- 12.1.12.2. Products
- 12.1.12.3. Company Financials
- 12.1.12.4. SWOT Analysis
- 12.1.13 JinkoSolar
- 12.1.13.1. Company Overview
- 12.1.13.2. Products
- 12.1.13.3. Company Financials
- 12.1.13.4. SWOT Analysis
- 12.1.14 Hanwha Q CELLS
- 12.1.14.1. Company Overview
- 12.1.14.2. Products
- 12.1.14.3. Company Financials
- 12.1.14.4. SWOT Analysis
- 12.1.15 LONGi Solar
- 12.1.15.1. Company Overview
- 12.1.15.2. Products
- 12.1.15.3. Company Financials
- 12.1.15.4. SWOT Analysis
- 12.1.16 Icas Testing Technology Service (Shanghai)
- 12.1.16.1. Company Overview
- 12.1.16.2. Products
- 12.1.16.3. Company Financials
- 12.1.16.4. SWOT Analysis
- 12.1.17 NOA Group
- 12.1.17.1. Company Overview
- 12.1.17.2. Products
- 12.1.17.3. Company Financials
- 12.1.17.4. SWOT Analysis
- 12.1.1 TÜV Rheinland
- 12.2. Market Entropy
- 12.2.1 Company's Key Areas Served
- 12.2.2 Recent Developments
- 12.3. Company Market Share Analysis 2025
- 12.3.1 Top 5 Companies Market Share Analysis
- 12.3.2 Top 3 Companies Market Share Analysis
- 12.4. List of Potential Customers
- 13. Research Methodology
List of Figures
- Figure 1: Global Photovoltaic Material Testing Revenue Breakdown (undefined, %) by Region 2025 & 2033
- Figure 2: North America Photovoltaic Material Testing Revenue (undefined), by Application 2025 & 2033
- Figure 3: North America Photovoltaic Material Testing Revenue Share (%), by Application 2025 & 2033
- Figure 4: North America Photovoltaic Material Testing Revenue (undefined), by Types 2025 & 2033
- Figure 5: North America Photovoltaic Material Testing Revenue Share (%), by Types 2025 & 2033
- Figure 6: North America Photovoltaic Material Testing Revenue (undefined), by Country 2025 & 2033
- Figure 7: North America Photovoltaic Material Testing Revenue Share (%), by Country 2025 & 2033
- Figure 8: South America Photovoltaic Material Testing Revenue (undefined), by Application 2025 & 2033
- Figure 9: South America Photovoltaic Material Testing Revenue Share (%), by Application 2025 & 2033
- Figure 10: South America Photovoltaic Material Testing Revenue (undefined), by Types 2025 & 2033
- Figure 11: South America Photovoltaic Material Testing Revenue Share (%), by Types 2025 & 2033
- Figure 12: South America Photovoltaic Material Testing Revenue (undefined), by Country 2025 & 2033
- Figure 13: South America Photovoltaic Material Testing Revenue Share (%), by Country 2025 & 2033
- Figure 14: Europe Photovoltaic Material Testing Revenue (undefined), by Application 2025 & 2033
- Figure 15: Europe Photovoltaic Material Testing Revenue Share (%), by Application 2025 & 2033
- Figure 16: Europe Photovoltaic Material Testing Revenue (undefined), by Types 2025 & 2033
- Figure 17: Europe Photovoltaic Material Testing Revenue Share (%), by Types 2025 & 2033
- Figure 18: Europe Photovoltaic Material Testing Revenue (undefined), by Country 2025 & 2033
- Figure 19: Europe Photovoltaic Material Testing Revenue Share (%), by Country 2025 & 2033
- Figure 20: Middle East & Africa Photovoltaic Material Testing Revenue (undefined), by Application 2025 & 2033
- Figure 21: Middle East & Africa Photovoltaic Material Testing Revenue Share (%), by Application 2025 & 2033
- Figure 22: Middle East & Africa Photovoltaic Material Testing Revenue (undefined), by Types 2025 & 2033
- Figure 23: Middle East & Africa Photovoltaic Material Testing Revenue Share (%), by Types 2025 & 2033
- Figure 24: Middle East & Africa Photovoltaic Material Testing Revenue (undefined), by Country 2025 & 2033
- Figure 25: Middle East & Africa Photovoltaic Material Testing Revenue Share (%), by Country 2025 & 2033
- Figure 26: Asia Pacific Photovoltaic Material Testing Revenue (undefined), by Application 2025 & 2033
- Figure 27: Asia Pacific Photovoltaic Material Testing Revenue Share (%), by Application 2025 & 2033
- Figure 28: Asia Pacific Photovoltaic Material Testing Revenue (undefined), by Types 2025 & 2033
- Figure 29: Asia Pacific Photovoltaic Material Testing Revenue Share (%), by Types 2025 & 2033
- Figure 30: Asia Pacific Photovoltaic Material Testing Revenue (undefined), by Country 2025 & 2033
- Figure 31: Asia Pacific Photovoltaic Material Testing Revenue Share (%), by Country 2025 & 2033
List of Tables
- Table 1: Global Photovoltaic Material Testing Revenue undefined Forecast, by Application 2020 & 2033
- Table 2: Global Photovoltaic Material Testing Revenue undefined Forecast, by Types 2020 & 2033
- Table 3: Global Photovoltaic Material Testing Revenue undefined Forecast, by Region 2020 & 2033
- Table 4: Global Photovoltaic Material Testing Revenue undefined Forecast, by Application 2020 & 2033
- Table 5: Global Photovoltaic Material Testing Revenue undefined Forecast, by Types 2020 & 2033
- Table 6: Global Photovoltaic Material Testing Revenue undefined Forecast, by Country 2020 & 2033
- Table 7: United States Photovoltaic Material Testing Revenue (undefined) Forecast, by Application 2020 & 2033
- Table 8: Canada Photovoltaic Material Testing Revenue (undefined) Forecast, by Application 2020 & 2033
- Table 9: Mexico Photovoltaic Material Testing Revenue (undefined) Forecast, by Application 2020 & 2033
- Table 10: Global Photovoltaic Material Testing Revenue undefined Forecast, by Application 2020 & 2033
- Table 11: Global Photovoltaic Material Testing Revenue undefined Forecast, by Types 2020 & 2033
- Table 12: Global Photovoltaic Material Testing Revenue undefined Forecast, by Country 2020 & 2033
- Table 13: Brazil Photovoltaic Material Testing Revenue (undefined) Forecast, by Application 2020 & 2033
- Table 14: Argentina Photovoltaic Material Testing Revenue (undefined) Forecast, by Application 2020 & 2033
- Table 15: Rest of South America Photovoltaic Material Testing Revenue (undefined) Forecast, by Application 2020 & 2033
- Table 16: Global Photovoltaic Material Testing Revenue undefined Forecast, by Application 2020 & 2033
- Table 17: Global Photovoltaic Material Testing Revenue undefined Forecast, by Types 2020 & 2033
- Table 18: Global Photovoltaic Material Testing Revenue undefined Forecast, by Country 2020 & 2033
- Table 19: United Kingdom Photovoltaic Material Testing Revenue (undefined) Forecast, by Application 2020 & 2033
- Table 20: Germany Photovoltaic Material Testing Revenue (undefined) Forecast, by Application 2020 & 2033
- Table 21: France Photovoltaic Material Testing Revenue (undefined) Forecast, by Application 2020 & 2033
- Table 22: Italy Photovoltaic Material Testing Revenue (undefined) Forecast, by Application 2020 & 2033
- Table 23: Spain Photovoltaic Material Testing Revenue (undefined) Forecast, by Application 2020 & 2033
- Table 24: Russia Photovoltaic Material Testing Revenue (undefined) Forecast, by Application 2020 & 2033
- Table 25: Benelux Photovoltaic Material Testing Revenue (undefined) Forecast, by Application 2020 & 2033
- Table 26: Nordics Photovoltaic Material Testing Revenue (undefined) Forecast, by Application 2020 & 2033
- Table 27: Rest of Europe Photovoltaic Material Testing Revenue (undefined) Forecast, by Application 2020 & 2033
- Table 28: Global Photovoltaic Material Testing Revenue undefined Forecast, by Application 2020 & 2033
- Table 29: Global Photovoltaic Material Testing Revenue undefined Forecast, by Types 2020 & 2033
- Table 30: Global Photovoltaic Material Testing Revenue undefined Forecast, by Country 2020 & 2033
- Table 31: Turkey Photovoltaic Material Testing Revenue (undefined) Forecast, by Application 2020 & 2033
- Table 32: Israel Photovoltaic Material Testing Revenue (undefined) Forecast, by Application 2020 & 2033
- Table 33: GCC Photovoltaic Material Testing Revenue (undefined) Forecast, by Application 2020 & 2033
- Table 34: North Africa Photovoltaic Material Testing Revenue (undefined) Forecast, by Application 2020 & 2033
- Table 35: South Africa Photovoltaic Material Testing Revenue (undefined) Forecast, by Application 2020 & 2033
- Table 36: Rest of Middle East & Africa Photovoltaic Material Testing Revenue (undefined) Forecast, by Application 2020 & 2033
- Table 37: Global Photovoltaic Material Testing Revenue undefined Forecast, by Application 2020 & 2033
- Table 38: Global Photovoltaic Material Testing Revenue undefined Forecast, by Types 2020 & 2033
- Table 39: Global Photovoltaic Material Testing Revenue undefined Forecast, by Country 2020 & 2033
- Table 40: China Photovoltaic Material Testing Revenue (undefined) Forecast, by Application 2020 & 2033
- Table 41: India Photovoltaic Material Testing Revenue (undefined) Forecast, by Application 2020 & 2033
- Table 42: Japan Photovoltaic Material Testing Revenue (undefined) Forecast, by Application 2020 & 2033
- Table 43: South Korea Photovoltaic Material Testing Revenue (undefined) Forecast, by Application 2020 & 2033
- Table 44: ASEAN Photovoltaic Material Testing Revenue (undefined) Forecast, by Application 2020 & 2033
- Table 45: Oceania Photovoltaic Material Testing Revenue (undefined) Forecast, by Application 2020 & 2033
- Table 46: Rest of Asia Pacific Photovoltaic Material Testing Revenue (undefined) Forecast, by Application 2020 & 2033
Frequently Asked Questions
1. What is the projected Compound Annual Growth Rate (CAGR) of the Photovoltaic Material Testing?
The projected CAGR is approximately 8.92%.
2. Which companies are prominent players in the Photovoltaic Material Testing?
Key companies in the market include TÜV Rheinland, TÜV SÜD, Intertek, UL (Underwriters Laboratories), DNV GL, Bureau Veritas, SGS, Kiwa, CSA Group, TÜV NORD, Applus+, CETC Solar Energy, JinkoSolar, Hanwha Q CELLS, LONGi Solar, Icas Testing Technology Service (Shanghai), NOA Group.
3. What are the main segments of the Photovoltaic Material Testing?
The market segments include Application, Types.
4. Can you provide details about the market size?
The market size is estimated to be USD XXX N/A as of 2022.
5. What are some drivers contributing to market growth?
N/A
6. What are the notable trends driving market growth?
N/A
7. Are there any restraints impacting market growth?
N/A
8. Can you provide examples of recent developments in the market?
N/A
9. What pricing options are available for accessing the report?
Pricing options include single-user, multi-user, and enterprise licenses priced at USD 4350.00, USD 6525.00, and USD 8700.00 respectively.
10. Is the market size provided in terms of value or volume?
The market size is provided in terms of value, measured in N/A.
11. Are there any specific market keywords associated with the report?
Yes, the market keyword associated with the report is "Photovoltaic Material Testing," which aids in identifying and referencing the specific market segment covered.
12. How do I determine which pricing option suits my needs best?
The pricing options vary based on user requirements and access needs. Individual users may opt for single-user licenses, while businesses requiring broader access may choose multi-user or enterprise licenses for cost-effective access to the report.
13. Are there any additional resources or data provided in the Photovoltaic Material Testing report?
While the report offers comprehensive insights, it's advisable to review the specific contents or supplementary materials provided to ascertain if additional resources or data are available.
14. How can I stay updated on further developments or reports in the Photovoltaic Material Testing?
To stay informed about further developments, trends, and reports in the Photovoltaic Material Testing, consider subscribing to industry newsletters, following relevant companies and organizations, or regularly checking reputable industry news sources and publications.
Methodology
Step 1 - Identification of Relevant Samples Size from Population Database


Step 2 - Approaches for Defining Global Market Size (Value, Volume* & Price*)

Note*: In applicable scenarios
Step 3 - Data Sources
Primary Research
- Web Analytics
- Survey Reports
- Research Institute
- Latest Research Reports
- Opinion Leaders
Secondary Research
- Annual Reports
- White Paper
- Latest Press Release
- Industry Association
- Paid Database
- Investor Presentations

Step 4 - Data Triangulation
Involves using different sources of information in order to increase the validity of a study
These sources are likely to be stakeholders in a program - participants, other researchers, program staff, other community members, and so on.
Then we put all data in single framework & apply various statistical tools to find out the dynamic on the market.
During the analysis stage, feedback from the stakeholder groups would be compared to determine areas of agreement as well as areas of divergence