

Key Insights
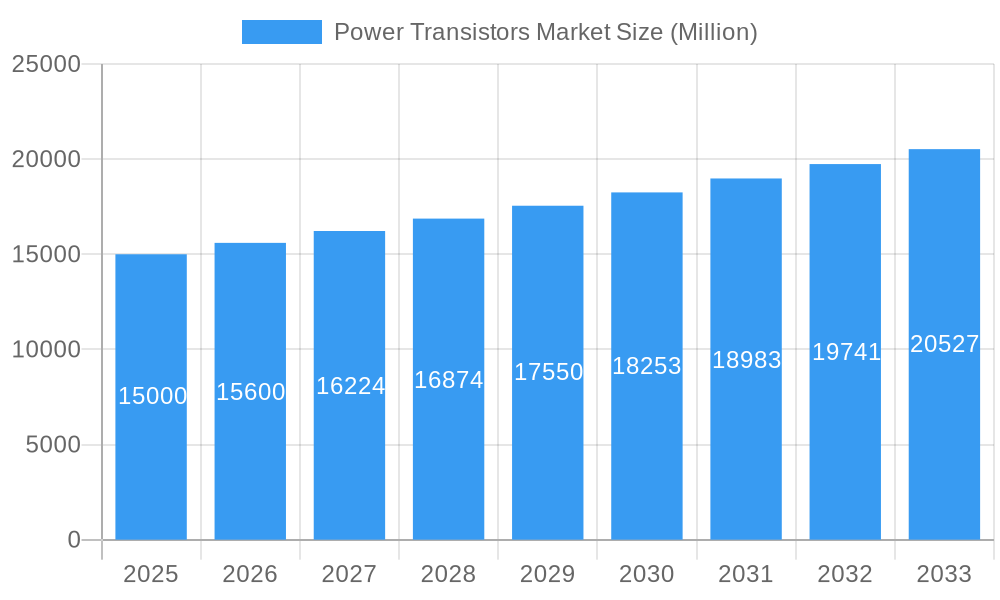
The global power transistors market, valued at $15.82 billion in 2024, is projected for robust expansion at a compound annual growth rate (CAGR) of 8.15% from 2024 to 2033. This significant growth is propelled by the escalating demand for high-efficiency electronics across numerous industries. The automotive sector's rapid adoption of electric vehicles (EVs) and hybrid electric vehicles (HEVs) is a primary driver, necessitating advanced power transistors for critical functions such as motor control and battery management. Concurrently, the burgeoning renewable energy sector, particularly solar power inverters and wind turbine systems, fuels demand for efficient power conversion solutions. The continuous evolution of the telecommunications industry and the widespread deployment of 5G technology further amplify the need for high-frequency power transistors. While potential supply chain volatility and raw material price fluctuations present challenges, these are largely mitigated by the potent underlying growth drivers. Market segmentation by transistor type, including HEMT, BJT, FET, MET, and Dual Gate MOSFET, underscores the diverse applications and technological advancements. HEMTs and FETs are anticipated to lead market share due to their superior performance in high-frequency and high-power applications. Segmentation by end-user industries highlights significant demand from aerospace & defense, industrial automation, and telecommunications.
Power Transistors Market Market Size (In Billion)
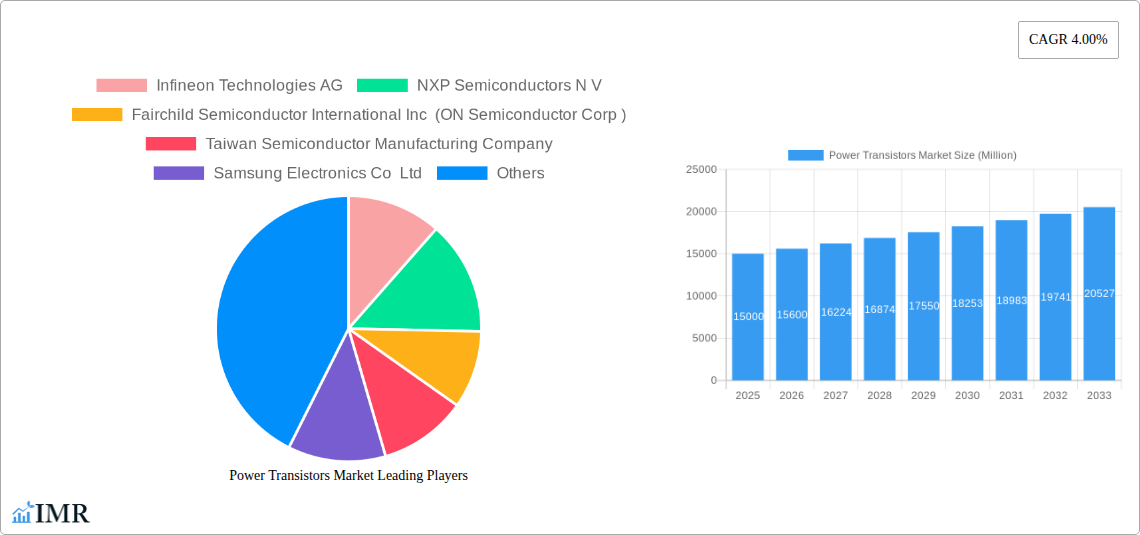
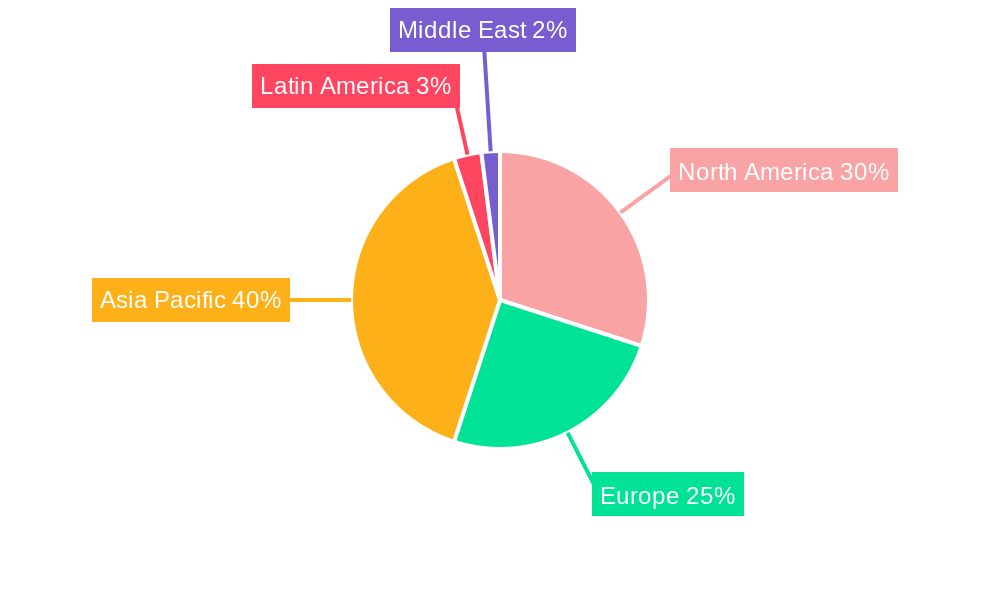
Key players within the power transistor market, including Infineon Technologies AG, NXP Semiconductors, ON Semiconductor, TSMC, and Samsung Electronics, are committed to ongoing research and development to enhance transistor performance and efficiency. This competitive environment stimulates innovation in advanced materials and manufacturing processes. Geographically, the Asia Pacific region is poised to dominate the market, supported by its robust manufacturing capabilities and substantial electronics consumption. North America and Europe are also expected to be significant contributors, driven by high technological adoption and strong industrial demand. The forecast period from 2024 to 2033 indicates sustained market growth, promising a favorable outlook for the industry. Detailed regional market share analysis and segment-specific sales data would offer further comprehensive market insights.
Power Transistors Market Company Market Share
Power Transistors Market: A Comprehensive Report (2019-2033)
This comprehensive report provides an in-depth analysis of the Power Transistors Market, encompassing market dynamics, growth trends, regional dominance, product landscape, key players, and future outlook. The study period covers 2019-2033, with 2025 as the base and estimated year. The report offers valuable insights for industry professionals, investors, and stakeholders seeking to understand and capitalize on the opportunities within this dynamic market. The market is segmented by type (High Electron Mobility Transistor (HEMT), Bipolar Junction Transistor (BJT), Field Effect Transistors (FET), Multiple Emitter Transistor (MET), Dual Gate Metal Oxide Semiconductor Field Effective Transistor) and end-user industry (Aerospace & Defense, Industrial, Telecommunications, Consumer Electronics). The total market size is predicted to reach xx Million units by 2033.
Power Transistors Market Market Dynamics & Structure
The Power Transistors market is characterized by a moderately concentrated landscape, with key players such as Infineon Technologies AG, NXP Semiconductors N.V., ON Semiconductor (formerly Fairchild Semiconductor), Taiwan Semiconductor Manufacturing Company, Samsung Electronics Co. Ltd., Microchip Technology Inc., STMicroelectronics N.V., GLOBALFOUNDRIES Inc., Texas Instruments Incorporated, and Intel Corporation holding significant market share. The exact percentage for each player will vary throughout the forecast period. However, market share dynamics are subject to constant flux due to technological advancements and strategic acquisitions.
- Market Concentration: The market exhibits moderate concentration, with the top five players accounting for approximately xx% of the global market in 2024.
- Technological Innovation: Continuous innovation in materials science (e.g., GaN, SiC) and transistor architectures (e.g., HEMT) drives market growth, enabling higher power efficiency and switching frequencies. This requires significant R&D investment, creating a barrier to entry for new players.
- Regulatory Frameworks: Government regulations concerning energy efficiency and emissions standards significantly impact market demand, particularly in the automotive and industrial sectors. Stringent environmental regulations are pushing the adoption of energy-efficient power transistors.
- Competitive Product Substitutes: While power transistors dominate their niche, competing technologies like IGBTs (Insulated Gate Bipolar Transistors) and thyristors exist, but the power transistor market continues to demonstrate significant growth due to its inherent advantages.
- End-User Demographics: The diverse end-user base, including consumer electronics, telecommunications, automotive, and industrial applications, contributes to the market's broad appeal and consistent growth. The increasing demand from the automotive sector is expected to drive significant growth in the forecast period.
- M&A Trends: The Power Transistors market has witnessed a moderate level of mergers and acquisitions (M&As) in recent years, with strategic acquisitions primarily aimed at expanding product portfolios and strengthening market positions. Approximately xx M&A deals were recorded between 2019 and 2024.
Power Transistors Market Growth Trends & Insights
The Power Transistors market is experiencing robust growth, driven by increasing demand across various end-use sectors. The market size was valued at xx Million units in 2019 and is projected to reach xx Million units by 2025, exhibiting a CAGR of xx% during the historical period (2019-2024). This growth trajectory is expected to continue into the forecast period (2025-2033), with a projected CAGR of xx%.
The rising adoption of power transistors in energy-efficient electronics, electric vehicles, renewable energy systems, and advanced communication infrastructure fuels this expansion. Technological advancements like the adoption of GaN and SiC technologies are significantly improving power efficiency and switching speed, leading to increased adoption rates in high-performance applications. Changes in consumer behavior, such as the growing demand for portable and energy-efficient devices, also contribute to market growth. Market penetration is steadily increasing across all major segments, with particularly strong growth observed in the automotive and renewable energy sectors. Disruptive technologies like wide bandgap semiconductors are reshaping the market landscape, pushing the boundaries of efficiency and performance.
Dominant Regions, Countries, or Segments in Power Transistors Market
The Power Transistors market displays regional variations in growth and dominance. North America and Asia-Pacific currently hold significant market shares. While precise figures will be detailed in the full report, a trend towards growth in the Asia-Pacific region, particularly China and India, is visible, attributed to strong manufacturing hubs and rapidly expanding electronics industries.
- By Type: Field Effect Transistors (FETs) currently hold the largest market share, driven by their versatility and widespread adoption across various applications. However, High Electron Mobility Transistors (HEMTs) are gaining traction due to their superior performance characteristics in high-frequency applications.
- By End-User Industry: The telecommunications and consumer electronics sectors are major contributors to market growth. However, the rapidly expanding electric vehicle and renewable energy sectors are expected to be significant drivers of future growth.
- Key Drivers:
- Strong economic growth in emerging economies.
- Favorable government policies promoting renewable energy adoption and technological advancement.
- Growing demand for energy-efficient electronics.
- Advancements in semiconductor technology.
- Dominance Factors: The dominance of certain regions and segments is largely attributed to factors such as established manufacturing infrastructure, higher per capita income levels, technological innovation, and supportive government policies.
Power Transistors Market Product Landscape
Power transistors are available in a wide range of configurations, each optimized for specific applications. Recent innovations focus on increasing power efficiency, switching speed, and thermal management. This includes the development of GaN and SiC-based transistors, which offer significantly improved performance compared to traditional silicon-based devices. Manufacturers are emphasizing miniaturization, improved thermal dissipation, and enhanced reliability to meet the demands of advanced electronic systems. Unique selling propositions include higher power density, lower on-resistance, and enhanced switching speeds, catering to the increasing demand for high-performance applications in sectors like electric vehicles, 5G infrastructure, and renewable energy.
Key Drivers, Barriers & Challenges in Power Transistors Market
Key Drivers:
The increasing demand for energy-efficient electronics and electric vehicles, coupled with technological advancements in semiconductor materials (GaN, SiC), are primary drivers. Government regulations promoting energy efficiency also stimulate market growth. The expanding adoption of renewable energy sources further fuels the need for advanced power transistors.
Key Challenges & Restraints:
High production costs associated with advanced materials like GaN and SiC pose a significant challenge. Supply chain disruptions, especially concerning raw materials and manufacturing capacity, can impact production and pricing. Furthermore, intense competition among established players and the emergence of new entrants create pressure on margins and market share. Stringent quality and reliability standards also add to the cost and complexity of manufacturing.
Emerging Opportunities in Power Transistors Market
Untapped markets in developing economies, particularly in the renewable energy and electric vehicle sectors, offer significant growth opportunities. The increasing demand for high-frequency applications in 5G infrastructure and advanced communication systems creates a substantial demand for high-performance power transistors. Innovative applications in areas like smart grids, industrial automation, and medical devices are also driving market expansion.
Growth Accelerators in the Power Transistors Market Industry
Technological breakthroughs in wide bandgap semiconductor materials (GaN, SiC) are key growth accelerators. Strategic partnerships between manufacturers and end-users foster innovation and accelerate market adoption. Expansion into emerging markets, especially in Asia-Pacific and developing countries, fuels long-term market growth. Investments in research and development aimed at improving efficiency and performance further accelerate market expansion.
Key Players Shaping the Power Transistors Market Market
- Infineon Technologies AG
- NXP Semiconductors N.V.
- ON Semiconductor (formerly Fairchild Semiconductor)
- Taiwan Semiconductor Manufacturing Company
- Samsung Electronics Co. Ltd.
- Microchip Technology Inc.
- STMicroelectronics N.V.
- GLOBALFOUNDRIES Inc.
- Texas Instruments Incorporated
- Intel Corporation
Notable Milestones in Power Transistors Market Sector
- September 2022: EPC Power Conversion Corporation announced the EPC2050, a 350 V GaN transistor with a maximum RDS(on) of 80 mΩ and a pulsed output current of 26 A. This signifies a significant advancement in miniaturization and power efficiency.
- July 2022: Magnachip Semiconductor Corporation unveiled a new 24V MOSFET for wireless earphone batteries, enhancing battery life and fast charging capabilities. This highlights the growing demand for power-efficient solutions in consumer electronics.
- March 2022: NXP Semiconductors announced new RF GaN power transistors for 32T32R active antenna systems, demonstrating advancements in 5G technology. This underscores the importance of GaN technology in high-frequency applications.
In-Depth Power Transistors Market Market Outlook
The Power Transistors market is poised for sustained growth, driven by technological advancements, increasing demand across diverse sectors, and favorable government policies. Strategic investments in R&D, coupled with strategic partnerships and market expansion initiatives, will further enhance market growth. The ongoing shift towards energy-efficient and high-performance electronic devices will drive demand for advanced power transistors, creating significant opportunities for manufacturers and investors alike. The continued development of innovative materials and transistor architectures will ensure the market remains dynamic and vibrant in the coming years.
Power Transistors Market Segmentation
-
1. Type
- 1.1. High Electron Mobility Transistor (HEMT)
- 1.2. Bipolar Junction Transistor (BJT)
- 1.3. Field Effect Transistors (FET)
- 1.4. Multiple Emitter Transistor (MET)
- 1.5. Dual Gat
-
2. End User Industry
- 2.1. Aerospace & Defense
- 2.2. Industrial
- 2.3. Telecommunications
- 2.4. Consumer Electronics
Power Transistors Market Segmentation By Geography
- 1. North America
- 2. Europe
- 3. Asia Pacific
- 4. Latin America
- 5. Middle East
Power Transistors Market Regional Market Share
Geographic Coverage of Power Transistors Market
Power Transistors Market REPORT HIGHLIGHTS
| Aspects | Details |
|---|---|
| Study Period | 2020-2034 |
| Base Year | 2025 |
| Estimated Year | 2026 |
| Forecast Period | 2026-2034 |
| Historical Period | 2020-2025 |
| Growth Rate | CAGR of 8.15% from 2020-2034 |
| Segmentation |
|
Table of Contents
- 1. Introduction
- 1.1. Research Scope
- 1.2. Market Segmentation
- 1.3. Research Objective
- 1.4. Definitions and Assumptions
- 2. Executive Summary
- 2.1. Market Snapshot
- 3. Market Dynamics
- 3.1. Market Drivers
- 3.2. Market Restrains
- 3.3. Market Trends
- 3.4. Market Opportunities
- 4. Market Factor Analysis
- 4.1. Porters Five Forces
- 4.1.1. Bargaining Power of Suppliers
- 4.1.2. Bargaining Power of Buyers
- 4.1.3. Threat of New Entrants
- 4.1.4. Threat of Substitutes
- 4.1.5. Competitive Rivalry
- 4.2. PESTEL analysis
- 4.3. BCG Analysis
- 4.3.1. Stars (High Growth, High Market Share)
- 4.3.2. Cash Cows (Low Growth, High Market Share)
- 4.3.3. Question Mark (High Growth, Low Market Share)
- 4.3.4. Dogs (Low Growth, Low Market Share)
- 4.4. Ansoff Matrix Analysis
- 4.5. Supply Chain Analysis
- 4.6. Regulatory Landscape
- 4.7. Current Market Potential and Opportunity Assessment (TAM–SAM–SOM Framework)
- 4.8. IMR Analyst Note
- 4.1. Porters Five Forces
- 5. Market Analysis, Insights and Forecast 2021-2033
- 5.1. Market Analysis, Insights and Forecast - by Type
- 5.1.1. High Electron Mobility Transistor (HEMT)
- 5.1.2. Bipolar Junction Transistor (BJT)
- 5.1.3. Field Effect Transistors (FET)
- 5.1.4. Multiple Emitter Transistor (MET)
- 5.1.5. Dual Gat
- 5.2. Market Analysis, Insights and Forecast - by End User Industry
- 5.2.1. Aerospace & Defense
- 5.2.2. Industrial
- 5.2.3. Telecommunications
- 5.2.4. Consumer Electronics
- 5.3. Market Analysis, Insights and Forecast - by Region
- 5.3.1. North America
- 5.3.2. Europe
- 5.3.3. Asia Pacific
- 5.3.4. Latin America
- 5.3.5. Middle East
- 5.1. Market Analysis, Insights and Forecast - by Type
- 6. Global Power Transistors Market Analysis, Insights and Forecast, 2021-2033
- 6.1. Market Analysis, Insights and Forecast - by Type
- 6.1.1. High Electron Mobility Transistor (HEMT)
- 6.1.2. Bipolar Junction Transistor (BJT)
- 6.1.3. Field Effect Transistors (FET)
- 6.1.4. Multiple Emitter Transistor (MET)
- 6.1.5. Dual Gat
- 6.2. Market Analysis, Insights and Forecast - by End User Industry
- 6.2.1. Aerospace & Defense
- 6.2.2. Industrial
- 6.2.3. Telecommunications
- 6.2.4. Consumer Electronics
- 6.1. Market Analysis, Insights and Forecast - by Type
- 7. North America Power Transistors Market Analysis, Insights and Forecast, 2020-2032
- 7.1. Market Analysis, Insights and Forecast - by Type
- 7.1.1. High Electron Mobility Transistor (HEMT)
- 7.1.2. Bipolar Junction Transistor (BJT)
- 7.1.3. Field Effect Transistors (FET)
- 7.1.4. Multiple Emitter Transistor (MET)
- 7.1.5. Dual Gat
- 7.2. Market Analysis, Insights and Forecast - by End User Industry
- 7.2.1. Aerospace & Defense
- 7.2.2. Industrial
- 7.2.3. Telecommunications
- 7.2.4. Consumer Electronics
- 7.1. Market Analysis, Insights and Forecast - by Type
- 8. Europe Power Transistors Market Analysis, Insights and Forecast, 2020-2032
- 8.1. Market Analysis, Insights and Forecast - by Type
- 8.1.1. High Electron Mobility Transistor (HEMT)
- 8.1.2. Bipolar Junction Transistor (BJT)
- 8.1.3. Field Effect Transistors (FET)
- 8.1.4. Multiple Emitter Transistor (MET)
- 8.1.5. Dual Gat
- 8.2. Market Analysis, Insights and Forecast - by End User Industry
- 8.2.1. Aerospace & Defense
- 8.2.2. Industrial
- 8.2.3. Telecommunications
- 8.2.4. Consumer Electronics
- 8.1. Market Analysis, Insights and Forecast - by Type
- 9. Asia Pacific Power Transistors Market Analysis, Insights and Forecast, 2020-2032
- 9.1. Market Analysis, Insights and Forecast - by Type
- 9.1.1. High Electron Mobility Transistor (HEMT)
- 9.1.2. Bipolar Junction Transistor (BJT)
- 9.1.3. Field Effect Transistors (FET)
- 9.1.4. Multiple Emitter Transistor (MET)
- 9.1.5. Dual Gat
- 9.2. Market Analysis, Insights and Forecast - by End User Industry
- 9.2.1. Aerospace & Defense
- 9.2.2. Industrial
- 9.2.3. Telecommunications
- 9.2.4. Consumer Electronics
- 9.1. Market Analysis, Insights and Forecast - by Type
- 10. Latin America Power Transistors Market Analysis, Insights and Forecast, 2020-2032
- 10.1. Market Analysis, Insights and Forecast - by Type
- 10.1.1. High Electron Mobility Transistor (HEMT)
- 10.1.2. Bipolar Junction Transistor (BJT)
- 10.1.3. Field Effect Transistors (FET)
- 10.1.4. Multiple Emitter Transistor (MET)
- 10.1.5. Dual Gat
- 10.2. Market Analysis, Insights and Forecast - by End User Industry
- 10.2.1. Aerospace & Defense
- 10.2.2. Industrial
- 10.2.3. Telecommunications
- 10.2.4. Consumer Electronics
- 10.1. Market Analysis, Insights and Forecast - by Type
- 11. Middle East Power Transistors Market Analysis, Insights and Forecast, 2020-2032
- 11.1. Market Analysis, Insights and Forecast - by Type
- 11.1.1. High Electron Mobility Transistor (HEMT)
- 11.1.2. Bipolar Junction Transistor (BJT)
- 11.1.3. Field Effect Transistors (FET)
- 11.1.4. Multiple Emitter Transistor (MET)
- 11.1.5. Dual Gat
- 11.2. Market Analysis, Insights and Forecast - by End User Industry
- 11.2.1. Aerospace & Defense
- 11.2.2. Industrial
- 11.2.3. Telecommunications
- 11.2.4. Consumer Electronics
- 11.1. Market Analysis, Insights and Forecast - by Type
- 12. Competitive Analysis
- 12.1. Company Profiles
- 12.1.1 Infineon Technologies AG
- 12.1.1.1. Company Overview
- 12.1.1.2. Products
- 12.1.1.3. Company Financials
- 12.1.1.4. SWOT Analysis
- 12.1.2 NXP Semiconductors N V
- 12.1.2.1. Company Overview
- 12.1.2.2. Products
- 12.1.2.3. Company Financials
- 12.1.2.4. SWOT Analysis
- 12.1.3 Fairchild Semiconductor International Inc (ON Semiconductor Corp )
- 12.1.3.1. Company Overview
- 12.1.3.2. Products
- 12.1.3.3. Company Financials
- 12.1.3.4. SWOT Analysis
- 12.1.4 Taiwan Semiconductor Manufacturing Company
- 12.1.4.1. Company Overview
- 12.1.4.2. Products
- 12.1.4.3. Company Financials
- 12.1.4.4. SWOT Analysis
- 12.1.5 Samsung Electronics Co Ltd
- 12.1.5.1. Company Overview
- 12.1.5.2. Products
- 12.1.5.3. Company Financials
- 12.1.5.4. SWOT Analysis
- 12.1.6 Microchip Technology Inc *List Not Exhaustive
- 12.1.6.1. Company Overview
- 12.1.6.2. Products
- 12.1.6.3. Company Financials
- 12.1.6.4. SWOT Analysis
- 12.1.7 STMicroelectronics N V
- 12.1.7.1. Company Overview
- 12.1.7.2. Products
- 12.1.7.3. Company Financials
- 12.1.7.4. SWOT Analysis
- 12.1.8 GLOBALFOUNDRIES Inc
- 12.1.8.1. Company Overview
- 12.1.8.2. Products
- 12.1.8.3. Company Financials
- 12.1.8.4. SWOT Analysis
- 12.1.9 Texas Instruments Incorporated
- 12.1.9.1. Company Overview
- 12.1.9.2. Products
- 12.1.9.3. Company Financials
- 12.1.9.4. SWOT Analysis
- 12.1.10 Intel Corporation
- 12.1.10.1. Company Overview
- 12.1.10.2. Products
- 12.1.10.3. Company Financials
- 12.1.10.4. SWOT Analysis
- 12.1.1 Infineon Technologies AG
- 12.2. Market Entropy
- 12.2.1 Company's Key Areas Served
- 12.2.2 Recent Developments
- 12.3. Company Market Share Analysis 2025
- 12.3.1 Top 5 Companies Market Share Analysis
- 12.3.2 Top 3 Companies Market Share Analysis
- 12.4. List of Potential Customers
- 13. Research Methodology
List of Figures
- Figure 1: Global Power Transistors Market Revenue Breakdown (billion, %) by Region 2025 & 2033
- Figure 2: North America Power Transistors Market Revenue (billion), by Type 2025 & 2033
- Figure 3: North America Power Transistors Market Revenue Share (%), by Type 2025 & 2033
- Figure 4: North America Power Transistors Market Revenue (billion), by End User Industry 2025 & 2033
- Figure 5: North America Power Transistors Market Revenue Share (%), by End User Industry 2025 & 2033
- Figure 6: North America Power Transistors Market Revenue (billion), by Country 2025 & 2033
- Figure 7: North America Power Transistors Market Revenue Share (%), by Country 2025 & 2033
- Figure 8: Europe Power Transistors Market Revenue (billion), by Type 2025 & 2033
- Figure 9: Europe Power Transistors Market Revenue Share (%), by Type 2025 & 2033
- Figure 10: Europe Power Transistors Market Revenue (billion), by End User Industry 2025 & 2033
- Figure 11: Europe Power Transistors Market Revenue Share (%), by End User Industry 2025 & 2033
- Figure 12: Europe Power Transistors Market Revenue (billion), by Country 2025 & 2033
- Figure 13: Europe Power Transistors Market Revenue Share (%), by Country 2025 & 2033
- Figure 14: Asia Pacific Power Transistors Market Revenue (billion), by Type 2025 & 2033
- Figure 15: Asia Pacific Power Transistors Market Revenue Share (%), by Type 2025 & 2033
- Figure 16: Asia Pacific Power Transistors Market Revenue (billion), by End User Industry 2025 & 2033
- Figure 17: Asia Pacific Power Transistors Market Revenue Share (%), by End User Industry 2025 & 2033
- Figure 18: Asia Pacific Power Transistors Market Revenue (billion), by Country 2025 & 2033
- Figure 19: Asia Pacific Power Transistors Market Revenue Share (%), by Country 2025 & 2033
- Figure 20: Latin America Power Transistors Market Revenue (billion), by Type 2025 & 2033
- Figure 21: Latin America Power Transistors Market Revenue Share (%), by Type 2025 & 2033
- Figure 22: Latin America Power Transistors Market Revenue (billion), by End User Industry 2025 & 2033
- Figure 23: Latin America Power Transistors Market Revenue Share (%), by End User Industry 2025 & 2033
- Figure 24: Latin America Power Transistors Market Revenue (billion), by Country 2025 & 2033
- Figure 25: Latin America Power Transistors Market Revenue Share (%), by Country 2025 & 2033
- Figure 26: Middle East Power Transistors Market Revenue (billion), by Type 2025 & 2033
- Figure 27: Middle East Power Transistors Market Revenue Share (%), by Type 2025 & 2033
- Figure 28: Middle East Power Transistors Market Revenue (billion), by End User Industry 2025 & 2033
- Figure 29: Middle East Power Transistors Market Revenue Share (%), by End User Industry 2025 & 2033
- Figure 30: Middle East Power Transistors Market Revenue (billion), by Country 2025 & 2033
- Figure 31: Middle East Power Transistors Market Revenue Share (%), by Country 2025 & 2033
List of Tables
- Table 1: Global Power Transistors Market Revenue billion Forecast, by Type 2020 & 2033
- Table 2: Global Power Transistors Market Revenue billion Forecast, by End User Industry 2020 & 2033
- Table 3: Global Power Transistors Market Revenue billion Forecast, by Region 2020 & 2033
- Table 4: Global Power Transistors Market Revenue billion Forecast, by Type 2020 & 2033
- Table 5: Global Power Transistors Market Revenue billion Forecast, by End User Industry 2020 & 2033
- Table 6: Global Power Transistors Market Revenue billion Forecast, by Country 2020 & 2033
- Table 7: Global Power Transistors Market Revenue billion Forecast, by Type 2020 & 2033
- Table 8: Global Power Transistors Market Revenue billion Forecast, by End User Industry 2020 & 2033
- Table 9: Global Power Transistors Market Revenue billion Forecast, by Country 2020 & 2033
- Table 10: Global Power Transistors Market Revenue billion Forecast, by Type 2020 & 2033
- Table 11: Global Power Transistors Market Revenue billion Forecast, by End User Industry 2020 & 2033
- Table 12: Global Power Transistors Market Revenue billion Forecast, by Country 2020 & 2033
- Table 13: Global Power Transistors Market Revenue billion Forecast, by Type 2020 & 2033
- Table 14: Global Power Transistors Market Revenue billion Forecast, by End User Industry 2020 & 2033
- Table 15: Global Power Transistors Market Revenue billion Forecast, by Country 2020 & 2033
- Table 16: Global Power Transistors Market Revenue billion Forecast, by Type 2020 & 2033
- Table 17: Global Power Transistors Market Revenue billion Forecast, by End User Industry 2020 & 2033
- Table 18: Global Power Transistors Market Revenue billion Forecast, by Country 2020 & 2033
Frequently Asked Questions
1. What is the projected Compound Annual Growth Rate (CAGR) of the Power Transistors Market?
The projected CAGR is approximately 8.15%.
2. Which companies are prominent players in the Power Transistors Market?
Key companies in the market include Infineon Technologies AG, NXP Semiconductors N V, Fairchild Semiconductor International Inc (ON Semiconductor Corp ), Taiwan Semiconductor Manufacturing Company, Samsung Electronics Co Ltd, Microchip Technology Inc *List Not Exhaustive, STMicroelectronics N V, GLOBALFOUNDRIES Inc, Texas Instruments Incorporated, Intel Corporation.
3. What are the main segments of the Power Transistors Market?
The market segments include Type, End User Industry.
4. Can you provide details about the market size?
The market size is estimated to be USD 15.82 billion as of 2022.
5. What are some drivers contributing to market growth?
Technological Advancements Leading To Demand for Increasing Device Densities; Proliferation of Consumer Electronics.
6. What are the notable trends driving market growth?
Increasing adoption of High Electron Mobility Transistor (HEMT).
7. Are there any restraints impacting market growth?
Cost of Maintaining Moore's Law is Getting Higher with Low Returns.
8. Can you provide examples of recent developments in the market?
September 2022 - EPC Power Conversion Corporation announced the EPC2050, a 350 V GaN transistor with a maximum RDS(on) of 80 mΩ and a pulsed output current of 26 A. The EPC2050 measures only 1.95 mm x 1.95 mm, making EPC2050-based solutions ten times smaller than solutions using equivalent silicon devices.
9. What pricing options are available for accessing the report?
Pricing options include single-user, multi-user, and enterprise licenses priced at USD 4750, USD 5250, and USD 8750 respectively.
10. Is the market size provided in terms of value or volume?
The market size is provided in terms of value, measured in billion.
11. Are there any specific market keywords associated with the report?
Yes, the market keyword associated with the report is "Power Transistors Market," which aids in identifying and referencing the specific market segment covered.
12. How do I determine which pricing option suits my needs best?
The pricing options vary based on user requirements and access needs. Individual users may opt for single-user licenses, while businesses requiring broader access may choose multi-user or enterprise licenses for cost-effective access to the report.
13. Are there any additional resources or data provided in the Power Transistors Market report?
While the report offers comprehensive insights, it's advisable to review the specific contents or supplementary materials provided to ascertain if additional resources or data are available.
14. How can I stay updated on further developments or reports in the Power Transistors Market?
To stay informed about further developments, trends, and reports in the Power Transistors Market, consider subscribing to industry newsletters, following relevant companies and organizations, or regularly checking reputable industry news sources and publications.
Methodology
Step 1 - Identification of Relevant Samples Size from Population Database


Step 2 - Approaches for Defining Global Market Size (Value, Volume* & Price*)

Note*: In applicable scenarios
Step 3 - Data Sources
Primary Research
- Web Analytics
- Survey Reports
- Research Institute
- Latest Research Reports
- Opinion Leaders
Secondary Research
- Annual Reports
- White Paper
- Latest Press Release
- Industry Association
- Paid Database
- Investor Presentations

Step 4 - Data Triangulation
Involves using different sources of information in order to increase the validity of a study
These sources are likely to be stakeholders in a program - participants, other researchers, program staff, other community members, and so on.
Then we put all data in single framework & apply various statistical tools to find out the dynamic on the market.
During the analysis stage, feedback from the stakeholder groups would be compared to determine areas of agreement as well as areas of divergence