

Key Insights
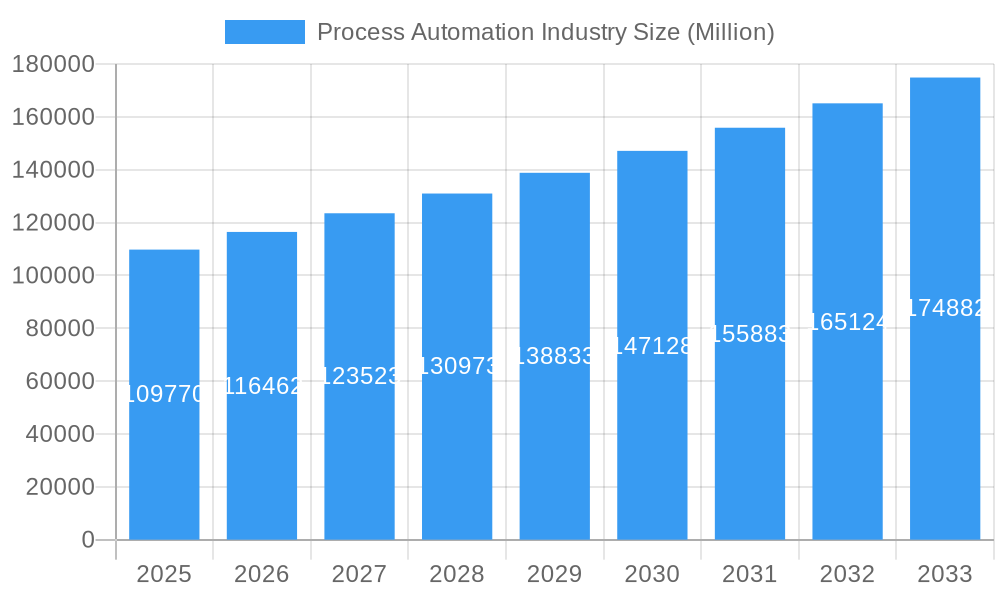
The global process automation market, valued at $109.77 billion in 2025, is poised for robust growth, exhibiting a Compound Annual Growth Rate (CAGR) of 5.82% from 2025 to 2033. This expansion is driven by several key factors. Increasing demand for enhanced efficiency and productivity across various end-user industries, such as chemical and petrochemical, oil and gas, and energy and utilities, is a primary catalyst. The rising adoption of advanced technologies like artificial intelligence (AI) and machine learning (ML) for predictive maintenance and optimized process control further fuels market growth. Furthermore, stringent government regulations concerning safety and environmental compliance are compelling businesses to invest in sophisticated automation solutions. The integration of Industry 4.0 principles, including the Industrial Internet of Things (IIoT) and cloud-based solutions, is also significantly impacting market dynamics, enabling real-time data analysis and improved decision-making.
Process Automation Industry Market Size (In Billion)
Significant growth is anticipated across different segments. The SCADA, DCS, and PLC systems are expected to maintain their dominance, while the demand for advanced systems like MES and process safety systems is projected to rise rapidly. Wireless communication protocols are gaining traction due to their flexibility and cost-effectiveness compared to wired solutions. Geographically, North America and Europe currently hold substantial market shares, driven by established industrial infrastructure and technological advancements. However, the Asia-Pacific region is expected to witness the fastest growth rate over the forecast period, fueled by increasing industrialization and investments in infrastructure development within countries like China and India. Competitive rivalry among established players like Honeywell, ABB, Siemens, and Rockwell Automation, along with the emergence of innovative startups, is further shaping market dynamics. Potential restraints include the high initial investment costs associated with automation upgrades and the need for skilled workforce to implement and maintain these systems.
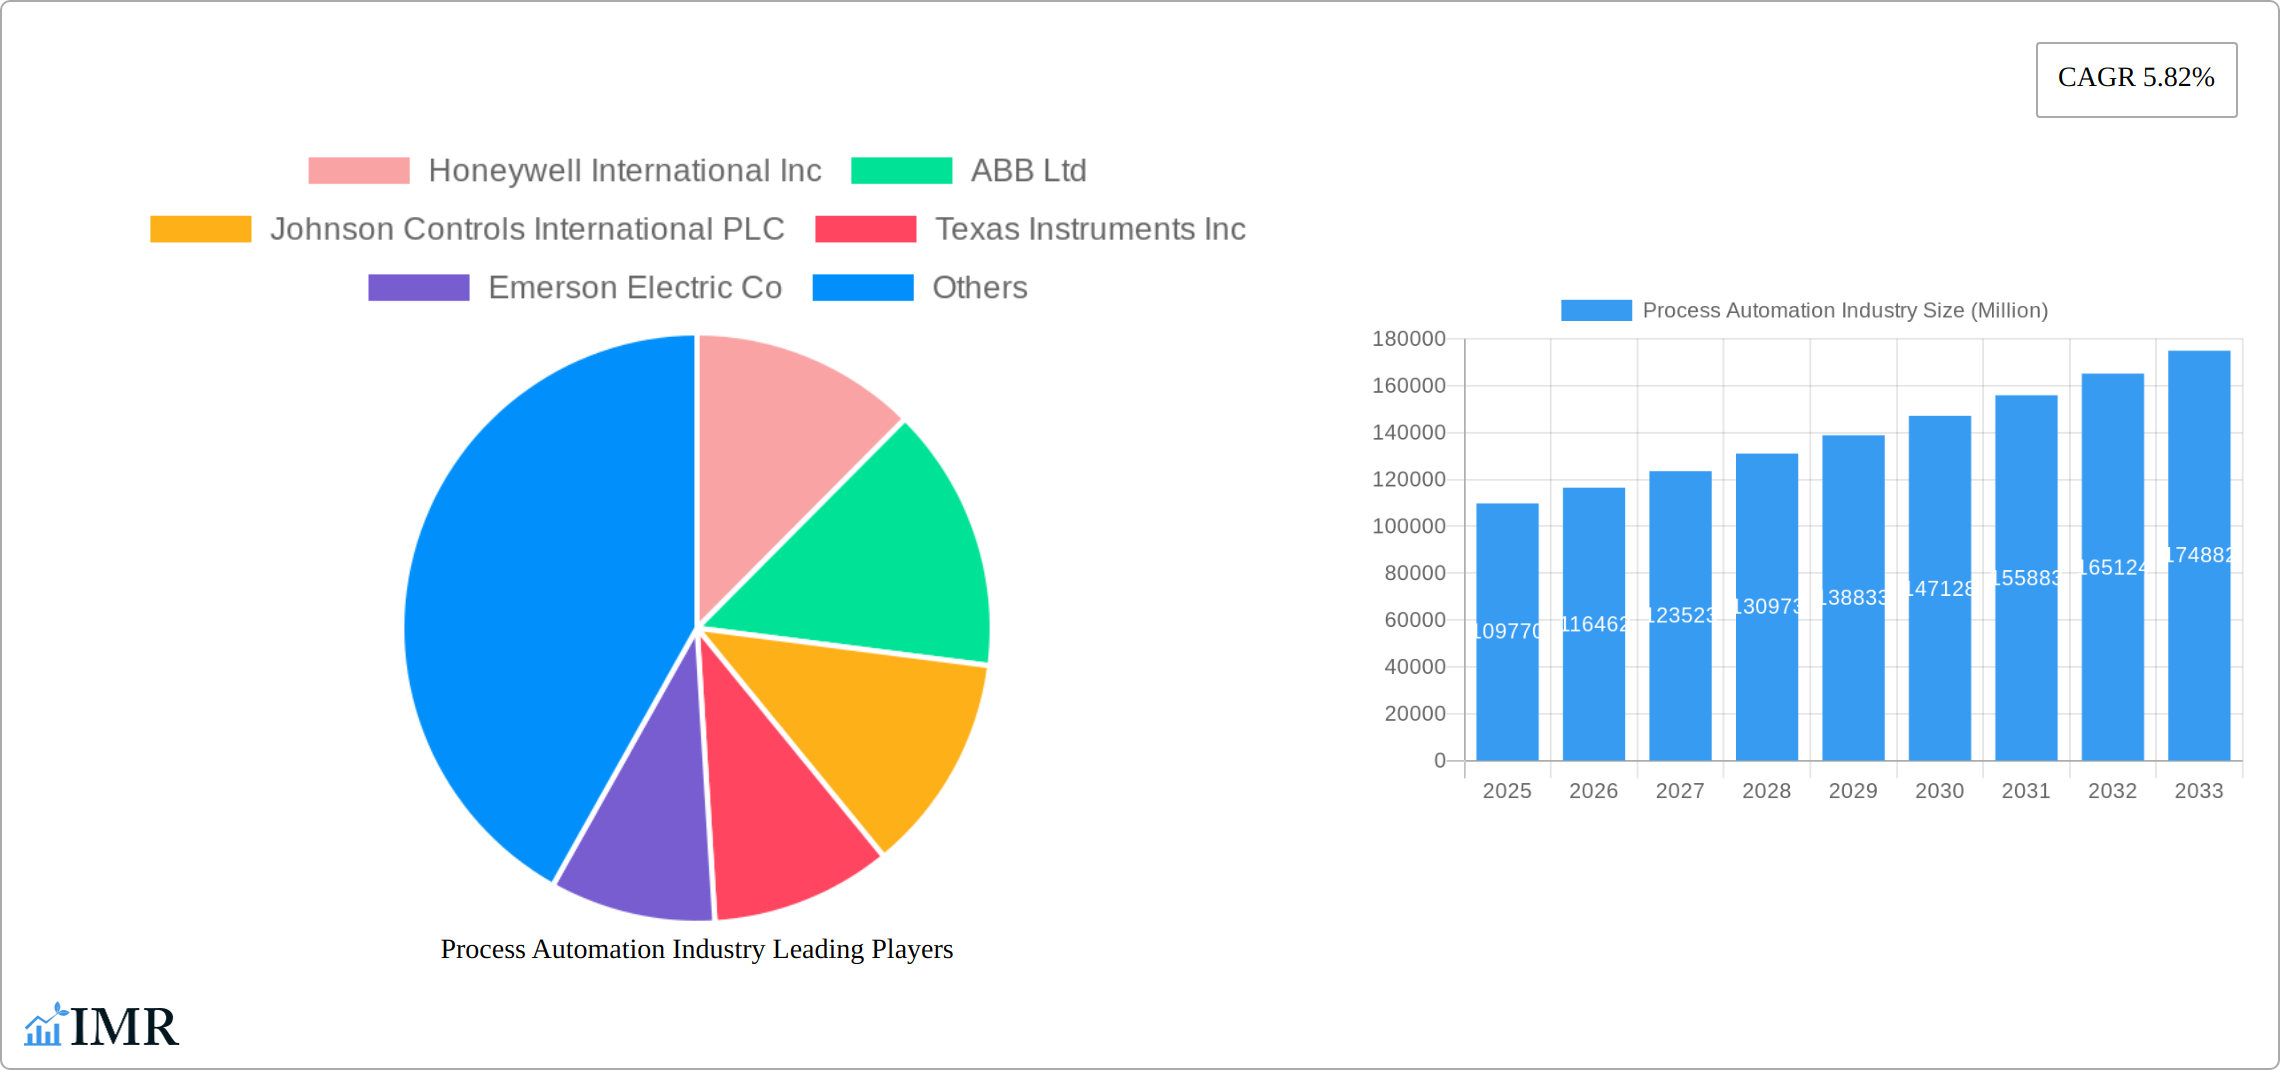
Process Automation Industry Company Market Share
This comprehensive report provides an in-depth analysis of the Process Automation Industry, encompassing market dynamics, growth trends, regional dominance, product landscape, key challenges, emerging opportunities, and a detailed outlook for 2019-2033. The report utilizes data from 2019-2024 as its historical period, with 2025 as the base year and forecasting to 2033. Market values are presented in millions of units.
Process Automation Industry Market Dynamics & Structure
The Process Automation market, valued at $xx million in 2024, is characterized by moderate concentration, with key players like Honeywell, ABB, and Siemens holding significant market shares (totaling approximately xx%). Technological innovation, particularly in areas like AI and IoT integration, is a major driver, while stringent regulatory frameworks concerning safety and environmental compliance influence market dynamics. Substitute technologies, such as manual processes, pose limited competition due to efficiency and cost advantages offered by automation. The end-user demographics are diverse, spanning various industries with varying levels of automation adoption. Significant M&A activity (xx deals in the last 5 years) further shapes the market landscape, creating larger, more integrated players.
- Market Concentration: Moderately concentrated, with top 3 players holding xx% market share.
- Technological Innovation: AI, IoT, and cloud computing are key drivers.
- Regulatory Framework: Stringent safety and environmental regulations.
- Competitive Substitutes: Limited, with manual processes posing minor threat.
- M&A Activity: Significant activity, leading to consolidation. (xx deals in 2019-2024)
- Innovation Barriers: High initial investment costs, integration complexity, and cybersecurity concerns.
Process Automation Industry Growth Trends & Insights
The Process Automation market is experiencing robust growth, projected to reach a substantial valuation by 2033, exhibiting a significant CAGR during the forecast period (2025-2033). This expansion is driven by a confluence of factors: the persistent demand for enhanced operational efficiency and safety, the continuous pressure to reduce operational costs, and the accelerating adoption of Industry 4.0 technologies across a wide range of end-user sectors. Specific industries like Chemical & Petrochemical, Oil & Gas, and Energy & Utilities are leading the charge in automation adoption. Furthermore, technological advancements such as edge computing and the burgeoning use of digital twins are profoundly accelerating market transformation. The evolving consumer landscape, with its increasing focus on sustainability and data-driven decision-making, is also significantly influencing market dynamics. This shift necessitates adaptable and intelligent automation solutions.
Dominant Regions, Countries, or Segments in Process Automation Industry
North America currently holds a leading position in the Process Automation market, followed by Europe and the Asia-Pacific region. Within system types, Programmable Logic Controllers (PLCs) and Distributed Control Systems (DCSs) constitute the largest market segments, while wired protocols continue to dominate communication infrastructure. However, the landscape is evolving. The Chemical & Petrochemical, Oil & Gas, and Energy & Utilities sectors remain the largest end-user industries, but the Pharmaceutical sector is experiencing rapid growth driven by stringent regulatory compliance demands.
- Leading Region: North America (holding a substantial market share in 2025)
- Key Drivers: A robust industrial base, high automation adoption rates, a favorable regulatory environment conducive to innovation, and substantial investments in infrastructure modernization.
- Fastest-Growing Segment: Wireless protocols (projected to experience significant CAGR growth due to increasing demand for flexible and cost-effective solutions)
- High-Growth End-User Industry: Pharmaceutical (driven by stringent quality control and Good Manufacturing Practices (GMP) compliance, necessitating advanced automation solutions)
System Type Dominance: PLC and DCS systems maintain the largest market shares due to their versatility and reliability across diverse industrial settings. The increasing sophistication of these systems, incorporating features like predictive maintenance and advanced cybersecurity, fuels their continued dominance.
Communication Protocol: While wired protocols remain prevalent due to their established reliability, the adoption of wireless protocols is accelerating, driven by the need for greater flexibility and cost-effectiveness in specific applications. The convergence of wired and wireless technologies is also shaping the communication landscape.
End-user Industry: The Chemical & Petrochemical sector continues to lead due to the inherent complexity of its processes and the paramount need for safety and efficiency. However, growth in other sectors, such as pharmaceuticals and food processing, is rapidly closing the gap.
Process Automation Industry Product Landscape
The Process Automation product landscape is characterized by a continuous evolution of advanced features, including predictive maintenance capabilities, robust cybersecurity protocols integrated directly into the hardware and software, and seamless integration with cloud platforms for enhanced data management and remote accessibility. New product introductions consistently showcase improved performance metrics, such as faster processing speeds, heightened accuracy, and reduced energy consumption. Key differentiators frequently include intuitive user interfaces, sophisticated software solutions designed for ease of use and customization, and flexible configurations to meet the specific needs of diverse industry applications. The integration of AI-powered optimization algorithms and advanced analytics is fundamentally reshaping product capabilities, enabling intelligent automation and proactive decision-making.
Key Drivers, Barriers & Challenges in Process Automation Industry
Key Drivers:
- Increasing demand for improved efficiency and productivity.
- Growing adoption of Industry 4.0 technologies.
- Stringent safety and environmental regulations.
- Rising need for data-driven decision-making.
Challenges and Restraints:
- High initial investment costs for implementation.
- Complexity in integrating systems from various vendors.
- Cybersecurity threats and data security concerns.
- Skilled workforce shortage impacting implementation and maintenance.
Emerging Opportunities in Process Automation Industry
- Expansion into Untapped Markets: Significant growth potential exists in developing economies, where the adoption of automation technologies is still in its early stages.
- AI and Machine Learning Integration: Leveraging AI and machine learning to optimize processes, predict potential issues, and improve overall efficiency represents a substantial opportunity.
- Sustainable and Energy-Efficient Solutions: The growing focus on environmental sustainability is driving demand for automation solutions that minimize energy consumption and reduce environmental impact.
- Remote Monitoring and Control: The demand for remote monitoring and control systems is increasing, particularly in geographically dispersed or hazardous environments.
- Cybersecurity Advancements: The rising threat of cyberattacks on industrial control systems necessitates the development of more robust and sophisticated cybersecurity solutions.
Growth Accelerators in the Process Automation Industry
Technological advancements in artificial intelligence, edge computing, and cloud-based solutions are significantly accelerating market growth. Strategic partnerships between automation vendors and end-user industries foster innovation and drive wider adoption. Market expansion into emerging economies and the development of customized solutions tailored to niche applications are further fueling market expansion. Government initiatives promoting digital transformation and Industry 4.0 adoption also play a significant role.
Key Players Shaping the Process Automation Industry Market
- Honeywell International Inc
- ABB Ltd
- Johnson Controls International PLC
- Texas Instruments Inc
- Emerson Electric Co
- Mitsubishi Electric Corporation
- Schneider Electric SE
- Eaton Corporation PLC
- Siemens Corporation
- Rockwell Automation Inc
- Bosch Rexroth AG (Robert Bosch GmBH)
- Dassault Systemes SE
- Yokogawa Electric Corporation
Notable Milestones in Process Automation Industry Sector
- 2020: Increased adoption of cloud-based process automation solutions.
- 2021: Significant investments in AI-powered process optimization technologies.
- 2022: Several key mergers and acquisitions consolidating market share.
- 2023: Launch of new, energy-efficient process automation systems.
- 2024: Increased focus on cybersecurity and data privacy in industrial automation.
In-Depth Process Automation Industry Market Outlook
The Process Automation market is poised for sustained growth, driven by ongoing technological advancements, increasing industry adoption, and expanding applications across diverse sectors. Strategic opportunities exist in developing innovative solutions addressing sustainability concerns, enhancing cybersecurity, and improving operational efficiency. The market's future potential is significant, promising substantial returns for companies investing in research and development and strategic partnerships within the industry.
Process Automation Industry Segmentation
-
1. System Type
- 1.1. Supervisory Control and Data Acquisition (SCADA)
- 1.2. Programmable Logic Controller (PLC)
- 1.3. Distributed Control System (DCS)
- 1.4. Machine Execution System (MES)
- 1.5. Valves and Actuators
- 1.6. Electric Motors
- 1.7. Human Machine Interface (HMI)
- 1.8. Process Safety Systems
- 1.9. Sensors and Transmitters
- 1.10. Other Systems
-
2. Communication Protocol
- 2.1. Wired Protocol
- 2.2. Wireless Protocol
-
3. End-user Industry
- 3.1. Chemical and Petrochemical
- 3.2. Paper and Pulp
- 3.3. Water and Wastewater Treatment
- 3.4. Energy and Utilities
- 3.5. Oil and Gas
- 3.6. Pharmaceutical
- 3.7. Food and Beverages
- 3.8. Other End-user Industries
Process Automation Industry Segmentation By Geography
-
1. North America
- 1.1. United States
- 1.2. Canada
-
2. Europe
- 2.1. United Kingdom
- 2.2. Germany
- 2.3. France
- 2.4. Rest of Europe
-
3. Asia Pacific
- 3.1. China
- 3.2. India
- 3.3. Japan
- 3.4. Rest of Asia Pacific
- 4. Latin America
- 5. Middle East and Africa
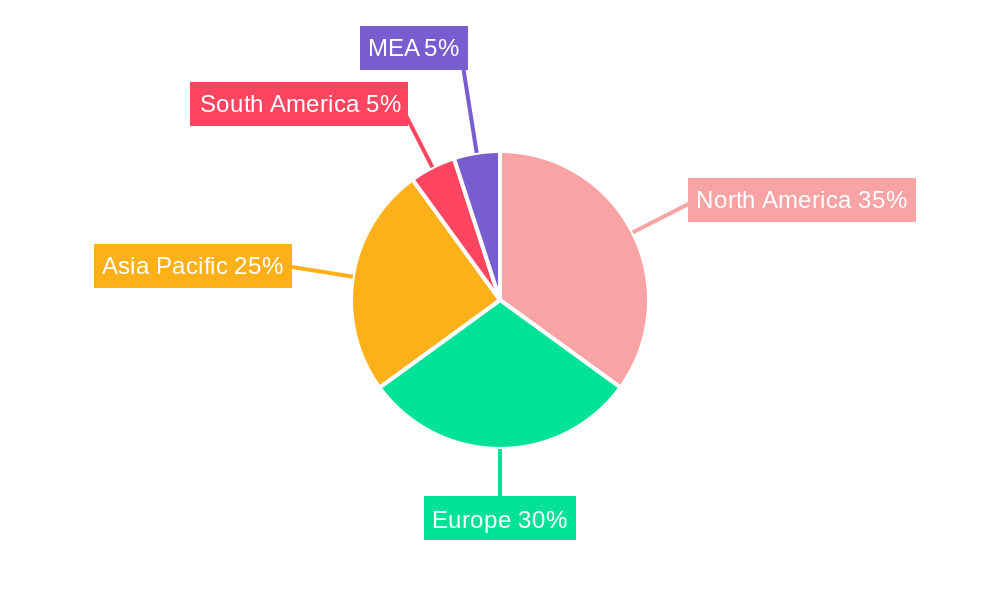
Process Automation Industry Regional Market Share
Geographic Coverage of Process Automation Industry
Process Automation Industry REPORT HIGHLIGHTS
| Aspects | Details |
|---|---|
| Study Period | 2020-2034 |
| Base Year | 2025 |
| Estimated Year | 2026 |
| Forecast Period | 2026-2034 |
| Historical Period | 2020-2025 |
| Growth Rate | CAGR of 5.82% from 2020-2034 |
| Segmentation |
|
Table of Contents
- 1. Introduction
- 1.1. Research Scope
- 1.2. Market Segmentation
- 1.3. Research Objective
- 1.4. Definitions and Assumptions
- 2. Executive Summary
- 2.1. Market Snapshot
- 3. Market Dynamics
- 3.1. Market Drivers
- 3.2. Market Restrains
- 3.3. Market Trends
- 3.4. Market Opportunities
- 4. Market Factor Analysis
- 4.1. Porters Five Forces
- 4.1.1. Bargaining Power of Suppliers
- 4.1.2. Bargaining Power of Buyers
- 4.1.3. Threat of New Entrants
- 4.1.4. Threat of Substitutes
- 4.1.5. Competitive Rivalry
- 4.2. PESTEL analysis
- 4.3. BCG Analysis
- 4.3.1. Stars (High Growth, High Market Share)
- 4.3.2. Cash Cows (Low Growth, High Market Share)
- 4.3.3. Question Mark (High Growth, Low Market Share)
- 4.3.4. Dogs (Low Growth, Low Market Share)
- 4.4. Ansoff Matrix Analysis
- 4.5. Supply Chain Analysis
- 4.6. Regulatory Landscape
- 4.7. Current Market Potential and Opportunity Assessment (TAM–SAM–SOM Framework)
- 4.8. IMR Analyst Note
- 4.1. Porters Five Forces
- 5. Market Analysis, Insights and Forecast 2021-2033
- 5.1. Market Analysis, Insights and Forecast - by System Type
- 5.1.1. Supervisory Control and Data Acquisition (SCADA)
- 5.1.2. Programmable Logic Controller (PLC)
- 5.1.3. Distributed Control System (DCS)
- 5.1.4. Machine Execution System (MES)
- 5.1.5. Valves and Actuators
- 5.1.6. Electric Motors
- 5.1.7. Human Machine Interface (HMI)
- 5.1.8. Process Safety Systems
- 5.1.9. Sensors and Transmitters
- 5.1.10. Other Systems
- 5.2. Market Analysis, Insights and Forecast - by Communication Protocol
- 5.2.1. Wired Protocol
- 5.2.2. Wireless Protocol
- 5.3. Market Analysis, Insights and Forecast - by End-user Industry
- 5.3.1. Chemical and Petrochemical
- 5.3.2. Paper and Pulp
- 5.3.3. Water and Wastewater Treatment
- 5.3.4. Energy and Utilities
- 5.3.5. Oil and Gas
- 5.3.6. Pharmaceutical
- 5.3.7. Food and Beverages
- 5.3.8. Other End-user Industries
- 5.4. Market Analysis, Insights and Forecast - by Region
- 5.4.1. North America
- 5.4.2. Europe
- 5.4.3. Asia Pacific
- 5.4.4. Latin America
- 5.4.5. Middle East and Africa
- 5.1. Market Analysis, Insights and Forecast - by System Type
- 6. Global Process Automation Industry Analysis, Insights and Forecast, 2021-2033
- 6.1. Market Analysis, Insights and Forecast - by System Type
- 6.1.1. Supervisory Control and Data Acquisition (SCADA)
- 6.1.2. Programmable Logic Controller (PLC)
- 6.1.3. Distributed Control System (DCS)
- 6.1.4. Machine Execution System (MES)
- 6.1.5. Valves and Actuators
- 6.1.6. Electric Motors
- 6.1.7. Human Machine Interface (HMI)
- 6.1.8. Process Safety Systems
- 6.1.9. Sensors and Transmitters
- 6.1.10. Other Systems
- 6.2. Market Analysis, Insights and Forecast - by Communication Protocol
- 6.2.1. Wired Protocol
- 6.2.2. Wireless Protocol
- 6.3. Market Analysis, Insights and Forecast - by End-user Industry
- 6.3.1. Chemical and Petrochemical
- 6.3.2. Paper and Pulp
- 6.3.3. Water and Wastewater Treatment
- 6.3.4. Energy and Utilities
- 6.3.5. Oil and Gas
- 6.3.6. Pharmaceutical
- 6.3.7. Food and Beverages
- 6.3.8. Other End-user Industries
- 6.1. Market Analysis, Insights and Forecast - by System Type
- 7. North America Process Automation Industry Analysis, Insights and Forecast, 2020-2032
- 7.1. Market Analysis, Insights and Forecast - by System Type
- 7.1.1. Supervisory Control and Data Acquisition (SCADA)
- 7.1.2. Programmable Logic Controller (PLC)
- 7.1.3. Distributed Control System (DCS)
- 7.1.4. Machine Execution System (MES)
- 7.1.5. Valves and Actuators
- 7.1.6. Electric Motors
- 7.1.7. Human Machine Interface (HMI)
- 7.1.8. Process Safety Systems
- 7.1.9. Sensors and Transmitters
- 7.1.10. Other Systems
- 7.2. Market Analysis, Insights and Forecast - by Communication Protocol
- 7.2.1. Wired Protocol
- 7.2.2. Wireless Protocol
- 7.3. Market Analysis, Insights and Forecast - by End-user Industry
- 7.3.1. Chemical and Petrochemical
- 7.3.2. Paper and Pulp
- 7.3.3. Water and Wastewater Treatment
- 7.3.4. Energy and Utilities
- 7.3.5. Oil and Gas
- 7.3.6. Pharmaceutical
- 7.3.7. Food and Beverages
- 7.3.8. Other End-user Industries
- 7.1. Market Analysis, Insights and Forecast - by System Type
- 8. Europe Process Automation Industry Analysis, Insights and Forecast, 2020-2032
- 8.1. Market Analysis, Insights and Forecast - by System Type
- 8.1.1. Supervisory Control and Data Acquisition (SCADA)
- 8.1.2. Programmable Logic Controller (PLC)
- 8.1.3. Distributed Control System (DCS)
- 8.1.4. Machine Execution System (MES)
- 8.1.5. Valves and Actuators
- 8.1.6. Electric Motors
- 8.1.7. Human Machine Interface (HMI)
- 8.1.8. Process Safety Systems
- 8.1.9. Sensors and Transmitters
- 8.1.10. Other Systems
- 8.2. Market Analysis, Insights and Forecast - by Communication Protocol
- 8.2.1. Wired Protocol
- 8.2.2. Wireless Protocol
- 8.3. Market Analysis, Insights and Forecast - by End-user Industry
- 8.3.1. Chemical and Petrochemical
- 8.3.2. Paper and Pulp
- 8.3.3. Water and Wastewater Treatment
- 8.3.4. Energy and Utilities
- 8.3.5. Oil and Gas
- 8.3.6. Pharmaceutical
- 8.3.7. Food and Beverages
- 8.3.8. Other End-user Industries
- 8.1. Market Analysis, Insights and Forecast - by System Type
- 9. Asia Pacific Process Automation Industry Analysis, Insights and Forecast, 2020-2032
- 9.1. Market Analysis, Insights and Forecast - by System Type
- 9.1.1. Supervisory Control and Data Acquisition (SCADA)
- 9.1.2. Programmable Logic Controller (PLC)
- 9.1.3. Distributed Control System (DCS)
- 9.1.4. Machine Execution System (MES)
- 9.1.5. Valves and Actuators
- 9.1.6. Electric Motors
- 9.1.7. Human Machine Interface (HMI)
- 9.1.8. Process Safety Systems
- 9.1.9. Sensors and Transmitters
- 9.1.10. Other Systems
- 9.2. Market Analysis, Insights and Forecast - by Communication Protocol
- 9.2.1. Wired Protocol
- 9.2.2. Wireless Protocol
- 9.3. Market Analysis, Insights and Forecast - by End-user Industry
- 9.3.1. Chemical and Petrochemical
- 9.3.2. Paper and Pulp
- 9.3.3. Water and Wastewater Treatment
- 9.3.4. Energy and Utilities
- 9.3.5. Oil and Gas
- 9.3.6. Pharmaceutical
- 9.3.7. Food and Beverages
- 9.3.8. Other End-user Industries
- 9.1. Market Analysis, Insights and Forecast - by System Type
- 10. Latin America Process Automation Industry Analysis, Insights and Forecast, 2020-2032
- 10.1. Market Analysis, Insights and Forecast - by System Type
- 10.1.1. Supervisory Control and Data Acquisition (SCADA)
- 10.1.2. Programmable Logic Controller (PLC)
- 10.1.3. Distributed Control System (DCS)
- 10.1.4. Machine Execution System (MES)
- 10.1.5. Valves and Actuators
- 10.1.6. Electric Motors
- 10.1.7. Human Machine Interface (HMI)
- 10.1.8. Process Safety Systems
- 10.1.9. Sensors and Transmitters
- 10.1.10. Other Systems
- 10.2. Market Analysis, Insights and Forecast - by Communication Protocol
- 10.2.1. Wired Protocol
- 10.2.2. Wireless Protocol
- 10.3. Market Analysis, Insights and Forecast - by End-user Industry
- 10.3.1. Chemical and Petrochemical
- 10.3.2. Paper and Pulp
- 10.3.3. Water and Wastewater Treatment
- 10.3.4. Energy and Utilities
- 10.3.5. Oil and Gas
- 10.3.6. Pharmaceutical
- 10.3.7. Food and Beverages
- 10.3.8. Other End-user Industries
- 10.1. Market Analysis, Insights and Forecast - by System Type
- 11. Middle East and Africa Process Automation Industry Analysis, Insights and Forecast, 2020-2032
- 11.1. Market Analysis, Insights and Forecast - by System Type
- 11.1.1. Supervisory Control and Data Acquisition (SCADA)
- 11.1.2. Programmable Logic Controller (PLC)
- 11.1.3. Distributed Control System (DCS)
- 11.1.4. Machine Execution System (MES)
- 11.1.5. Valves and Actuators
- 11.1.6. Electric Motors
- 11.1.7. Human Machine Interface (HMI)
- 11.1.8. Process Safety Systems
- 11.1.9. Sensors and Transmitters
- 11.1.10. Other Systems
- 11.2. Market Analysis, Insights and Forecast - by Communication Protocol
- 11.2.1. Wired Protocol
- 11.2.2. Wireless Protocol
- 11.3. Market Analysis, Insights and Forecast - by End-user Industry
- 11.3.1. Chemical and Petrochemical
- 11.3.2. Paper and Pulp
- 11.3.3. Water and Wastewater Treatment
- 11.3.4. Energy and Utilities
- 11.3.5. Oil and Gas
- 11.3.6. Pharmaceutical
- 11.3.7. Food and Beverages
- 11.3.8. Other End-user Industries
- 11.1. Market Analysis, Insights and Forecast - by System Type
- 12. Competitive Analysis
- 12.1. Company Profiles
- 12.1.1 Honeywell International Inc
- 12.1.1.1. Company Overview
- 12.1.1.2. Products
- 12.1.1.3. Company Financials
- 12.1.1.4. SWOT Analysis
- 12.1.2 ABB Ltd
- 12.1.2.1. Company Overview
- 12.1.2.2. Products
- 12.1.2.3. Company Financials
- 12.1.2.4. SWOT Analysis
- 12.1.3 Johnson Controls International PLC
- 12.1.3.1. Company Overview
- 12.1.3.2. Products
- 12.1.3.3. Company Financials
- 12.1.3.4. SWOT Analysis
- 12.1.4 Texas Instruments Inc
- 12.1.4.1. Company Overview
- 12.1.4.2. Products
- 12.1.4.3. Company Financials
- 12.1.4.4. SWOT Analysis
- 12.1.5 Emerson Electric Co
- 12.1.5.1. Company Overview
- 12.1.5.2. Products
- 12.1.5.3. Company Financials
- 12.1.5.4. SWOT Analysis
- 12.1.6 Mitsubishi Electric Corporation
- 12.1.6.1. Company Overview
- 12.1.6.2. Products
- 12.1.6.3. Company Financials
- 12.1.6.4. SWOT Analysis
- 12.1.7 Schneider Electric SE
- 12.1.7.1. Company Overview
- 12.1.7.2. Products
- 12.1.7.3. Company Financials
- 12.1.7.4. SWOT Analysis
- 12.1.8 Eaton Corporation PLC
- 12.1.8.1. Company Overview
- 12.1.8.2. Products
- 12.1.8.3. Company Financials
- 12.1.8.4. SWOT Analysis
- 12.1.9 Siemens Corporation
- 12.1.9.1. Company Overview
- 12.1.9.2. Products
- 12.1.9.3. Company Financials
- 12.1.9.4. SWOT Analysis
- 12.1.10 Rockwell Automation Inc
- 12.1.10.1. Company Overview
- 12.1.10.2. Products
- 12.1.10.3. Company Financials
- 12.1.10.4. SWOT Analysis
- 12.1.11 Bosch Rexroth AG (Robert Bosch GmBH)
- 12.1.11.1. Company Overview
- 12.1.11.2. Products
- 12.1.11.3. Company Financials
- 12.1.11.4. SWOT Analysis
- 12.1.12 Dassault Systemes SE
- 12.1.12.1. Company Overview
- 12.1.12.2. Products
- 12.1.12.3. Company Financials
- 12.1.12.4. SWOT Analysis
- 12.1.13 Yokogawa Electric Corporation
- 12.1.13.1. Company Overview
- 12.1.13.2. Products
- 12.1.13.3. Company Financials
- 12.1.13.4. SWOT Analysis
- 12.1.1 Honeywell International Inc
- 12.2. Market Entropy
- 12.2.1 Company's Key Areas Served
- 12.2.2 Recent Developments
- 12.3. Company Market Share Analysis 2025
- 12.3.1 Top 5 Companies Market Share Analysis
- 12.3.2 Top 3 Companies Market Share Analysis
- 12.4. List of Potential Customers
- 13. Research Methodology
List of Figures
- Figure 1: Global Process Automation Industry Revenue Breakdown (Million, %) by Region 2025 & 2033
- Figure 2: North America Process Automation Industry Revenue (Million), by System Type 2025 & 2033
- Figure 3: North America Process Automation Industry Revenue Share (%), by System Type 2025 & 2033
- Figure 4: North America Process Automation Industry Revenue (Million), by Communication Protocol 2025 & 2033
- Figure 5: North America Process Automation Industry Revenue Share (%), by Communication Protocol 2025 & 2033
- Figure 6: North America Process Automation Industry Revenue (Million), by End-user Industry 2025 & 2033
- Figure 7: North America Process Automation Industry Revenue Share (%), by End-user Industry 2025 & 2033
- Figure 8: North America Process Automation Industry Revenue (Million), by Country 2025 & 2033
- Figure 9: North America Process Automation Industry Revenue Share (%), by Country 2025 & 2033
- Figure 10: Europe Process Automation Industry Revenue (Million), by System Type 2025 & 2033
- Figure 11: Europe Process Automation Industry Revenue Share (%), by System Type 2025 & 2033
- Figure 12: Europe Process Automation Industry Revenue (Million), by Communication Protocol 2025 & 2033
- Figure 13: Europe Process Automation Industry Revenue Share (%), by Communication Protocol 2025 & 2033
- Figure 14: Europe Process Automation Industry Revenue (Million), by End-user Industry 2025 & 2033
- Figure 15: Europe Process Automation Industry Revenue Share (%), by End-user Industry 2025 & 2033
- Figure 16: Europe Process Automation Industry Revenue (Million), by Country 2025 & 2033
- Figure 17: Europe Process Automation Industry Revenue Share (%), by Country 2025 & 2033
- Figure 18: Asia Pacific Process Automation Industry Revenue (Million), by System Type 2025 & 2033
- Figure 19: Asia Pacific Process Automation Industry Revenue Share (%), by System Type 2025 & 2033
- Figure 20: Asia Pacific Process Automation Industry Revenue (Million), by Communication Protocol 2025 & 2033
- Figure 21: Asia Pacific Process Automation Industry Revenue Share (%), by Communication Protocol 2025 & 2033
- Figure 22: Asia Pacific Process Automation Industry Revenue (Million), by End-user Industry 2025 & 2033
- Figure 23: Asia Pacific Process Automation Industry Revenue Share (%), by End-user Industry 2025 & 2033
- Figure 24: Asia Pacific Process Automation Industry Revenue (Million), by Country 2025 & 2033
- Figure 25: Asia Pacific Process Automation Industry Revenue Share (%), by Country 2025 & 2033
- Figure 26: Latin America Process Automation Industry Revenue (Million), by System Type 2025 & 2033
- Figure 27: Latin America Process Automation Industry Revenue Share (%), by System Type 2025 & 2033
- Figure 28: Latin America Process Automation Industry Revenue (Million), by Communication Protocol 2025 & 2033
- Figure 29: Latin America Process Automation Industry Revenue Share (%), by Communication Protocol 2025 & 2033
- Figure 30: Latin America Process Automation Industry Revenue (Million), by End-user Industry 2025 & 2033
- Figure 31: Latin America Process Automation Industry Revenue Share (%), by End-user Industry 2025 & 2033
- Figure 32: Latin America Process Automation Industry Revenue (Million), by Country 2025 & 2033
- Figure 33: Latin America Process Automation Industry Revenue Share (%), by Country 2025 & 2033
- Figure 34: Middle East and Africa Process Automation Industry Revenue (Million), by System Type 2025 & 2033
- Figure 35: Middle East and Africa Process Automation Industry Revenue Share (%), by System Type 2025 & 2033
- Figure 36: Middle East and Africa Process Automation Industry Revenue (Million), by Communication Protocol 2025 & 2033
- Figure 37: Middle East and Africa Process Automation Industry Revenue Share (%), by Communication Protocol 2025 & 2033
- Figure 38: Middle East and Africa Process Automation Industry Revenue (Million), by End-user Industry 2025 & 2033
- Figure 39: Middle East and Africa Process Automation Industry Revenue Share (%), by End-user Industry 2025 & 2033
- Figure 40: Middle East and Africa Process Automation Industry Revenue (Million), by Country 2025 & 2033
- Figure 41: Middle East and Africa Process Automation Industry Revenue Share (%), by Country 2025 & 2033
List of Tables
- Table 1: Global Process Automation Industry Revenue Million Forecast, by System Type 2020 & 2033
- Table 2: Global Process Automation Industry Revenue Million Forecast, by Communication Protocol 2020 & 2033
- Table 3: Global Process Automation Industry Revenue Million Forecast, by End-user Industry 2020 & 2033
- Table 4: Global Process Automation Industry Revenue Million Forecast, by Region 2020 & 2033
- Table 5: Global Process Automation Industry Revenue Million Forecast, by System Type 2020 & 2033
- Table 6: Global Process Automation Industry Revenue Million Forecast, by Communication Protocol 2020 & 2033
- Table 7: Global Process Automation Industry Revenue Million Forecast, by End-user Industry 2020 & 2033
- Table 8: Global Process Automation Industry Revenue Million Forecast, by Country 2020 & 2033
- Table 9: United States Process Automation Industry Revenue (Million) Forecast, by Application 2020 & 2033
- Table 10: Canada Process Automation Industry Revenue (Million) Forecast, by Application 2020 & 2033
- Table 11: Global Process Automation Industry Revenue Million Forecast, by System Type 2020 & 2033
- Table 12: Global Process Automation Industry Revenue Million Forecast, by Communication Protocol 2020 & 2033
- Table 13: Global Process Automation Industry Revenue Million Forecast, by End-user Industry 2020 & 2033
- Table 14: Global Process Automation Industry Revenue Million Forecast, by Country 2020 & 2033
- Table 15: United Kingdom Process Automation Industry Revenue (Million) Forecast, by Application 2020 & 2033
- Table 16: Germany Process Automation Industry Revenue (Million) Forecast, by Application 2020 & 2033
- Table 17: France Process Automation Industry Revenue (Million) Forecast, by Application 2020 & 2033
- Table 18: Rest of Europe Process Automation Industry Revenue (Million) Forecast, by Application 2020 & 2033
- Table 19: Global Process Automation Industry Revenue Million Forecast, by System Type 2020 & 2033
- Table 20: Global Process Automation Industry Revenue Million Forecast, by Communication Protocol 2020 & 2033
- Table 21: Global Process Automation Industry Revenue Million Forecast, by End-user Industry 2020 & 2033
- Table 22: Global Process Automation Industry Revenue Million Forecast, by Country 2020 & 2033
- Table 23: China Process Automation Industry Revenue (Million) Forecast, by Application 2020 & 2033
- Table 24: India Process Automation Industry Revenue (Million) Forecast, by Application 2020 & 2033
- Table 25: Japan Process Automation Industry Revenue (Million) Forecast, by Application 2020 & 2033
- Table 26: Rest of Asia Pacific Process Automation Industry Revenue (Million) Forecast, by Application 2020 & 2033
- Table 27: Global Process Automation Industry Revenue Million Forecast, by System Type 2020 & 2033
- Table 28: Global Process Automation Industry Revenue Million Forecast, by Communication Protocol 2020 & 2033
- Table 29: Global Process Automation Industry Revenue Million Forecast, by End-user Industry 2020 & 2033
- Table 30: Global Process Automation Industry Revenue Million Forecast, by Country 2020 & 2033
- Table 31: Global Process Automation Industry Revenue Million Forecast, by System Type 2020 & 2033
- Table 32: Global Process Automation Industry Revenue Million Forecast, by Communication Protocol 2020 & 2033
- Table 33: Global Process Automation Industry Revenue Million Forecast, by End-user Industry 2020 & 2033
- Table 34: Global Process Automation Industry Revenue Million Forecast, by Country 2020 & 2033
Frequently Asked Questions
1. What is the projected Compound Annual Growth Rate (CAGR) of the Process Automation Industry?
The projected CAGR is approximately 5.82%.
2. Which companies are prominent players in the Process Automation Industry?
Key companies in the market include Honeywell International Inc, ABB Ltd, Johnson Controls International PLC, Texas Instruments Inc, Emerson Electric Co, Mitsubishi Electric Corporation, Schneider Electric SE, Eaton Corporation PLC, Siemens Corporation, Rockwell Automation Inc, Bosch Rexroth AG (Robert Bosch GmBH), Dassault Systemes SE, Yokogawa Electric Corporation.
3. What are the main segments of the Process Automation Industry?
The market segments include System Type, Communication Protocol, End-user Industry.
4. Can you provide details about the market size?
The market size is estimated to be USD 109.77 Million as of 2022.
5. What are some drivers contributing to market growth?
; Rising Adoption of Robotics; Growing Emphasis on Energy Efficiency and Cost Reduction; Emergence of IIoT; Demand for Safety Automation Systems.
6. What are the notable trends driving market growth?
Paper and Pulp Segment is Expected to Register a Significant Growth.
7. Are there any restraints impacting market growth?
High Up-front Installation Costs and Interoperability Issues; Unavailability for Skilled Workforce.
8. Can you provide examples of recent developments in the market?
N/A
9. What pricing options are available for accessing the report?
Pricing options include single-user, multi-user, and enterprise licenses priced at USD 4750, USD 5250, and USD 8750 respectively.
10. Is the market size provided in terms of value or volume?
The market size is provided in terms of value, measured in Million.
11. Are there any specific market keywords associated with the report?
Yes, the market keyword associated with the report is "Process Automation Industry," which aids in identifying and referencing the specific market segment covered.
12. How do I determine which pricing option suits my needs best?
The pricing options vary based on user requirements and access needs. Individual users may opt for single-user licenses, while businesses requiring broader access may choose multi-user or enterprise licenses for cost-effective access to the report.
13. Are there any additional resources or data provided in the Process Automation Industry report?
While the report offers comprehensive insights, it's advisable to review the specific contents or supplementary materials provided to ascertain if additional resources or data are available.
14. How can I stay updated on further developments or reports in the Process Automation Industry?
To stay informed about further developments, trends, and reports in the Process Automation Industry, consider subscribing to industry newsletters, following relevant companies and organizations, or regularly checking reputable industry news sources and publications.
Methodology
Step 1 - Identification of Relevant Samples Size from Population Database


Step 2 - Approaches for Defining Global Market Size (Value, Volume* & Price*)

Note*: In applicable scenarios
Step 3 - Data Sources
Primary Research
- Web Analytics
- Survey Reports
- Research Institute
- Latest Research Reports
- Opinion Leaders
Secondary Research
- Annual Reports
- White Paper
- Latest Press Release
- Industry Association
- Paid Database
- Investor Presentations

Step 4 - Data Triangulation
Involves using different sources of information in order to increase the validity of a study
These sources are likely to be stakeholders in a program - participants, other researchers, program staff, other community members, and so on.
Then we put all data in single framework & apply various statistical tools to find out the dynamic on the market.
During the analysis stage, feedback from the stakeholder groups would be compared to determine areas of agreement as well as areas of divergence