

Key Insights
The global salt replacer market is poised for significant expansion, fueled by heightened consumer health awareness and the escalating global incidence of hypertension. Projected to grow from an estimated $1.38 billion in 2025, the market is anticipated to achieve a compound annual growth rate (CAGR) of 6.71%, reaching approximately $2.37 billion by 2033. This growth is primarily driven by increasing recognition of the adverse health impacts associated with excessive sodium consumption, spurring demand for healthier dietary alternatives. The rising prevalence of cardiovascular diseases and supportive government policies promoting healthier eating habits further accelerate market development. Leading industry players, including Now Foods, Savoury Systems, and DowDuPont, are actively engaged in product innovation and strategic market expansion, introducing a diverse portfolio of salt substitutes such as potassium chloride-based formulations, mineral and spice blends, and low-sodium seasoning options. Market segmentation encompasses product categories (potassium chloride, potassium citrate), application areas (food processing, domestic use), and regional markets, with North America and Europe currently dominating market share.
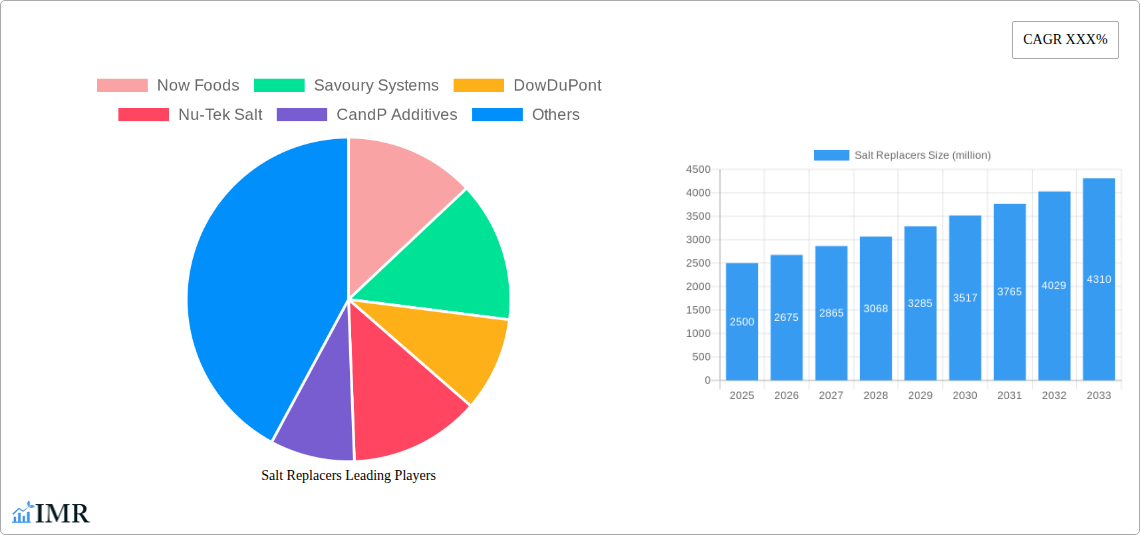
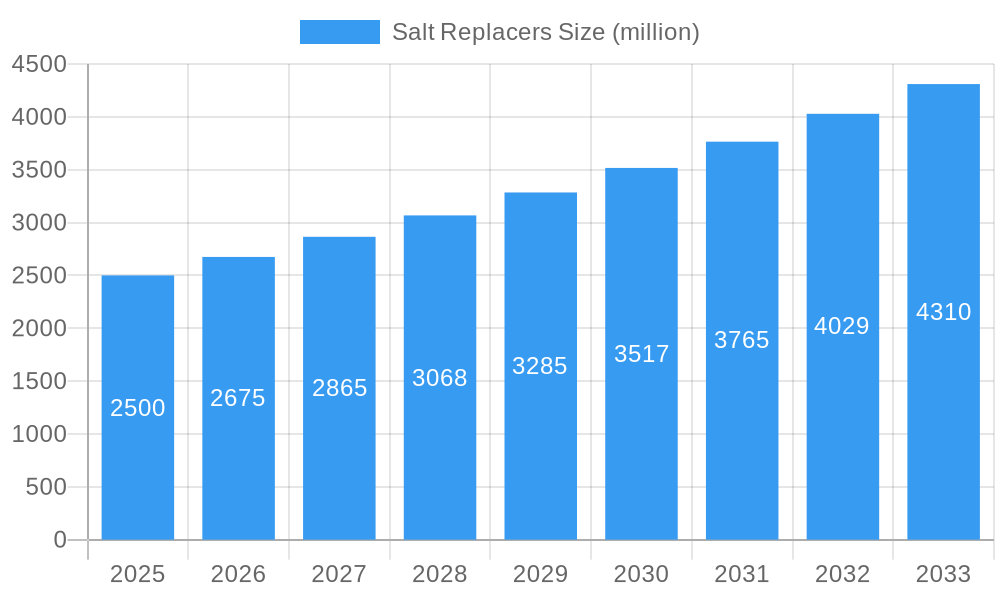
Salt Replacers Market Size (In Billion)
While the market outlook is positive, challenges persist. The comparatively higher cost of certain salt replacers, relative to conventional salt, acts as a barrier to widespread adoption, particularly in emerging economies. Additionally, variations in taste and texture compared to traditional salt may influence consumer acceptance. Nevertheless, continuous research and development initiatives are addressing these limitations, aiming to improve product quality and broaden consumer appeal. Future market growth will also depend on effective marketing strategies that emphasize health advantages and alleviate consumer concerns regarding taste and cost, alongside consumer education on the importance of sodium reduction and the availability of palatable alternatives.
Salt Replacers Company Market Share
Salt Replacers Market Report: 2019-2033
This comprehensive report provides a detailed analysis of the global salt replacers market, offering invaluable insights for industry professionals, investors, and strategic decision-makers. With a focus on market dynamics, growth trends, competitive landscape, and future outlook, this report covers the period from 2019 to 2033, with a base year of 2025. The report meticulously examines key players such as Now Foods, Savoury Systems, DowDuPont, Nu-Tek Salt, CandP Additives, and Benson’s Gourmet Seasoning, across various segments within the food and beverage and healthcare industries. Expect detailed quantitative data presented in millions of units, offering precise projections and analyses.
Salt Replacers Market Dynamics & Structure
The global salt replacers market is characterized by moderate concentration, with a few major players holding significant market share (xx%). Technological innovation, driven by consumer demand for healthier alternatives and regulatory pressures to reduce sodium intake, is a key driver. Stringent regulatory frameworks regarding labeling and health claims influence market dynamics. Competitive pressure from existing salt substitutes and emerging healthier alternatives is evident. The market is segmented by application (food & beverage, healthcare), product type (potassium chloride, potassium citrate, etc.), and geography. M&A activity has been relatively low in recent years (xx deals in the historical period), reflecting a stable, though evolving, market structure.
- Market Concentration: xx% held by top 5 players (2025)
- Technological Innovation: Focus on improved taste and functionality of salt replacers.
- Regulatory Landscape: Stringent labeling and health claim regulations vary across regions.
- Competitive Substitutes: Potassium chloride, potassium citrate, and other mineral salts.
- End-User Demographics: Growing health-conscious population drives demand.
- M&A Trends: Low M&A activity (xx deals in 2019-2024) reflects market stability.
Salt Replacers Growth Trends & Insights
The global salt replacers market witnessed steady growth during the historical period (2019-2024), with a CAGR of xx%. This growth is primarily attributed to increasing health awareness among consumers, coupled with growing concerns about high sodium intake and its associated health risks. Technological advancements have led to the development of salt replacers with improved taste and functionality, boosting consumer acceptance. Shifting consumer preferences toward healthier food options further accelerates market expansion. Market penetration is expected to rise significantly in the forecast period (2025-2033), driven by increasing product innovation and wider availability. The market size is projected to reach xx million units by 2033, indicating a substantial growth trajectory.
Dominant Regions, Countries, or Segments in Salt Replacers
North America holds the largest market share in the salt replacers market (xx% in 2025), followed by Europe and Asia-Pacific. The dominance of North America is attributed to high consumer awareness of health and wellness, coupled with stringent regulations on sodium content in processed foods. Stronger health-conscious consumer base and proactive government initiatives supporting healthier eating habits drives growth in this region.
- Key Drivers in North America: High health consciousness, stringent regulations, established distribution networks.
- Growth Potential in Asia-Pacific: Rising disposable incomes, increasing health awareness, expanding processed food industry.
- Europe's Market Share: Significantly influenced by evolving consumer preferences and regulatory standards.
Salt Replacers Product Landscape
The salt replacers market offers a diverse range of products, primarily based on potassium chloride, potassium citrate, and other mineral salts. Innovation focuses on enhancing taste profiles to overcome the bitter or metallic aftertaste often associated with traditional salt substitutes. The emphasis is on improved palatability, making the products more attractive to consumers. Technological advancements involve microencapsulation and other processing techniques for enhanced functionality and shelf life.
Key Drivers, Barriers & Challenges in Salt Replacers
Key Drivers:
- Increasing health consciousness and concerns about high sodium intake.
- Growing demand for healthier food and beverage options.
- Technological advancements leading to improved taste and functionality.
- Stringent government regulations promoting reduced sodium consumption.
Challenges & Restraints:
- The lingering perception of a less desirable taste compared to regular salt.
- High cost of production compared to traditional salt, potentially limiting affordability.
- Supply chain disruptions impacting the availability of raw materials.
Emerging Opportunities in Salt Replacers
Emerging opportunities in the salt replacers market lie in the untapped potential of developing markets and the growing demand for healthier and low-sodium food products in emerging economies. Innovation in product formulation to enhance taste and texture remains a significant opportunity. The growing food service industry also presents an avenue for market expansion.
Growth Accelerators in the Salt Replacers Industry
The long-term growth of the salt replacers market will be fueled by continuous technological innovations that further enhance the taste and functionality of these products, surpassing consumer expectations. Strategic partnerships between salt replacer manufacturers and food and beverage companies will accelerate adoption. Expanding into new geographic regions with untapped potential is also key to market growth.
Key Players Shaping the Salt Replacers Market
- Now Foods
- Savoury Systems
- DowDuPont
- Nu-Tek Salt
- CandP Additives
- Benson’s Gourmet Seasoning
Notable Milestones in Salt Replacers Sector
- 2020: Launch of a new potassium-based salt replacer with improved taste profile by X company.
- 2022: Introduction of a new regulatory guideline on sodium content in processed foods in the EU.
- 2023: Strategic partnership between a major food manufacturer and a salt replacer supplier.
In-Depth Salt Replacers Market Outlook
The future of the salt replacers market is bright, driven by continued consumer demand for healthier food options and sustained technological innovation resulting in superior-tasting, functional salt alternatives. Strategic partnerships and expansion into new markets will significantly contribute to achieving high growth in the forecast period. The market’s potential is vast, offering significant opportunities for existing and new players to capitalize on.
Salt Replacers Segmentation
-
1. Application
- 1.1. Meat Industry
- 1.2. Processed Foods
- 1.3. Snacks
- 1.4. Others
-
2. Type
- 2.1. Liquid
- 2.2. Powder
- 2.3. Crystals
Salt Replacers Segmentation By Geography
-
1. North America
- 1.1. United States
- 1.2. Canada
- 1.3. Mexico
-
2. South America
- 2.1. Brazil
- 2.2. Argentina
- 2.3. Rest of South America
-
3. Europe
- 3.1. United Kingdom
- 3.2. Germany
- 3.3. France
- 3.4. Italy
- 3.5. Spain
- 3.6. Russia
- 3.7. Benelux
- 3.8. Nordics
- 3.9. Rest of Europe
-
4. Middle East & Africa
- 4.1. Turkey
- 4.2. Israel
- 4.3. GCC
- 4.4. North Africa
- 4.5. South Africa
- 4.6. Rest of Middle East & Africa
-
5. Asia Pacific
- 5.1. China
- 5.2. India
- 5.3. Japan
- 5.4. South Korea
- 5.5. ASEAN
- 5.6. Oceania
- 5.7. Rest of Asia Pacific

Salt Replacers Regional Market Share
Geographic Coverage of Salt Replacers
Salt Replacers REPORT HIGHLIGHTS
| Aspects | Details |
|---|---|
| Study Period | 2020-2034 |
| Base Year | 2025 |
| Estimated Year | 2026 |
| Forecast Period | 2026-2034 |
| Historical Period | 2020-2025 |
| Growth Rate | CAGR of 6.71% from 2020-2034 |
| Segmentation |
|
Table of Contents
- 1. Introduction
- 1.1. Research Scope
- 1.2. Market Segmentation
- 1.3. Research Objective
- 1.4. Definitions and Assumptions
- 2. Executive Summary
- 2.1. Market Snapshot
- 3. Market Dynamics
- 3.1. Market Drivers
- 3.2. Market Restrains
- 3.3. Market Trends
- 3.4. Market Opportunities
- 4. Market Factor Analysis
- 4.1. Porters Five Forces
- 4.1.1. Bargaining Power of Suppliers
- 4.1.2. Bargaining Power of Buyers
- 4.1.3. Threat of New Entrants
- 4.1.4. Threat of Substitutes
- 4.1.5. Competitive Rivalry
- 4.2. PESTEL analysis
- 4.3. BCG Analysis
- 4.3.1. Stars (High Growth, High Market Share)
- 4.3.2. Cash Cows (Low Growth, High Market Share)
- 4.3.3. Question Mark (High Growth, Low Market Share)
- 4.3.4. Dogs (Low Growth, Low Market Share)
- 4.4. Ansoff Matrix Analysis
- 4.5. Supply Chain Analysis
- 4.6. Regulatory Landscape
- 4.7. Current Market Potential and Opportunity Assessment (TAM–SAM–SOM Framework)
- 4.8. IMR Analyst Note
- 4.1. Porters Five Forces
- 5. Market Analysis, Insights and Forecast 2021-2033
- 5.1. Market Analysis, Insights and Forecast - by Application
- 5.1.1. Meat Industry
- 5.1.2. Processed Foods
- 5.1.3. Snacks
- 5.1.4. Others
- 5.2. Market Analysis, Insights and Forecast - by Type
- 5.2.1. Liquid
- 5.2.2. Powder
- 5.2.3. Crystals
- 5.3. Market Analysis, Insights and Forecast - by Region
- 5.3.1. North America
- 5.3.2. South America
- 5.3.3. Europe
- 5.3.4. Middle East & Africa
- 5.3.5. Asia Pacific
- 5.1. Market Analysis, Insights and Forecast - by Application
- 6. Global Salt Replacers Analysis, Insights and Forecast, 2021-2033
- 6.1. Market Analysis, Insights and Forecast - by Application
- 6.1.1. Meat Industry
- 6.1.2. Processed Foods
- 6.1.3. Snacks
- 6.1.4. Others
- 6.2. Market Analysis, Insights and Forecast - by Type
- 6.2.1. Liquid
- 6.2.2. Powder
- 6.2.3. Crystals
- 6.1. Market Analysis, Insights and Forecast - by Application
- 7. North America Salt Replacers Analysis, Insights and Forecast, 2020-2032
- 7.1. Market Analysis, Insights and Forecast - by Application
- 7.1.1. Meat Industry
- 7.1.2. Processed Foods
- 7.1.3. Snacks
- 7.1.4. Others
- 7.2. Market Analysis, Insights and Forecast - by Type
- 7.2.1. Liquid
- 7.2.2. Powder
- 7.2.3. Crystals
- 7.1. Market Analysis, Insights and Forecast - by Application
- 8. South America Salt Replacers Analysis, Insights and Forecast, 2020-2032
- 8.1. Market Analysis, Insights and Forecast - by Application
- 8.1.1. Meat Industry
- 8.1.2. Processed Foods
- 8.1.3. Snacks
- 8.1.4. Others
- 8.2. Market Analysis, Insights and Forecast - by Type
- 8.2.1. Liquid
- 8.2.2. Powder
- 8.2.3. Crystals
- 8.1. Market Analysis, Insights and Forecast - by Application
- 9. Europe Salt Replacers Analysis, Insights and Forecast, 2020-2032
- 9.1. Market Analysis, Insights and Forecast - by Application
- 9.1.1. Meat Industry
- 9.1.2. Processed Foods
- 9.1.3. Snacks
- 9.1.4. Others
- 9.2. Market Analysis, Insights and Forecast - by Type
- 9.2.1. Liquid
- 9.2.2. Powder
- 9.2.3. Crystals
- 9.1. Market Analysis, Insights and Forecast - by Application
- 10. Middle East & Africa Salt Replacers Analysis, Insights and Forecast, 2020-2032
- 10.1. Market Analysis, Insights and Forecast - by Application
- 10.1.1. Meat Industry
- 10.1.2. Processed Foods
- 10.1.3. Snacks
- 10.1.4. Others
- 10.2. Market Analysis, Insights and Forecast - by Type
- 10.2.1. Liquid
- 10.2.2. Powder
- 10.2.3. Crystals
- 10.1. Market Analysis, Insights and Forecast - by Application
- 11. Asia Pacific Salt Replacers Analysis, Insights and Forecast, 2020-2032
- 11.1. Market Analysis, Insights and Forecast - by Application
- 11.1.1. Meat Industry
- 11.1.2. Processed Foods
- 11.1.3. Snacks
- 11.1.4. Others
- 11.2. Market Analysis, Insights and Forecast - by Type
- 11.2.1. Liquid
- 11.2.2. Powder
- 11.2.3. Crystals
- 11.1. Market Analysis, Insights and Forecast - by Application
- 12. Competitive Analysis
- 12.1. Company Profiles
- 12.1.1 Now Foods
- 12.1.1.1. Company Overview
- 12.1.1.2. Products
- 12.1.1.3. Company Financials
- 12.1.1.4. SWOT Analysis
- 12.1.2 Savoury Systems
- 12.1.2.1. Company Overview
- 12.1.2.2. Products
- 12.1.2.3. Company Financials
- 12.1.2.4. SWOT Analysis
- 12.1.3 DowDuPont
- 12.1.3.1. Company Overview
- 12.1.3.2. Products
- 12.1.3.3. Company Financials
- 12.1.3.4. SWOT Analysis
- 12.1.4 Nu-Tek Salt
- 12.1.4.1. Company Overview
- 12.1.4.2. Products
- 12.1.4.3. Company Financials
- 12.1.4.4. SWOT Analysis
- 12.1.5 CandP Additives
- 12.1.5.1. Company Overview
- 12.1.5.2. Products
- 12.1.5.3. Company Financials
- 12.1.5.4. SWOT Analysis
- 12.1.6 Benson’s Gourmet Seasoning
- 12.1.6.1. Company Overview
- 12.1.6.2. Products
- 12.1.6.3. Company Financials
- 12.1.6.4. SWOT Analysis
- 12.1.1 Now Foods
- 12.2. Market Entropy
- 12.2.1 Company's Key Areas Served
- 12.2.2 Recent Developments
- 12.3. Company Market Share Analysis 2025
- 12.3.1 Top 5 Companies Market Share Analysis
- 12.3.2 Top 3 Companies Market Share Analysis
- 12.4. List of Potential Customers
- 13. Research Methodology
List of Figures
- Figure 1: Global Salt Replacers Revenue Breakdown (billion, %) by Region 2025 & 2033
- Figure 2: Global Salt Replacers Volume Breakdown (K, %) by Region 2025 & 2033
- Figure 3: North America Salt Replacers Revenue (billion), by Application 2025 & 2033
- Figure 4: North America Salt Replacers Volume (K), by Application 2025 & 2033
- Figure 5: North America Salt Replacers Revenue Share (%), by Application 2025 & 2033
- Figure 6: North America Salt Replacers Volume Share (%), by Application 2025 & 2033
- Figure 7: North America Salt Replacers Revenue (billion), by Type 2025 & 2033
- Figure 8: North America Salt Replacers Volume (K), by Type 2025 & 2033
- Figure 9: North America Salt Replacers Revenue Share (%), by Type 2025 & 2033
- Figure 10: North America Salt Replacers Volume Share (%), by Type 2025 & 2033
- Figure 11: North America Salt Replacers Revenue (billion), by Country 2025 & 2033
- Figure 12: North America Salt Replacers Volume (K), by Country 2025 & 2033
- Figure 13: North America Salt Replacers Revenue Share (%), by Country 2025 & 2033
- Figure 14: North America Salt Replacers Volume Share (%), by Country 2025 & 2033
- Figure 15: South America Salt Replacers Revenue (billion), by Application 2025 & 2033
- Figure 16: South America Salt Replacers Volume (K), by Application 2025 & 2033
- Figure 17: South America Salt Replacers Revenue Share (%), by Application 2025 & 2033
- Figure 18: South America Salt Replacers Volume Share (%), by Application 2025 & 2033
- Figure 19: South America Salt Replacers Revenue (billion), by Type 2025 & 2033
- Figure 20: South America Salt Replacers Volume (K), by Type 2025 & 2033
- Figure 21: South America Salt Replacers Revenue Share (%), by Type 2025 & 2033
- Figure 22: South America Salt Replacers Volume Share (%), by Type 2025 & 2033
- Figure 23: South America Salt Replacers Revenue (billion), by Country 2025 & 2033
- Figure 24: South America Salt Replacers Volume (K), by Country 2025 & 2033
- Figure 25: South America Salt Replacers Revenue Share (%), by Country 2025 & 2033
- Figure 26: South America Salt Replacers Volume Share (%), by Country 2025 & 2033
- Figure 27: Europe Salt Replacers Revenue (billion), by Application 2025 & 2033
- Figure 28: Europe Salt Replacers Volume (K), by Application 2025 & 2033
- Figure 29: Europe Salt Replacers Revenue Share (%), by Application 2025 & 2033
- Figure 30: Europe Salt Replacers Volume Share (%), by Application 2025 & 2033
- Figure 31: Europe Salt Replacers Revenue (billion), by Type 2025 & 2033
- Figure 32: Europe Salt Replacers Volume (K), by Type 2025 & 2033
- Figure 33: Europe Salt Replacers Revenue Share (%), by Type 2025 & 2033
- Figure 34: Europe Salt Replacers Volume Share (%), by Type 2025 & 2033
- Figure 35: Europe Salt Replacers Revenue (billion), by Country 2025 & 2033
- Figure 36: Europe Salt Replacers Volume (K), by Country 2025 & 2033
- Figure 37: Europe Salt Replacers Revenue Share (%), by Country 2025 & 2033
- Figure 38: Europe Salt Replacers Volume Share (%), by Country 2025 & 2033
- Figure 39: Middle East & Africa Salt Replacers Revenue (billion), by Application 2025 & 2033
- Figure 40: Middle East & Africa Salt Replacers Volume (K), by Application 2025 & 2033
- Figure 41: Middle East & Africa Salt Replacers Revenue Share (%), by Application 2025 & 2033
- Figure 42: Middle East & Africa Salt Replacers Volume Share (%), by Application 2025 & 2033
- Figure 43: Middle East & Africa Salt Replacers Revenue (billion), by Type 2025 & 2033
- Figure 44: Middle East & Africa Salt Replacers Volume (K), by Type 2025 & 2033
- Figure 45: Middle East & Africa Salt Replacers Revenue Share (%), by Type 2025 & 2033
- Figure 46: Middle East & Africa Salt Replacers Volume Share (%), by Type 2025 & 2033
- Figure 47: Middle East & Africa Salt Replacers Revenue (billion), by Country 2025 & 2033
- Figure 48: Middle East & Africa Salt Replacers Volume (K), by Country 2025 & 2033
- Figure 49: Middle East & Africa Salt Replacers Revenue Share (%), by Country 2025 & 2033
- Figure 50: Middle East & Africa Salt Replacers Volume Share (%), by Country 2025 & 2033
- Figure 51: Asia Pacific Salt Replacers Revenue (billion), by Application 2025 & 2033
- Figure 52: Asia Pacific Salt Replacers Volume (K), by Application 2025 & 2033
- Figure 53: Asia Pacific Salt Replacers Revenue Share (%), by Application 2025 & 2033
- Figure 54: Asia Pacific Salt Replacers Volume Share (%), by Application 2025 & 2033
- Figure 55: Asia Pacific Salt Replacers Revenue (billion), by Type 2025 & 2033
- Figure 56: Asia Pacific Salt Replacers Volume (K), by Type 2025 & 2033
- Figure 57: Asia Pacific Salt Replacers Revenue Share (%), by Type 2025 & 2033
- Figure 58: Asia Pacific Salt Replacers Volume Share (%), by Type 2025 & 2033
- Figure 59: Asia Pacific Salt Replacers Revenue (billion), by Country 2025 & 2033
- Figure 60: Asia Pacific Salt Replacers Volume (K), by Country 2025 & 2033
- Figure 61: Asia Pacific Salt Replacers Revenue Share (%), by Country 2025 & 2033
- Figure 62: Asia Pacific Salt Replacers Volume Share (%), by Country 2025 & 2033
List of Tables
- Table 1: Global Salt Replacers Revenue billion Forecast, by Application 2020 & 2033
- Table 2: Global Salt Replacers Volume K Forecast, by Application 2020 & 2033
- Table 3: Global Salt Replacers Revenue billion Forecast, by Type 2020 & 2033
- Table 4: Global Salt Replacers Volume K Forecast, by Type 2020 & 2033
- Table 5: Global Salt Replacers Revenue billion Forecast, by Region 2020 & 2033
- Table 6: Global Salt Replacers Volume K Forecast, by Region 2020 & 2033
- Table 7: Global Salt Replacers Revenue billion Forecast, by Application 2020 & 2033
- Table 8: Global Salt Replacers Volume K Forecast, by Application 2020 & 2033
- Table 9: Global Salt Replacers Revenue billion Forecast, by Type 2020 & 2033
- Table 10: Global Salt Replacers Volume K Forecast, by Type 2020 & 2033
- Table 11: Global Salt Replacers Revenue billion Forecast, by Country 2020 & 2033
- Table 12: Global Salt Replacers Volume K Forecast, by Country 2020 & 2033
- Table 13: United States Salt Replacers Revenue (billion) Forecast, by Application 2020 & 2033
- Table 14: United States Salt Replacers Volume (K) Forecast, by Application 2020 & 2033
- Table 15: Canada Salt Replacers Revenue (billion) Forecast, by Application 2020 & 2033
- Table 16: Canada Salt Replacers Volume (K) Forecast, by Application 2020 & 2033
- Table 17: Mexico Salt Replacers Revenue (billion) Forecast, by Application 2020 & 2033
- Table 18: Mexico Salt Replacers Volume (K) Forecast, by Application 2020 & 2033
- Table 19: Global Salt Replacers Revenue billion Forecast, by Application 2020 & 2033
- Table 20: Global Salt Replacers Volume K Forecast, by Application 2020 & 2033
- Table 21: Global Salt Replacers Revenue billion Forecast, by Type 2020 & 2033
- Table 22: Global Salt Replacers Volume K Forecast, by Type 2020 & 2033
- Table 23: Global Salt Replacers Revenue billion Forecast, by Country 2020 & 2033
- Table 24: Global Salt Replacers Volume K Forecast, by Country 2020 & 2033
- Table 25: Brazil Salt Replacers Revenue (billion) Forecast, by Application 2020 & 2033
- Table 26: Brazil Salt Replacers Volume (K) Forecast, by Application 2020 & 2033
- Table 27: Argentina Salt Replacers Revenue (billion) Forecast, by Application 2020 & 2033
- Table 28: Argentina Salt Replacers Volume (K) Forecast, by Application 2020 & 2033
- Table 29: Rest of South America Salt Replacers Revenue (billion) Forecast, by Application 2020 & 2033
- Table 30: Rest of South America Salt Replacers Volume (K) Forecast, by Application 2020 & 2033
- Table 31: Global Salt Replacers Revenue billion Forecast, by Application 2020 & 2033
- Table 32: Global Salt Replacers Volume K Forecast, by Application 2020 & 2033
- Table 33: Global Salt Replacers Revenue billion Forecast, by Type 2020 & 2033
- Table 34: Global Salt Replacers Volume K Forecast, by Type 2020 & 2033
- Table 35: Global Salt Replacers Revenue billion Forecast, by Country 2020 & 2033
- Table 36: Global Salt Replacers Volume K Forecast, by Country 2020 & 2033
- Table 37: United Kingdom Salt Replacers Revenue (billion) Forecast, by Application 2020 & 2033
- Table 38: United Kingdom Salt Replacers Volume (K) Forecast, by Application 2020 & 2033
- Table 39: Germany Salt Replacers Revenue (billion) Forecast, by Application 2020 & 2033
- Table 40: Germany Salt Replacers Volume (K) Forecast, by Application 2020 & 2033
- Table 41: France Salt Replacers Revenue (billion) Forecast, by Application 2020 & 2033
- Table 42: France Salt Replacers Volume (K) Forecast, by Application 2020 & 2033
- Table 43: Italy Salt Replacers Revenue (billion) Forecast, by Application 2020 & 2033
- Table 44: Italy Salt Replacers Volume (K) Forecast, by Application 2020 & 2033
- Table 45: Spain Salt Replacers Revenue (billion) Forecast, by Application 2020 & 2033
- Table 46: Spain Salt Replacers Volume (K) Forecast, by Application 2020 & 2033
- Table 47: Russia Salt Replacers Revenue (billion) Forecast, by Application 2020 & 2033
- Table 48: Russia Salt Replacers Volume (K) Forecast, by Application 2020 & 2033
- Table 49: Benelux Salt Replacers Revenue (billion) Forecast, by Application 2020 & 2033
- Table 50: Benelux Salt Replacers Volume (K) Forecast, by Application 2020 & 2033
- Table 51: Nordics Salt Replacers Revenue (billion) Forecast, by Application 2020 & 2033
- Table 52: Nordics Salt Replacers Volume (K) Forecast, by Application 2020 & 2033
- Table 53: Rest of Europe Salt Replacers Revenue (billion) Forecast, by Application 2020 & 2033
- Table 54: Rest of Europe Salt Replacers Volume (K) Forecast, by Application 2020 & 2033
- Table 55: Global Salt Replacers Revenue billion Forecast, by Application 2020 & 2033
- Table 56: Global Salt Replacers Volume K Forecast, by Application 2020 & 2033
- Table 57: Global Salt Replacers Revenue billion Forecast, by Type 2020 & 2033
- Table 58: Global Salt Replacers Volume K Forecast, by Type 2020 & 2033
- Table 59: Global Salt Replacers Revenue billion Forecast, by Country 2020 & 2033
- Table 60: Global Salt Replacers Volume K Forecast, by Country 2020 & 2033
- Table 61: Turkey Salt Replacers Revenue (billion) Forecast, by Application 2020 & 2033
- Table 62: Turkey Salt Replacers Volume (K) Forecast, by Application 2020 & 2033
- Table 63: Israel Salt Replacers Revenue (billion) Forecast, by Application 2020 & 2033
- Table 64: Israel Salt Replacers Volume (K) Forecast, by Application 2020 & 2033
- Table 65: GCC Salt Replacers Revenue (billion) Forecast, by Application 2020 & 2033
- Table 66: GCC Salt Replacers Volume (K) Forecast, by Application 2020 & 2033
- Table 67: North Africa Salt Replacers Revenue (billion) Forecast, by Application 2020 & 2033
- Table 68: North Africa Salt Replacers Volume (K) Forecast, by Application 2020 & 2033
- Table 69: South Africa Salt Replacers Revenue (billion) Forecast, by Application 2020 & 2033
- Table 70: South Africa Salt Replacers Volume (K) Forecast, by Application 2020 & 2033
- Table 71: Rest of Middle East & Africa Salt Replacers Revenue (billion) Forecast, by Application 2020 & 2033
- Table 72: Rest of Middle East & Africa Salt Replacers Volume (K) Forecast, by Application 2020 & 2033
- Table 73: Global Salt Replacers Revenue billion Forecast, by Application 2020 & 2033
- Table 74: Global Salt Replacers Volume K Forecast, by Application 2020 & 2033
- Table 75: Global Salt Replacers Revenue billion Forecast, by Type 2020 & 2033
- Table 76: Global Salt Replacers Volume K Forecast, by Type 2020 & 2033
- Table 77: Global Salt Replacers Revenue billion Forecast, by Country 2020 & 2033
- Table 78: Global Salt Replacers Volume K Forecast, by Country 2020 & 2033
- Table 79: China Salt Replacers Revenue (billion) Forecast, by Application 2020 & 2033
- Table 80: China Salt Replacers Volume (K) Forecast, by Application 2020 & 2033
- Table 81: India Salt Replacers Revenue (billion) Forecast, by Application 2020 & 2033
- Table 82: India Salt Replacers Volume (K) Forecast, by Application 2020 & 2033
- Table 83: Japan Salt Replacers Revenue (billion) Forecast, by Application 2020 & 2033
- Table 84: Japan Salt Replacers Volume (K) Forecast, by Application 2020 & 2033
- Table 85: South Korea Salt Replacers Revenue (billion) Forecast, by Application 2020 & 2033
- Table 86: South Korea Salt Replacers Volume (K) Forecast, by Application 2020 & 2033
- Table 87: ASEAN Salt Replacers Revenue (billion) Forecast, by Application 2020 & 2033
- Table 88: ASEAN Salt Replacers Volume (K) Forecast, by Application 2020 & 2033
- Table 89: Oceania Salt Replacers Revenue (billion) Forecast, by Application 2020 & 2033
- Table 90: Oceania Salt Replacers Volume (K) Forecast, by Application 2020 & 2033
- Table 91: Rest of Asia Pacific Salt Replacers Revenue (billion) Forecast, by Application 2020 & 2033
- Table 92: Rest of Asia Pacific Salt Replacers Volume (K) Forecast, by Application 2020 & 2033
Frequently Asked Questions
1. What is the projected Compound Annual Growth Rate (CAGR) of the Salt Replacers?
The projected CAGR is approximately 6.71%.
2. Which companies are prominent players in the Salt Replacers?
Key companies in the market include Now Foods, Savoury Systems, DowDuPont, Nu-Tek Salt, CandP Additives, Benson’s Gourmet Seasoning.
3. What are the main segments of the Salt Replacers?
The market segments include Application, Type.
4. Can you provide details about the market size?
The market size is estimated to be USD 1.38 billion as of 2022.
5. What are some drivers contributing to market growth?
N/A
6. What are the notable trends driving market growth?
N/A
7. Are there any restraints impacting market growth?
N/A
8. Can you provide examples of recent developments in the market?
N/A
9. What pricing options are available for accessing the report?
Pricing options include single-user, multi-user, and enterprise licenses priced at USD 3950.00, USD 5925.00, and USD 7900.00 respectively.
10. Is the market size provided in terms of value or volume?
The market size is provided in terms of value, measured in billion and volume, measured in K.
11. Are there any specific market keywords associated with the report?
Yes, the market keyword associated with the report is "Salt Replacers," which aids in identifying and referencing the specific market segment covered.
12. How do I determine which pricing option suits my needs best?
The pricing options vary based on user requirements and access needs. Individual users may opt for single-user licenses, while businesses requiring broader access may choose multi-user or enterprise licenses for cost-effective access to the report.
13. Are there any additional resources or data provided in the Salt Replacers report?
While the report offers comprehensive insights, it's advisable to review the specific contents or supplementary materials provided to ascertain if additional resources or data are available.
14. How can I stay updated on further developments or reports in the Salt Replacers?
To stay informed about further developments, trends, and reports in the Salt Replacers, consider subscribing to industry newsletters, following relevant companies and organizations, or regularly checking reputable industry news sources and publications.
Methodology
Step 1 - Identification of Relevant Samples Size from Population Database


Step 2 - Approaches for Defining Global Market Size (Value, Volume* & Price*)

Note*: In applicable scenarios
Step 3 - Data Sources
Primary Research
- Web Analytics
- Survey Reports
- Research Institute
- Latest Research Reports
- Opinion Leaders
Secondary Research
- Annual Reports
- White Paper
- Latest Press Release
- Industry Association
- Paid Database
- Investor Presentations

Step 4 - Data Triangulation
Involves using different sources of information in order to increase the validity of a study
These sources are likely to be stakeholders in a program - participants, other researchers, program staff, other community members, and so on.
Then we put all data in single framework & apply various statistical tools to find out the dynamic on the market.
During the analysis stage, feedback from the stakeholder groups would be compared to determine areas of agreement as well as areas of divergence