

Key Insights
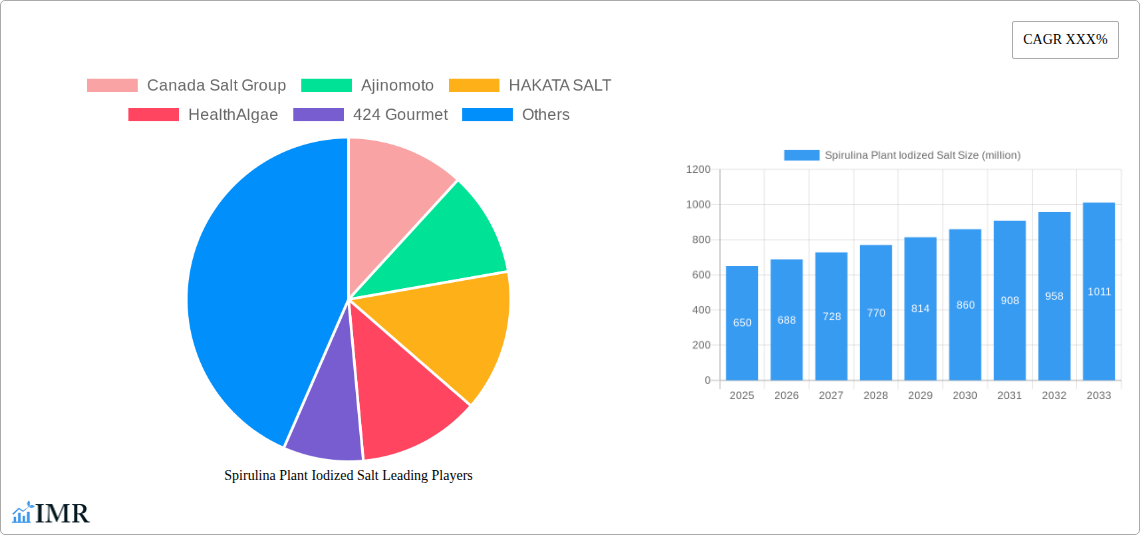
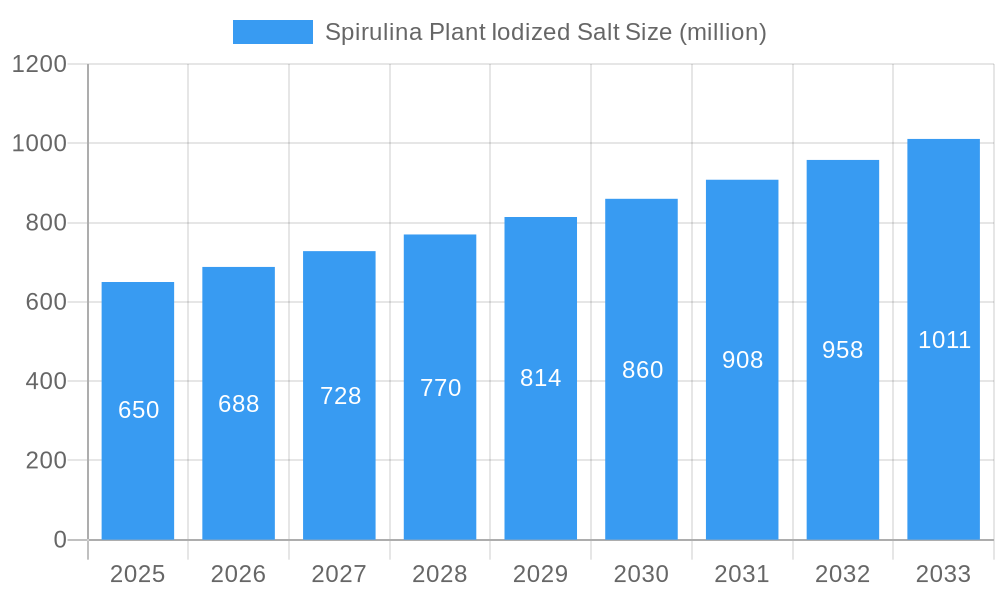
The global Spirulina Plant Iodized Salt market is poised for substantial growth, projected to reach an estimated market size of approximately $650 million by 2025, with a robust Compound Annual Growth Rate (CAGR) of around 5.8% anticipated throughout the forecast period of 2025-2033. This upward trajectory is primarily fueled by the increasing consumer demand for fortified food products and the growing awareness surrounding the health benefits associated with iodine and spirulina. The "Add Ferrous Potassium Chloride/Ferrous Sodium Chloride" segment is expected to lead the market due to its superior bioavailability and wider applications in food fortification, particularly in regions with high incidences of iodine deficiency disorders. Furthermore, the "Baking Industrial" and "Candy Industrial" applications are anticipated to be significant contributors, driven by the expanding processed food industry and the demand for functional ingredients that enhance both nutritional value and shelf life.
Spirulina Plant Iodized Salt Market Size (In Million)
The market dynamics are further shaped by evolving consumer preferences towards healthier and naturally sourced ingredients, positioning spirulina-infused iodized salt as a premium product. While the market exhibits strong growth potential, certain restraints such as stringent regulatory compliances for food additives and the fluctuating prices of raw materials, particularly spirulina, could pose challenges. However, technological advancements in spirulina cultivation and salt processing, coupled with strategic collaborations and product innovations by key market players like Ajinomoto, Canada Salt Group, and China National Salt Group, are expected to mitigate these challenges. The Asia Pacific region, led by China and India, is anticipated to dominate the market share owing to a large population, increasing disposable incomes, and a growing focus on public health initiatives promoting iodized salt consumption.
Spirulina Plant Iodized Salt Company Market Share
Spirulina Plant Iodized Salt Market Dynamics & Structure
The global Spirulina Plant Iodized Salt market is characterized by a moderately concentrated competitive landscape, with a few key players holding significant market share, alongside a substantial number of smaller regional manufacturers. Technological innovation is a primary driver, fueled by advancements in spirulina cultivation and processing, enabling enhanced nutrient profiles and novel product formulations. Regulatory frameworks surrounding food fortification and additive standards play a crucial role in shaping market access and product development. The presence of competitive product substitutes, such as traditional iodized salt and other mineral-fortified salts, necessitates continuous differentiation and value proposition refinement. End-user demographics are shifting towards health-conscious consumers seeking functional food ingredients, driving demand for products perceived as beneficial. Mergers and acquisitions (M&A) are likely to become more prominent as larger entities seek to consolidate market share and acquire innovative technologies, potentially leading to increased market concentration.
- Market Concentration: Moderately concentrated, with a significant presence of both large multinational corporations and specialized niche players.
- Technological Innovation Drivers: Advancements in spirulina cultivation techniques, extraction processes, and microencapsulation for enhanced stability.
- Regulatory Frameworks: Stringent food safety standards, fortification mandates, and labeling requirements influence product development and market entry.
- Competitive Product Substitutes: Standard iodized salt, sea salt, Himalayan pink salt, and other mineral-fortified salt alternatives.
- End-User Demographics: Growing segment of health-conscious consumers, athletes, and individuals with specific dietary needs.
- M&A Trends: Potential for consolidation as companies seek to expand product portfolios and geographical reach.
Spirulina Plant Iodized Salt Growth Trends & Insights
The Spirulina Plant Iodized Salt market is poised for substantial growth driven by escalating consumer awareness of health and wellness, coupled with the inherent nutritional benefits of spirulina. The market size, estimated to reach approximately $1,850 million in 2025, is projected to witness a robust Compound Annual Growth Rate (CAGR) of 8.5% during the forecast period of 2025–2033. This upward trajectory is underpinned by increasing demand for natural and nutrient-rich food ingredients across various applications, from industrial baking to gourmet food production. Adoption rates for spirulina-fortified salt are steadily rising as consumers actively seek out products that offer added value beyond basic nutrition. Technological disruptions, particularly in sustainable spirulina farming and efficient extraction methods, are further enhancing product quality and cost-effectiveness, thereby broadening market accessibility. Consumer behavior is shifting towards preventative health measures, with a growing preference for foods that contribute to overall well-being. This includes a demand for ingredients that offer antioxidants, vitamins, and minerals, all of which are abundant in spirulina. The integration of spirulina into everyday staples like salt provides a convenient and accessible way for consumers to incorporate these benefits into their diets. The market penetration of Spirulina Plant Iodized Salt is expected to significantly increase as more manufacturers recognize its potential and invest in production capabilities. Educational initiatives by industry players and health organizations regarding the synergistic benefits of spirulina and iodized salt will also play a crucial role in driving consumer adoption and market expansion. The market is anticipated to reach an estimated value of $3,500 million by 2033, reflecting a significant expansion from its base year valuation.
Dominant Regions, Countries, or Segments in Spirulina Plant Iodized Salt
The global Spirulina Plant Iodized Salt market is experiencing dynamic regional growth, with Asia Pacific emerging as a dominant force, largely driven by its vast population, increasing disposable incomes, and a burgeoning health and wellness consciousness. Within this region, countries like China and India are pivotal, owing to their substantial agricultural production capabilities and a growing domestic market for functional foods. The Baking Industrial segment is projected to be a leading application driving this dominance. This is attributed to the rising demand for fortified ingredients in processed foods, where spirulina's vibrant natural color and nutritional enhancement properties are highly valued. Manufacturers are increasingly incorporating Spirulina Plant Iodized Salt into bread, pastries, and other baked goods to offer consumers a healthier alternative without compromising taste or appearance. The No-add Ferrous Potassium Chloride/Ferrous Sodium Chloride type is also showing significant traction, aligning with consumer preferences for "clean label" products and a desire to minimize additive intake.
- Dominant Region: Asia Pacific, with China and India at the forefront.
- Key Drivers: Large population, growing middle class, increased health awareness, supportive government policies for food fortification, and established salt production infrastructure.
- Market Share Potential: Expected to hold over 35% of the global market share by 2033.
- Leading Application Segment: Baking Industrial.
- Key Drivers: Demand for natural colorants, nutritional fortification in processed foods, versatility in dough formulations, and consumer preference for healthier baked goods.
- Growth Potential: Projected to account for approximately 25% of the total market by 2033, with a CAGR of 9.0%.
- Prominent Type: No-add Ferrous Potassium Chloride/Ferrous Sodium Chloride.
- Key Drivers: Consumer preference for cleaner ingredient lists, perceived health benefits of avoiding certain additives, and the growing "free-from" trend.
- Market Penetration: Expected to capture over 45% of the total market by 2033.
Spirulina Plant Iodized Salt Product Landscape
The Spirulina Plant Iodized Salt product landscape is evolving with innovative offerings that leverage spirulina's natural properties. Manufacturers are developing specialized blends that incorporate high-purity spirulina extract to provide antioxidants, vitamins, and minerals alongside essential iodine. Unique selling propositions include enhanced nutritional profiles for healthier food products and natural coloring agents for visually appealing food items. Technological advancements focus on stable microencapsulation techniques to protect spirulina's sensitive nutrients and ensure uniform distribution within the salt matrix. These innovations cater to the growing demand for functional ingredients in both industrial and consumer markets.
Key Drivers, Barriers & Challenges in Spirulina Plant Iodized Salt
Key Drivers: The Spirulina Plant Iodized Salt market is propelled by a confluence of factors including the escalating global demand for health-conscious food products, driven by increasing consumer awareness of the benefits of nutrient-rich ingredients. Technological advancements in spirulina cultivation and processing are making it more accessible and cost-effective. Government initiatives promoting food fortification for public health also act as significant drivers.
Key Barriers & Challenges: The primary challenges include potential price volatility of spirulina raw materials due to agricultural dependencies and climatic factors. Strict regulatory hurdles for novel food ingredients in certain regions can slow down market entry. Consumer perception and education regarding the efficacy and safety of spirulina-fortified salt also pose a challenge. Supply chain complexities and ensuring consistent quality across diverse geographical production sites are ongoing concerns.
Emerging Opportunities in Spirulina Plant Iodized Salt
Emerging opportunities lie in the expansion of premium gourmet salt segments, where Spirulina Plant Iodized Salt can be positioned as a functional and aesthetically unique ingredient. Untapped markets in regions with high iodine deficiency rates, coupled with increasing health awareness, present significant growth potential. Innovative applications in the functional beverage and sports nutrition sectors, beyond traditional food applications, are also being explored. The development of specialized formulations catering to specific dietary needs, such as plant-based diets seeking micronutrient enhancement, offers further avenues for market penetration.
Growth Accelerators in the Spirulina Plant Iodized Salt Industry
Long-term growth in the Spirulina Plant Iodized Salt industry is being accelerated by continuous technological breakthroughs in spirulina cultivation, leading to higher yields and improved quality. Strategic partnerships between spirulina producers, salt manufacturers, and food companies are crucial for market penetration and product development. Market expansion strategies focusing on emerging economies with a growing middle class and rising health consciousness are also key growth catalysts. Furthermore, ongoing research highlighting the synergistic health benefits of spirulina and iodized salt will continue to fuel consumer demand and industry investment.
Key Players Shaping the Spirulina Plant Iodized Salt Market
- Canada Salt Group
- Ajinomoto
- HAKATA SALT
- HealthAlgae
- 424 Gourmet
- Gustus Vitae
- China National Salt Group
- Jiangxi Salt Industry Group
- Guizhou Salt Industry (Group)
- Shandong Luyan Group
- Yunnan Energy Investment
- Da Lian Yan Hua Group
- Jiangxi JINGHAO Salt Chemical
Notable Milestones in Spirulina Plant Iodized Salt Sector
- 2019: Increased research into the nutritional synergies of spirulina and iodized salt, sparking early industry interest.
- 2020: Several small-scale producers begin experimenting with spirulina-fortified salt formulations for niche markets.
- 2021: First major food industry trade shows feature spirulina-fortified salt as an emerging ingredient.
- 2022: Advancements in spirulina cultivation techniques lead to more consistent and cost-effective raw material supply.
- 2023: Key players like Ajinomoto begin piloting spirulina-fortified salt in select markets.
- 2024: Launch of several consumer-facing gourmet spirulina-fortified salt brands, gaining traction in specialized retail.
- 2025 (Estimated): Increased adoption by industrial bakeries for its coloring and nutritional properties.
In-Depth Spirulina Plant Iodized Salt Market Outlook
The future outlook for the Spirulina Plant Iodized Salt market is exceptionally promising, driven by accelerating growth accelerators such as continuous technological innovation in spirulina production and strategic collaborations across the value chain. The expanding consumer base, increasingly educated on the health benefits of fortified foods, is a significant catalyst. Market expansion into developing economies and the exploration of novel applications in functional foods and beverages will further unlock substantial growth potential. The industry is well-positioned to capitalize on the global shift towards preventative healthcare and the demand for natural, nutrient-dense ingredients.
Spirulina Plant Iodized Salt Segmentation
-
1. Application
- 1.1. Baking Industrial
- 1.2. Candy Industrial
- 1.3. Meat and Poultry
- 1.4. Others
-
2. Type
- 2.1. Add Ferrous Potassium Chloride/Ferrous Sodium Chloride
- 2.2. No-add Ferrous Potassium Chloride/Ferrous Sodium Chloride
Spirulina Plant Iodized Salt Segmentation By Geography
-
1. North America
- 1.1. United States
- 1.2. Canada
- 1.3. Mexico
-
2. South America
- 2.1. Brazil
- 2.2. Argentina
- 2.3. Rest of South America
-
3. Europe
- 3.1. United Kingdom
- 3.2. Germany
- 3.3. France
- 3.4. Italy
- 3.5. Spain
- 3.6. Russia
- 3.7. Benelux
- 3.8. Nordics
- 3.9. Rest of Europe
-
4. Middle East & Africa
- 4.1. Turkey
- 4.2. Israel
- 4.3. GCC
- 4.4. North Africa
- 4.5. South Africa
- 4.6. Rest of Middle East & Africa
-
5. Asia Pacific
- 5.1. China
- 5.2. India
- 5.3. Japan
- 5.4. South Korea
- 5.5. ASEAN
- 5.6. Oceania
- 5.7. Rest of Asia Pacific
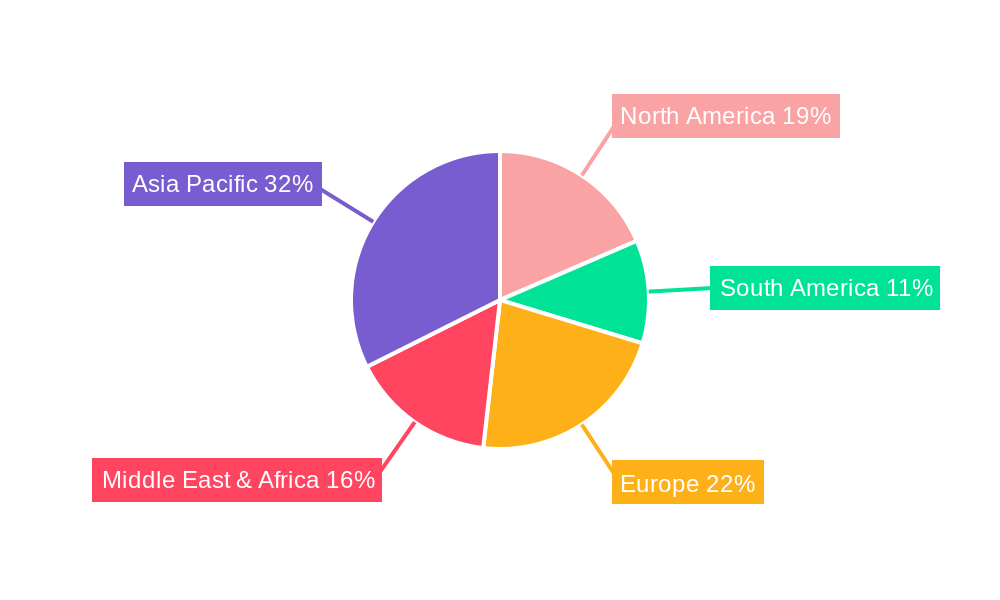
Spirulina Plant Iodized Salt Regional Market Share
Geographic Coverage of Spirulina Plant Iodized Salt
Spirulina Plant Iodized Salt REPORT HIGHLIGHTS
| Aspects | Details |
|---|---|
| Study Period | 2020-2034 |
| Base Year | 2025 |
| Estimated Year | 2026 |
| Forecast Period | 2026-2034 |
| Historical Period | 2020-2025 |
| Growth Rate | CAGR of 7.5% from 2020-2034 |
| Segmentation |
|
Table of Contents
- 1. Introduction
- 1.1. Research Scope
- 1.2. Market Segmentation
- 1.3. Research Methodology
- 1.4. Definitions and Assumptions
- 2. Executive Summary
- 2.1. Introduction
- 3. Market Dynamics
- 3.1. Introduction
- 3.2. Market Drivers
- 3.3. Market Restrains
- 3.4. Market Trends
- 4. Market Factor Analysis
- 4.1. Porters Five Forces
- 4.2. Supply/Value Chain
- 4.3. PESTEL analysis
- 4.4. Market Entropy
- 4.5. Patent/Trademark Analysis
- 5. Global Spirulina Plant Iodized Salt Analysis, Insights and Forecast, 2020-2032
- 5.1. Market Analysis, Insights and Forecast - by Application
- 5.1.1. Baking Industrial
- 5.1.2. Candy Industrial
- 5.1.3. Meat and Poultry
- 5.1.4. Others
- 5.2. Market Analysis, Insights and Forecast - by Type
- 5.2.1. Add Ferrous Potassium Chloride/Ferrous Sodium Chloride
- 5.2.2. No-add Ferrous Potassium Chloride/Ferrous Sodium Chloride
- 5.3. Market Analysis, Insights and Forecast - by Region
- 5.3.1. North America
- 5.3.2. South America
- 5.3.3. Europe
- 5.3.4. Middle East & Africa
- 5.3.5. Asia Pacific
- 5.1. Market Analysis, Insights and Forecast - by Application
- 6. North America Spirulina Plant Iodized Salt Analysis, Insights and Forecast, 2020-2032
- 6.1. Market Analysis, Insights and Forecast - by Application
- 6.1.1. Baking Industrial
- 6.1.2. Candy Industrial
- 6.1.3. Meat and Poultry
- 6.1.4. Others
- 6.2. Market Analysis, Insights and Forecast - by Type
- 6.2.1. Add Ferrous Potassium Chloride/Ferrous Sodium Chloride
- 6.2.2. No-add Ferrous Potassium Chloride/Ferrous Sodium Chloride
- 6.1. Market Analysis, Insights and Forecast - by Application
- 7. South America Spirulina Plant Iodized Salt Analysis, Insights and Forecast, 2020-2032
- 7.1. Market Analysis, Insights and Forecast - by Application
- 7.1.1. Baking Industrial
- 7.1.2. Candy Industrial
- 7.1.3. Meat and Poultry
- 7.1.4. Others
- 7.2. Market Analysis, Insights and Forecast - by Type
- 7.2.1. Add Ferrous Potassium Chloride/Ferrous Sodium Chloride
- 7.2.2. No-add Ferrous Potassium Chloride/Ferrous Sodium Chloride
- 7.1. Market Analysis, Insights and Forecast - by Application
- 8. Europe Spirulina Plant Iodized Salt Analysis, Insights and Forecast, 2020-2032
- 8.1. Market Analysis, Insights and Forecast - by Application
- 8.1.1. Baking Industrial
- 8.1.2. Candy Industrial
- 8.1.3. Meat and Poultry
- 8.1.4. Others
- 8.2. Market Analysis, Insights and Forecast - by Type
- 8.2.1. Add Ferrous Potassium Chloride/Ferrous Sodium Chloride
- 8.2.2. No-add Ferrous Potassium Chloride/Ferrous Sodium Chloride
- 8.1. Market Analysis, Insights and Forecast - by Application
- 9. Middle East & Africa Spirulina Plant Iodized Salt Analysis, Insights and Forecast, 2020-2032
- 9.1. Market Analysis, Insights and Forecast - by Application
- 9.1.1. Baking Industrial
- 9.1.2. Candy Industrial
- 9.1.3. Meat and Poultry
- 9.1.4. Others
- 9.2. Market Analysis, Insights and Forecast - by Type
- 9.2.1. Add Ferrous Potassium Chloride/Ferrous Sodium Chloride
- 9.2.2. No-add Ferrous Potassium Chloride/Ferrous Sodium Chloride
- 9.1. Market Analysis, Insights and Forecast - by Application
- 10. Asia Pacific Spirulina Plant Iodized Salt Analysis, Insights and Forecast, 2020-2032
- 10.1. Market Analysis, Insights and Forecast - by Application
- 10.1.1. Baking Industrial
- 10.1.2. Candy Industrial
- 10.1.3. Meat and Poultry
- 10.1.4. Others
- 10.2. Market Analysis, Insights and Forecast - by Type
- 10.2.1. Add Ferrous Potassium Chloride/Ferrous Sodium Chloride
- 10.2.2. No-add Ferrous Potassium Chloride/Ferrous Sodium Chloride
- 10.1. Market Analysis, Insights and Forecast - by Application
- 11. Competitive Analysis
- 11.1. Global Market Share Analysis 2025
- 11.2. Company Profiles
- 11.2.1 Canada Salt Group
- 11.2.1.1. Overview
- 11.2.1.2. Products
- 11.2.1.3. SWOT Analysis
- 11.2.1.4. Recent Developments
- 11.2.1.5. Financials (Based on Availability)
- 11.2.2 Ajinomoto
- 11.2.2.1. Overview
- 11.2.2.2. Products
- 11.2.2.3. SWOT Analysis
- 11.2.2.4. Recent Developments
- 11.2.2.5. Financials (Based on Availability)
- 11.2.3 HAKATA SALT
- 11.2.3.1. Overview
- 11.2.3.2. Products
- 11.2.3.3. SWOT Analysis
- 11.2.3.4. Recent Developments
- 11.2.3.5. Financials (Based on Availability)
- 11.2.4 HealthAlgae
- 11.2.4.1. Overview
- 11.2.4.2. Products
- 11.2.4.3. SWOT Analysis
- 11.2.4.4. Recent Developments
- 11.2.4.5. Financials (Based on Availability)
- 11.2.5 424 Gourmet
- 11.2.5.1. Overview
- 11.2.5.2. Products
- 11.2.5.3. SWOT Analysis
- 11.2.5.4. Recent Developments
- 11.2.5.5. Financials (Based on Availability)
- 11.2.6 Gustus Vitae
- 11.2.6.1. Overview
- 11.2.6.2. Products
- 11.2.6.3. SWOT Analysis
- 11.2.6.4. Recent Developments
- 11.2.6.5. Financials (Based on Availability)
- 11.2.7 China National Salt Group
- 11.2.7.1. Overview
- 11.2.7.2. Products
- 11.2.7.3. SWOT Analysis
- 11.2.7.4. Recent Developments
- 11.2.7.5. Financials (Based on Availability)
- 11.2.8 Jiangxi Salt Industry Group
- 11.2.8.1. Overview
- 11.2.8.2. Products
- 11.2.8.3. SWOT Analysis
- 11.2.8.4. Recent Developments
- 11.2.8.5. Financials (Based on Availability)
- 11.2.9 Guizhou Salt Industry (Group)
- 11.2.9.1. Overview
- 11.2.9.2. Products
- 11.2.9.3. SWOT Analysis
- 11.2.9.4. Recent Developments
- 11.2.9.5. Financials (Based on Availability)
- 11.2.10 Shandong Luyan Group
- 11.2.10.1. Overview
- 11.2.10.2. Products
- 11.2.10.3. SWOT Analysis
- 11.2.10.4. Recent Developments
- 11.2.10.5. Financials (Based on Availability)
- 11.2.11 Yunnan Energy Investment
- 11.2.11.1. Overview
- 11.2.11.2. Products
- 11.2.11.3. SWOT Analysis
- 11.2.11.4. Recent Developments
- 11.2.11.5. Financials (Based on Availability)
- 11.2.12 Da Lian Yan Hua Group
- 11.2.12.1. Overview
- 11.2.12.2. Products
- 11.2.12.3. SWOT Analysis
- 11.2.12.4. Recent Developments
- 11.2.12.5. Financials (Based on Availability)
- 11.2.13 Jiangxi JINGHAO Salt Chemical
- 11.2.13.1. Overview
- 11.2.13.2. Products
- 11.2.13.3. SWOT Analysis
- 11.2.13.4. Recent Developments
- 11.2.13.5. Financials (Based on Availability)
- 11.2.1 Canada Salt Group
List of Figures
- Figure 1: Global Spirulina Plant Iodized Salt Revenue Breakdown (undefined, %) by Region 2025 & 2033
- Figure 2: Global Spirulina Plant Iodized Salt Volume Breakdown (K, %) by Region 2025 & 2033
- Figure 3: North America Spirulina Plant Iodized Salt Revenue (undefined), by Application 2025 & 2033
- Figure 4: North America Spirulina Plant Iodized Salt Volume (K), by Application 2025 & 2033
- Figure 5: North America Spirulina Plant Iodized Salt Revenue Share (%), by Application 2025 & 2033
- Figure 6: North America Spirulina Plant Iodized Salt Volume Share (%), by Application 2025 & 2033
- Figure 7: North America Spirulina Plant Iodized Salt Revenue (undefined), by Type 2025 & 2033
- Figure 8: North America Spirulina Plant Iodized Salt Volume (K), by Type 2025 & 2033
- Figure 9: North America Spirulina Plant Iodized Salt Revenue Share (%), by Type 2025 & 2033
- Figure 10: North America Spirulina Plant Iodized Salt Volume Share (%), by Type 2025 & 2033
- Figure 11: North America Spirulina Plant Iodized Salt Revenue (undefined), by Country 2025 & 2033
- Figure 12: North America Spirulina Plant Iodized Salt Volume (K), by Country 2025 & 2033
- Figure 13: North America Spirulina Plant Iodized Salt Revenue Share (%), by Country 2025 & 2033
- Figure 14: North America Spirulina Plant Iodized Salt Volume Share (%), by Country 2025 & 2033
- Figure 15: South America Spirulina Plant Iodized Salt Revenue (undefined), by Application 2025 & 2033
- Figure 16: South America Spirulina Plant Iodized Salt Volume (K), by Application 2025 & 2033
- Figure 17: South America Spirulina Plant Iodized Salt Revenue Share (%), by Application 2025 & 2033
- Figure 18: South America Spirulina Plant Iodized Salt Volume Share (%), by Application 2025 & 2033
- Figure 19: South America Spirulina Plant Iodized Salt Revenue (undefined), by Type 2025 & 2033
- Figure 20: South America Spirulina Plant Iodized Salt Volume (K), by Type 2025 & 2033
- Figure 21: South America Spirulina Plant Iodized Salt Revenue Share (%), by Type 2025 & 2033
- Figure 22: South America Spirulina Plant Iodized Salt Volume Share (%), by Type 2025 & 2033
- Figure 23: South America Spirulina Plant Iodized Salt Revenue (undefined), by Country 2025 & 2033
- Figure 24: South America Spirulina Plant Iodized Salt Volume (K), by Country 2025 & 2033
- Figure 25: South America Spirulina Plant Iodized Salt Revenue Share (%), by Country 2025 & 2033
- Figure 26: South America Spirulina Plant Iodized Salt Volume Share (%), by Country 2025 & 2033
- Figure 27: Europe Spirulina Plant Iodized Salt Revenue (undefined), by Application 2025 & 2033
- Figure 28: Europe Spirulina Plant Iodized Salt Volume (K), by Application 2025 & 2033
- Figure 29: Europe Spirulina Plant Iodized Salt Revenue Share (%), by Application 2025 & 2033
- Figure 30: Europe Spirulina Plant Iodized Salt Volume Share (%), by Application 2025 & 2033
- Figure 31: Europe Spirulina Plant Iodized Salt Revenue (undefined), by Type 2025 & 2033
- Figure 32: Europe Spirulina Plant Iodized Salt Volume (K), by Type 2025 & 2033
- Figure 33: Europe Spirulina Plant Iodized Salt Revenue Share (%), by Type 2025 & 2033
- Figure 34: Europe Spirulina Plant Iodized Salt Volume Share (%), by Type 2025 & 2033
- Figure 35: Europe Spirulina Plant Iodized Salt Revenue (undefined), by Country 2025 & 2033
- Figure 36: Europe Spirulina Plant Iodized Salt Volume (K), by Country 2025 & 2033
- Figure 37: Europe Spirulina Plant Iodized Salt Revenue Share (%), by Country 2025 & 2033
- Figure 38: Europe Spirulina Plant Iodized Salt Volume Share (%), by Country 2025 & 2033
- Figure 39: Middle East & Africa Spirulina Plant Iodized Salt Revenue (undefined), by Application 2025 & 2033
- Figure 40: Middle East & Africa Spirulina Plant Iodized Salt Volume (K), by Application 2025 & 2033
- Figure 41: Middle East & Africa Spirulina Plant Iodized Salt Revenue Share (%), by Application 2025 & 2033
- Figure 42: Middle East & Africa Spirulina Plant Iodized Salt Volume Share (%), by Application 2025 & 2033
- Figure 43: Middle East & Africa Spirulina Plant Iodized Salt Revenue (undefined), by Type 2025 & 2033
- Figure 44: Middle East & Africa Spirulina Plant Iodized Salt Volume (K), by Type 2025 & 2033
- Figure 45: Middle East & Africa Spirulina Plant Iodized Salt Revenue Share (%), by Type 2025 & 2033
- Figure 46: Middle East & Africa Spirulina Plant Iodized Salt Volume Share (%), by Type 2025 & 2033
- Figure 47: Middle East & Africa Spirulina Plant Iodized Salt Revenue (undefined), by Country 2025 & 2033
- Figure 48: Middle East & Africa Spirulina Plant Iodized Salt Volume (K), by Country 2025 & 2033
- Figure 49: Middle East & Africa Spirulina Plant Iodized Salt Revenue Share (%), by Country 2025 & 2033
- Figure 50: Middle East & Africa Spirulina Plant Iodized Salt Volume Share (%), by Country 2025 & 2033
- Figure 51: Asia Pacific Spirulina Plant Iodized Salt Revenue (undefined), by Application 2025 & 2033
- Figure 52: Asia Pacific Spirulina Plant Iodized Salt Volume (K), by Application 2025 & 2033
- Figure 53: Asia Pacific Spirulina Plant Iodized Salt Revenue Share (%), by Application 2025 & 2033
- Figure 54: Asia Pacific Spirulina Plant Iodized Salt Volume Share (%), by Application 2025 & 2033
- Figure 55: Asia Pacific Spirulina Plant Iodized Salt Revenue (undefined), by Type 2025 & 2033
- Figure 56: Asia Pacific Spirulina Plant Iodized Salt Volume (K), by Type 2025 & 2033
- Figure 57: Asia Pacific Spirulina Plant Iodized Salt Revenue Share (%), by Type 2025 & 2033
- Figure 58: Asia Pacific Spirulina Plant Iodized Salt Volume Share (%), by Type 2025 & 2033
- Figure 59: Asia Pacific Spirulina Plant Iodized Salt Revenue (undefined), by Country 2025 & 2033
- Figure 60: Asia Pacific Spirulina Plant Iodized Salt Volume (K), by Country 2025 & 2033
- Figure 61: Asia Pacific Spirulina Plant Iodized Salt Revenue Share (%), by Country 2025 & 2033
- Figure 62: Asia Pacific Spirulina Plant Iodized Salt Volume Share (%), by Country 2025 & 2033
List of Tables
- Table 1: Global Spirulina Plant Iodized Salt Revenue undefined Forecast, by Application 2020 & 2033
- Table 2: Global Spirulina Plant Iodized Salt Volume K Forecast, by Application 2020 & 2033
- Table 3: Global Spirulina Plant Iodized Salt Revenue undefined Forecast, by Type 2020 & 2033
- Table 4: Global Spirulina Plant Iodized Salt Volume K Forecast, by Type 2020 & 2033
- Table 5: Global Spirulina Plant Iodized Salt Revenue undefined Forecast, by Region 2020 & 2033
- Table 6: Global Spirulina Plant Iodized Salt Volume K Forecast, by Region 2020 & 2033
- Table 7: Global Spirulina Plant Iodized Salt Revenue undefined Forecast, by Application 2020 & 2033
- Table 8: Global Spirulina Plant Iodized Salt Volume K Forecast, by Application 2020 & 2033
- Table 9: Global Spirulina Plant Iodized Salt Revenue undefined Forecast, by Type 2020 & 2033
- Table 10: Global Spirulina Plant Iodized Salt Volume K Forecast, by Type 2020 & 2033
- Table 11: Global Spirulina Plant Iodized Salt Revenue undefined Forecast, by Country 2020 & 2033
- Table 12: Global Spirulina Plant Iodized Salt Volume K Forecast, by Country 2020 & 2033
- Table 13: United States Spirulina Plant Iodized Salt Revenue (undefined) Forecast, by Application 2020 & 2033
- Table 14: United States Spirulina Plant Iodized Salt Volume (K) Forecast, by Application 2020 & 2033
- Table 15: Canada Spirulina Plant Iodized Salt Revenue (undefined) Forecast, by Application 2020 & 2033
- Table 16: Canada Spirulina Plant Iodized Salt Volume (K) Forecast, by Application 2020 & 2033
- Table 17: Mexico Spirulina Plant Iodized Salt Revenue (undefined) Forecast, by Application 2020 & 2033
- Table 18: Mexico Spirulina Plant Iodized Salt Volume (K) Forecast, by Application 2020 & 2033
- Table 19: Global Spirulina Plant Iodized Salt Revenue undefined Forecast, by Application 2020 & 2033
- Table 20: Global Spirulina Plant Iodized Salt Volume K Forecast, by Application 2020 & 2033
- Table 21: Global Spirulina Plant Iodized Salt Revenue undefined Forecast, by Type 2020 & 2033
- Table 22: Global Spirulina Plant Iodized Salt Volume K Forecast, by Type 2020 & 2033
- Table 23: Global Spirulina Plant Iodized Salt Revenue undefined Forecast, by Country 2020 & 2033
- Table 24: Global Spirulina Plant Iodized Salt Volume K Forecast, by Country 2020 & 2033
- Table 25: Brazil Spirulina Plant Iodized Salt Revenue (undefined) Forecast, by Application 2020 & 2033
- Table 26: Brazil Spirulina Plant Iodized Salt Volume (K) Forecast, by Application 2020 & 2033
- Table 27: Argentina Spirulina Plant Iodized Salt Revenue (undefined) Forecast, by Application 2020 & 2033
- Table 28: Argentina Spirulina Plant Iodized Salt Volume (K) Forecast, by Application 2020 & 2033
- Table 29: Rest of South America Spirulina Plant Iodized Salt Revenue (undefined) Forecast, by Application 2020 & 2033
- Table 30: Rest of South America Spirulina Plant Iodized Salt Volume (K) Forecast, by Application 2020 & 2033
- Table 31: Global Spirulina Plant Iodized Salt Revenue undefined Forecast, by Application 2020 & 2033
- Table 32: Global Spirulina Plant Iodized Salt Volume K Forecast, by Application 2020 & 2033
- Table 33: Global Spirulina Plant Iodized Salt Revenue undefined Forecast, by Type 2020 & 2033
- Table 34: Global Spirulina Plant Iodized Salt Volume K Forecast, by Type 2020 & 2033
- Table 35: Global Spirulina Plant Iodized Salt Revenue undefined Forecast, by Country 2020 & 2033
- Table 36: Global Spirulina Plant Iodized Salt Volume K Forecast, by Country 2020 & 2033
- Table 37: United Kingdom Spirulina Plant Iodized Salt Revenue (undefined) Forecast, by Application 2020 & 2033
- Table 38: United Kingdom Spirulina Plant Iodized Salt Volume (K) Forecast, by Application 2020 & 2033
- Table 39: Germany Spirulina Plant Iodized Salt Revenue (undefined) Forecast, by Application 2020 & 2033
- Table 40: Germany Spirulina Plant Iodized Salt Volume (K) Forecast, by Application 2020 & 2033
- Table 41: France Spirulina Plant Iodized Salt Revenue (undefined) Forecast, by Application 2020 & 2033
- Table 42: France Spirulina Plant Iodized Salt Volume (K) Forecast, by Application 2020 & 2033
- Table 43: Italy Spirulina Plant Iodized Salt Revenue (undefined) Forecast, by Application 2020 & 2033
- Table 44: Italy Spirulina Plant Iodized Salt Volume (K) Forecast, by Application 2020 & 2033
- Table 45: Spain Spirulina Plant Iodized Salt Revenue (undefined) Forecast, by Application 2020 & 2033
- Table 46: Spain Spirulina Plant Iodized Salt Volume (K) Forecast, by Application 2020 & 2033
- Table 47: Russia Spirulina Plant Iodized Salt Revenue (undefined) Forecast, by Application 2020 & 2033
- Table 48: Russia Spirulina Plant Iodized Salt Volume (K) Forecast, by Application 2020 & 2033
- Table 49: Benelux Spirulina Plant Iodized Salt Revenue (undefined) Forecast, by Application 2020 & 2033
- Table 50: Benelux Spirulina Plant Iodized Salt Volume (K) Forecast, by Application 2020 & 2033
- Table 51: Nordics Spirulina Plant Iodized Salt Revenue (undefined) Forecast, by Application 2020 & 2033
- Table 52: Nordics Spirulina Plant Iodized Salt Volume (K) Forecast, by Application 2020 & 2033
- Table 53: Rest of Europe Spirulina Plant Iodized Salt Revenue (undefined) Forecast, by Application 2020 & 2033
- Table 54: Rest of Europe Spirulina Plant Iodized Salt Volume (K) Forecast, by Application 2020 & 2033
- Table 55: Global Spirulina Plant Iodized Salt Revenue undefined Forecast, by Application 2020 & 2033
- Table 56: Global Spirulina Plant Iodized Salt Volume K Forecast, by Application 2020 & 2033
- Table 57: Global Spirulina Plant Iodized Salt Revenue undefined Forecast, by Type 2020 & 2033
- Table 58: Global Spirulina Plant Iodized Salt Volume K Forecast, by Type 2020 & 2033
- Table 59: Global Spirulina Plant Iodized Salt Revenue undefined Forecast, by Country 2020 & 2033
- Table 60: Global Spirulina Plant Iodized Salt Volume K Forecast, by Country 2020 & 2033
- Table 61: Turkey Spirulina Plant Iodized Salt Revenue (undefined) Forecast, by Application 2020 & 2033
- Table 62: Turkey Spirulina Plant Iodized Salt Volume (K) Forecast, by Application 2020 & 2033
- Table 63: Israel Spirulina Plant Iodized Salt Revenue (undefined) Forecast, by Application 2020 & 2033
- Table 64: Israel Spirulina Plant Iodized Salt Volume (K) Forecast, by Application 2020 & 2033
- Table 65: GCC Spirulina Plant Iodized Salt Revenue (undefined) Forecast, by Application 2020 & 2033
- Table 66: GCC Spirulina Plant Iodized Salt Volume (K) Forecast, by Application 2020 & 2033
- Table 67: North Africa Spirulina Plant Iodized Salt Revenue (undefined) Forecast, by Application 2020 & 2033
- Table 68: North Africa Spirulina Plant Iodized Salt Volume (K) Forecast, by Application 2020 & 2033
- Table 69: South Africa Spirulina Plant Iodized Salt Revenue (undefined) Forecast, by Application 2020 & 2033
- Table 70: South Africa Spirulina Plant Iodized Salt Volume (K) Forecast, by Application 2020 & 2033
- Table 71: Rest of Middle East & Africa Spirulina Plant Iodized Salt Revenue (undefined) Forecast, by Application 2020 & 2033
- Table 72: Rest of Middle East & Africa Spirulina Plant Iodized Salt Volume (K) Forecast, by Application 2020 & 2033
- Table 73: Global Spirulina Plant Iodized Salt Revenue undefined Forecast, by Application 2020 & 2033
- Table 74: Global Spirulina Plant Iodized Salt Volume K Forecast, by Application 2020 & 2033
- Table 75: Global Spirulina Plant Iodized Salt Revenue undefined Forecast, by Type 2020 & 2033
- Table 76: Global Spirulina Plant Iodized Salt Volume K Forecast, by Type 2020 & 2033
- Table 77: Global Spirulina Plant Iodized Salt Revenue undefined Forecast, by Country 2020 & 2033
- Table 78: Global Spirulina Plant Iodized Salt Volume K Forecast, by Country 2020 & 2033
- Table 79: China Spirulina Plant Iodized Salt Revenue (undefined) Forecast, by Application 2020 & 2033
- Table 80: China Spirulina Plant Iodized Salt Volume (K) Forecast, by Application 2020 & 2033
- Table 81: India Spirulina Plant Iodized Salt Revenue (undefined) Forecast, by Application 2020 & 2033
- Table 82: India Spirulina Plant Iodized Salt Volume (K) Forecast, by Application 2020 & 2033
- Table 83: Japan Spirulina Plant Iodized Salt Revenue (undefined) Forecast, by Application 2020 & 2033
- Table 84: Japan Spirulina Plant Iodized Salt Volume (K) Forecast, by Application 2020 & 2033
- Table 85: South Korea Spirulina Plant Iodized Salt Revenue (undefined) Forecast, by Application 2020 & 2033
- Table 86: South Korea Spirulina Plant Iodized Salt Volume (K) Forecast, by Application 2020 & 2033
- Table 87: ASEAN Spirulina Plant Iodized Salt Revenue (undefined) Forecast, by Application 2020 & 2033
- Table 88: ASEAN Spirulina Plant Iodized Salt Volume (K) Forecast, by Application 2020 & 2033
- Table 89: Oceania Spirulina Plant Iodized Salt Revenue (undefined) Forecast, by Application 2020 & 2033
- Table 90: Oceania Spirulina Plant Iodized Salt Volume (K) Forecast, by Application 2020 & 2033
- Table 91: Rest of Asia Pacific Spirulina Plant Iodized Salt Revenue (undefined) Forecast, by Application 2020 & 2033
- Table 92: Rest of Asia Pacific Spirulina Plant Iodized Salt Volume (K) Forecast, by Application 2020 & 2033
Frequently Asked Questions
1. What is the projected Compound Annual Growth Rate (CAGR) of the Spirulina Plant Iodized Salt?
The projected CAGR is approximately 7.5%.
2. Which companies are prominent players in the Spirulina Plant Iodized Salt?
Key companies in the market include Canada Salt Group, Ajinomoto, HAKATA SALT, HealthAlgae, 424 Gourmet, Gustus Vitae, China National Salt Group, Jiangxi Salt Industry Group, Guizhou Salt Industry (Group), Shandong Luyan Group, Yunnan Energy Investment, Da Lian Yan Hua Group, Jiangxi JINGHAO Salt Chemical.
3. What are the main segments of the Spirulina Plant Iodized Salt?
The market segments include Application, Type.
4. Can you provide details about the market size?
The market size is estimated to be USD XXX N/A as of 2022.
5. What are some drivers contributing to market growth?
N/A
6. What are the notable trends driving market growth?
N/A
7. Are there any restraints impacting market growth?
N/A
8. Can you provide examples of recent developments in the market?
N/A
9. What pricing options are available for accessing the report?
Pricing options include single-user, multi-user, and enterprise licenses priced at USD 3950.00, USD 5925.00, and USD 7900.00 respectively.
10. Is the market size provided in terms of value or volume?
The market size is provided in terms of value, measured in N/A and volume, measured in K.
11. Are there any specific market keywords associated with the report?
Yes, the market keyword associated with the report is "Spirulina Plant Iodized Salt," which aids in identifying and referencing the specific market segment covered.
12. How do I determine which pricing option suits my needs best?
The pricing options vary based on user requirements and access needs. Individual users may opt for single-user licenses, while businesses requiring broader access may choose multi-user or enterprise licenses for cost-effective access to the report.
13. Are there any additional resources or data provided in the Spirulina Plant Iodized Salt report?
While the report offers comprehensive insights, it's advisable to review the specific contents or supplementary materials provided to ascertain if additional resources or data are available.
14. How can I stay updated on further developments or reports in the Spirulina Plant Iodized Salt?
To stay informed about further developments, trends, and reports in the Spirulina Plant Iodized Salt, consider subscribing to industry newsletters, following relevant companies and organizations, or regularly checking reputable industry news sources and publications.
Methodology
Step 1 - Identification of Relevant Samples Size from Population Database


Step 2 - Approaches for Defining Global Market Size (Value, Volume* & Price*)

Note*: In applicable scenarios
Step 3 - Data Sources
Primary Research
- Web Analytics
- Survey Reports
- Research Institute
- Latest Research Reports
- Opinion Leaders
Secondary Research
- Annual Reports
- White Paper
- Latest Press Release
- Industry Association
- Paid Database
- Investor Presentations

Step 4 - Data Triangulation
Involves using different sources of information in order to increase the validity of a study
These sources are likely to be stakeholders in a program - participants, other researchers, program staff, other community members, and so on.
Then we put all data in single framework & apply various statistical tools to find out the dynamic on the market.
During the analysis stage, feedback from the stakeholder groups would be compared to determine areas of agreement as well as areas of divergence