

Key Insights
The global sports energy drinks market is poised for significant expansion, projected to reach approximately $12,500 million by 2025, with a robust Compound Annual Growth Rate (CAGR) of roughly 6.5% anticipated throughout the forecast period of 2025-2033. This growth is propelled by a confluence of factors, most notably the escalating health and wellness consciousness among consumers, leading to increased participation in sports and physical activities. The demand for products that enhance performance, boost energy levels, and aid in recovery is on the rise. Furthermore, an increasing adoption of active lifestyles across all age demographics, coupled with effective marketing strategies by leading companies, is a key driver. The convenience and perceived benefits of energy drinks, particularly among younger demographics and fitness enthusiasts, continue to fuel market penetration. Innovation in product formulation, featuring natural ingredients, reduced sugar content, and added functional benefits like electrolytes and vitamins, is also a significant contributor to market expansion and consumer engagement.
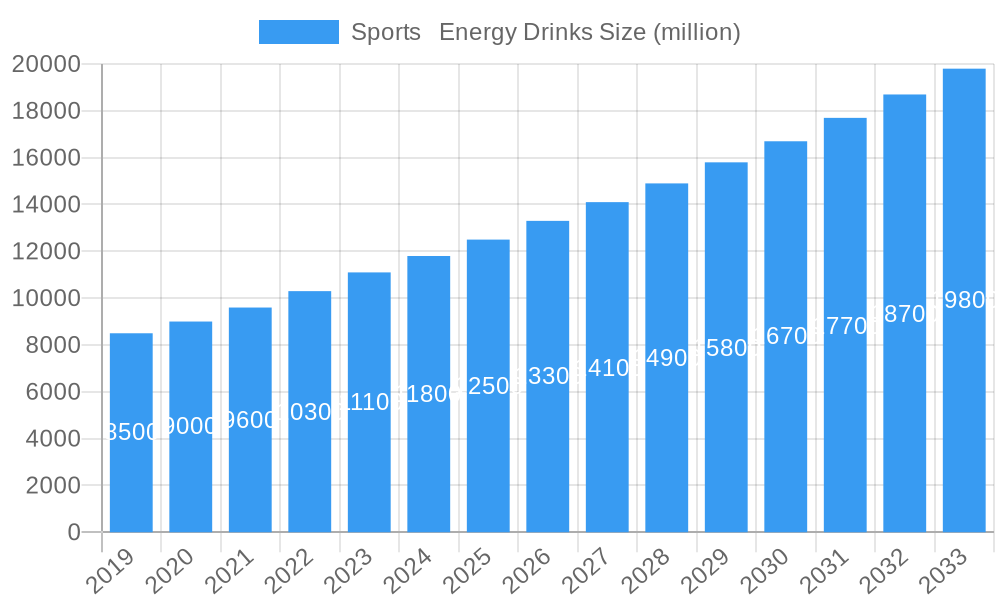
Sports Energy Drinks Market Size (In Billion)
The market's trajectory is further shaped by evolving consumer preferences and emerging trends. A notable trend is the diversification of product offerings beyond traditional energy drinks, with a growing segment dedicated to energy shots, catering to consumers seeking immediate and concentrated boosts. The age segments below 13 and between 13-21 are demonstrating particularly strong growth potential, indicating an early adoption of performance-enhancing beverages. Geographically, North America and Europe currently hold dominant market shares, driven by established sports cultures and high disposable incomes. However, the Asia Pacific region is emerging as a key growth area, owing to rapid urbanization, a burgeoning middle class, and an increasing awareness of fitness and sports. While the market is largely optimistic, potential restraints include increasing scrutiny regarding the health implications of high sugar and stimulant content, leading to a growing demand for healthier alternatives and stricter regulatory frameworks. Nonetheless, strategic product development and targeted marketing are expected to mitigate these challenges and sustain the market's upward momentum.
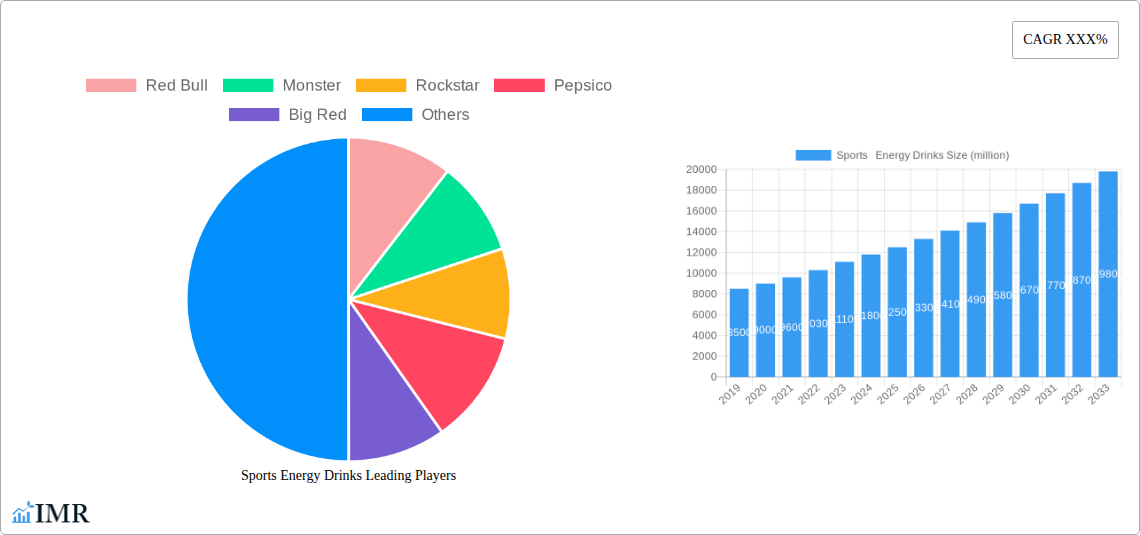
Sports Energy Drinks Company Market Share
Sports Energy Drinks Market Report: Unlocking Growth in the Global Performance Beverage Arena
This comprehensive report offers an in-depth analysis of the global Sports Energy Drinks market, providing critical insights for industry professionals, investors, and stakeholders. With a focus on market dynamics, growth trends, and future outlook, this study leverages high-traffic keywords such as "sports nutrition," "performance beverages," "energy drink market share," and "sports supplement trends" to ensure maximum search engine visibility. We delve into the intricate parent and child market structures, examining the influence of key players, evolving consumer preferences, and emerging opportunities. Values are presented in million units for clear quantitative understanding.
Sports Energy Drinks Market Dynamics & Structure
The global Sports Energy Drinks market is characterized by a moderately concentrated landscape, with major players like Red Bull, Monster, and Rockstar holding significant sway. Technological innovation continues to be a primary driver, focusing on enhanced ingredient formulations for improved efficacy, sustained energy release, and functional benefits beyond basic energy provision. Regulatory frameworks, while generally supportive of the beverage industry, are increasingly scrutinizing ingredient claims and marketing practices, particularly concerning younger demographics. Competitive product substitutes include traditional energy drinks, functional beverages, and even natural alternatives like coffee and tea, posing a constant challenge to market share. End-user demographics are diverse, with a strong focus on athletic and active individuals, but also expanding into broader lifestyle and cognitive enhancement segments. Mergers and acquisitions (M&A) activity has been a notable feature, as larger corporations seek to expand their portfolios and gain access to innovative brands and distribution networks.
- Market Concentration: Dominated by a few key players, but with increasing fragmentation due to new entrants.
- Technological Innovation: Focus on natural ingredients, adaptogens, nootropics, and personalized formulations.
- Regulatory Frameworks: Evolving regulations around ingredient transparency and marketing claims.
- Competitive Substitutes: Traditional energy drinks, functional beverages, and natural alternatives.
- End-User Demographics: Athletes, fitness enthusiasts, students, and professionals seeking enhanced focus and energy.
- M&A Trends: Strategic acquisitions to broaden product offerings and market reach.
Sports Energy Drinks Growth Trends & Insights
The global Sports Energy Drinks market is poised for robust expansion, driven by escalating consumer awareness of health and wellness, coupled with a growing demand for performance-enhancing beverages across diverse applications. The market size is projected to witness a significant surge from approximately $75,000 million in the historical period of 2019-2024 to an estimated $100,000 million in 2025, with an anticipated Compound Annual Growth Rate (CAGR) of xx% during the forecast period of 2025-2033. This growth is fueled by increasing adoption rates among both professional athletes and the general population seeking to improve physical and cognitive performance. Technological disruptions, including advancements in ingredient sourcing and delivery systems, are further augmenting market penetration. Consumer behavior shifts are also playing a pivotal role, with a growing preference for drinks containing natural ingredients, lower sugar content, and functional benefits such as hydration and electrolyte replenishment. The "energy shot" segment, in particular, is experiencing rapid adoption due to its convenience and concentrated formula, contributing significantly to overall market growth. This evolution reflects a broader trend towards functional consumption, where beverages are not merely for refreshment but are actively chosen for their physiological benefits. The expansion of online retail channels and direct-to-consumer models is also making these products more accessible, thereby driving higher adoption rates and market penetration globally. The increasing recognition of sports energy drinks as an integral part of a healthy and active lifestyle is a key determinant of sustained demand.
Dominant Regions, Countries, or Segments in Sports Energy Drinks
The Age (21-35) segment currently dominates the global Sports Energy Drinks market, driven by a confluence of lifestyle factors, disposable income, and a strong emphasis on physical fitness and professional performance. This demographic actively seeks solutions to enhance endurance, focus, and recovery, making them prime consumers of both general energy drinks and specialized sports nutrition products. North America, particularly the United States, stands as the leading country in terms of market share, propelled by a deeply ingrained sports culture, widespread availability of products, and a substantial population of active individuals. Economic policies that support the beverage industry, coupled with robust retail infrastructure, further solidify its dominance. The proliferation of gyms, fitness centers, and sporting events in this region directly correlates with increased demand for sports energy drinks.
- Dominant Age Segment: Age (21-35) – characterized by active lifestyles and performance enhancement needs.
- Leading Region: North America – driven by a strong sports culture and high disposable income.
- Key Country: United States – benefiting from extensive distribution networks and consumer adoption.
- Driving Factors:
- Increasing participation in sports and fitness activities.
- Growing awareness of the benefits of performance-enhancing beverages.
- High disposable income allowing for discretionary spending on health and wellness products.
- Innovative marketing campaigns targeting the active lifestyle.
- Widespread availability through various retail channels.
- Market Share & Growth Potential: The Age (21-35) segment represents approximately xx% of the total market in 2025 and is projected to maintain a significant growth trajectory. North America is expected to account for over xx% of the global market revenue in the same year, with a steady CAGR of xx% through 2033.
The Type: General Energy Drinks segment also holds a substantial market share, catering to a broader audience seeking quick energy boosts for various daily activities, from work and study to social events. However, the "Energy Shots" sub-segment is experiencing particularly rapid growth due to its convenience and concentrated efficacy, appealing to on-the-go consumers. Continued investment in product research and development within these segments, focusing on natural ingredients and functional benefits, will be crucial for sustained market leadership. The influence of local marketing initiatives and the adaptation of product offerings to regional preferences will also play a significant role in shaping the dominance of specific countries and segments in the coming years.
Sports Energy Drinks Product Landscape
The Sports Energy Drinks product landscape is characterized by continuous innovation, with manufacturers focusing on evolving consumer demands for healthier and more functional options. Beyond basic energy provision, products are now formulated with added benefits such as electrolytes for hydration, BCAAs for muscle recovery, and nootropics for cognitive enhancement. Unique selling propositions often revolve around natural ingredients, low sugar content, specific flavor profiles, and unique delivery formats like effervescent tablets or ready-to-drink powders. Technological advancements are enabling the incorporation of advanced ingredients like adaptogens and targeted vitamin complexes.
Key Drivers, Barriers & Challenges in Sports Energy Drinks
The Sports Energy Drinks market is propelled by several key drivers, including the escalating global trend towards active lifestyles and increased participation in sports and fitness. Growing consumer awareness regarding the benefits of performance-enhancing beverages for endurance, focus, and recovery is also a significant catalyst. Furthermore, advancements in ingredient technology, leading to more effective and natural formulations, are fueling market growth. The expanding market for functional beverages and the influence of celebrity endorsements and influencer marketing further contribute to demand.
Conversely, the market faces several barriers and challenges. Stringent regulatory oversight concerning ingredient claims and marketing practices, particularly for products aimed at younger demographics, can hinder expansion. Perceived health concerns related to high sugar and caffeine content in some products can also act as a restraint, leading consumers to seek healthier alternatives. Intense competition from established brands and emerging players, coupled with the threat of substitute products like natural energy boosters, presents ongoing challenges. Supply chain disruptions and volatile raw material prices can also impact production costs and availability.
Emerging Opportunities in Sports Energy Drinks
Emerging opportunities in the Sports Energy Drinks industry lie in the development of personalized nutrition solutions, catering to specific athletic needs and dietary preferences. The growing demand for plant-based and organic energy drinks presents a significant untapped market. Furthermore, innovation in sustainable packaging and a focus on ethically sourced ingredients are becoming increasingly important consumer considerations. The expansion of the market into emerging economies and the development of niche products for specific sports or activities also represent significant growth avenues.
Growth Accelerators in the Sports Energy Drinks Industry
The long-term growth of the Sports Energy Drinks industry is being accelerated by significant technological breakthroughs in ingredient science, leading to the development of more effective and scientifically backed formulations. Strategic partnerships between beverage companies and sports organizations, as well as collaborations with research institutions, are fostering innovation and market penetration. Aggressive market expansion strategies, particularly into underserved regions and through e-commerce platforms, are also critical growth accelerators. The continuous introduction of novel product variants addressing specific consumer needs, such as post-workout recovery or sustained mental focus, further fuels sustained demand and market expansion.
Key Players Shaping the Sports Energy Drinks Market
- Red Bull
- Monster
- Rockstar
- Pepsico
- Big Red
- Arizona
- National Beverage
- Dr Pepper Snapple Group
- Living Essentials Marketing
- Vital Pharmaceuticals
- Bodyarmor SuperDrink
Notable Milestones in Sports Energy Drinks Sector
- 2019: Launch of Red Bull's organic range, signaling a shift towards healthier formulations.
- 2020: Monster Beverage Corporation's strategic acquisition of a significant stake in Canarchy Craft Brewery Collective, expanding its beverage portfolio.
- 2021: Introduction of Bodyarmor SuperDrink's advanced hydration and recovery lines, catering to elite athletes.
- 2022: Increased regulatory scrutiny on energy drink marketing to minors in several key markets.
- 2023: Significant investment in nootropic ingredients by various brands to enhance cognitive performance.
- 2024: Growth in direct-to-consumer sales channels for specialized sports nutrition beverages.
In-Depth Sports Energy Drinks Market Outlook
The future outlook for the Sports Energy Drinks market remains exceptionally strong, driven by sustained global demand for performance enhancement and wellness solutions. Growth accelerators include continued innovation in functional ingredients, personalized nutrition, and the expansion into emerging markets. Strategic partnerships and the adoption of advanced distribution models will be crucial for capitalizing on future market potential. The industry is set to witness further diversification, with a growing emphasis on natural, sustainable, and health-conscious offerings, presenting significant opportunities for brands that can adapt to evolving consumer preferences and regulatory landscapes.
Sports Energy Drinks Segmentation
-
1. Application
- 1.1. Age (Below 13)
- 1.2. Age (13-21)
- 1.3. Age (21-35)
- 1.4. Age (Above 35)
-
2. Type
- 2.1. General Energy Drinks
- 2.2. Energy Shots
Sports Energy Drinks Segmentation By Geography
-
1. North America
- 1.1. United States
- 1.2. Canada
- 1.3. Mexico
-
2. South America
- 2.1. Brazil
- 2.2. Argentina
- 2.3. Rest of South America
-
3. Europe
- 3.1. United Kingdom
- 3.2. Germany
- 3.3. France
- 3.4. Italy
- 3.5. Spain
- 3.6. Russia
- 3.7. Benelux
- 3.8. Nordics
- 3.9. Rest of Europe
-
4. Middle East & Africa
- 4.1. Turkey
- 4.2. Israel
- 4.3. GCC
- 4.4. North Africa
- 4.5. South Africa
- 4.6. Rest of Middle East & Africa
-
5. Asia Pacific
- 5.1. China
- 5.2. India
- 5.3. Japan
- 5.4. South Korea
- 5.5. ASEAN
- 5.6. Oceania
- 5.7. Rest of Asia Pacific
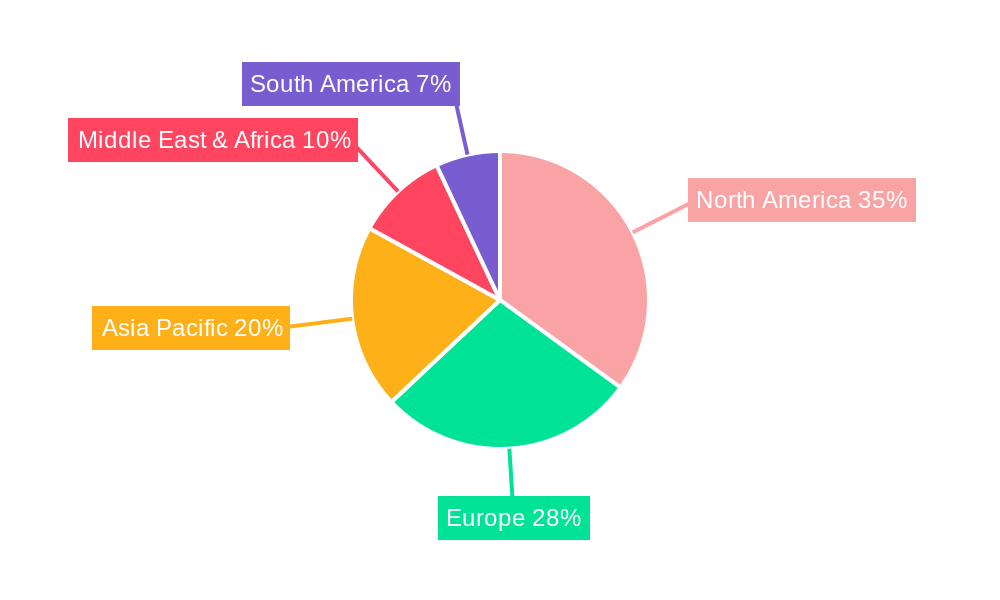
Sports Energy Drinks Regional Market Share
Geographic Coverage of Sports Energy Drinks
Sports Energy Drinks REPORT HIGHLIGHTS
| Aspects | Details |
|---|---|
| Study Period | 2020-2034 |
| Base Year | 2025 |
| Estimated Year | 2026 |
| Forecast Period | 2026-2034 |
| Historical Period | 2020-2025 |
| Growth Rate | CAGR of XXX% from 2020-2034 |
| Segmentation |
|
Table of Contents
- 1. Introduction
- 1.1. Research Scope
- 1.2. Market Segmentation
- 1.3. Research Methodology
- 1.4. Definitions and Assumptions
- 2. Executive Summary
- 2.1. Introduction
- 3. Market Dynamics
- 3.1. Introduction
- 3.2. Market Drivers
- 3.3. Market Restrains
- 3.4. Market Trends
- 4. Market Factor Analysis
- 4.1. Porters Five Forces
- 4.2. Supply/Value Chain
- 4.3. PESTEL analysis
- 4.4. Market Entropy
- 4.5. Patent/Trademark Analysis
- 5. Global Sports Energy Drinks Analysis, Insights and Forecast, 2020-2032
- 5.1. Market Analysis, Insights and Forecast - by Application
- 5.1.1. Age (Below 13)
- 5.1.2. Age (13-21)
- 5.1.3. Age (21-35)
- 5.1.4. Age (Above 35)
- 5.2. Market Analysis, Insights and Forecast - by Type
- 5.2.1. General Energy Drinks
- 5.2.2. Energy Shots
- 5.3. Market Analysis, Insights and Forecast - by Region
- 5.3.1. North America
- 5.3.2. South America
- 5.3.3. Europe
- 5.3.4. Middle East & Africa
- 5.3.5. Asia Pacific
- 5.1. Market Analysis, Insights and Forecast - by Application
- 6. North America Sports Energy Drinks Analysis, Insights and Forecast, 2020-2032
- 6.1. Market Analysis, Insights and Forecast - by Application
- 6.1.1. Age (Below 13)
- 6.1.2. Age (13-21)
- 6.1.3. Age (21-35)
- 6.1.4. Age (Above 35)
- 6.2. Market Analysis, Insights and Forecast - by Type
- 6.2.1. General Energy Drinks
- 6.2.2. Energy Shots
- 6.1. Market Analysis, Insights and Forecast - by Application
- 7. South America Sports Energy Drinks Analysis, Insights and Forecast, 2020-2032
- 7.1. Market Analysis, Insights and Forecast - by Application
- 7.1.1. Age (Below 13)
- 7.1.2. Age (13-21)
- 7.1.3. Age (21-35)
- 7.1.4. Age (Above 35)
- 7.2. Market Analysis, Insights and Forecast - by Type
- 7.2.1. General Energy Drinks
- 7.2.2. Energy Shots
- 7.1. Market Analysis, Insights and Forecast - by Application
- 8. Europe Sports Energy Drinks Analysis, Insights and Forecast, 2020-2032
- 8.1. Market Analysis, Insights and Forecast - by Application
- 8.1.1. Age (Below 13)
- 8.1.2. Age (13-21)
- 8.1.3. Age (21-35)
- 8.1.4. Age (Above 35)
- 8.2. Market Analysis, Insights and Forecast - by Type
- 8.2.1. General Energy Drinks
- 8.2.2. Energy Shots
- 8.1. Market Analysis, Insights and Forecast - by Application
- 9. Middle East & Africa Sports Energy Drinks Analysis, Insights and Forecast, 2020-2032
- 9.1. Market Analysis, Insights and Forecast - by Application
- 9.1.1. Age (Below 13)
- 9.1.2. Age (13-21)
- 9.1.3. Age (21-35)
- 9.1.4. Age (Above 35)
- 9.2. Market Analysis, Insights and Forecast - by Type
- 9.2.1. General Energy Drinks
- 9.2.2. Energy Shots
- 9.1. Market Analysis, Insights and Forecast - by Application
- 10. Asia Pacific Sports Energy Drinks Analysis, Insights and Forecast, 2020-2032
- 10.1. Market Analysis, Insights and Forecast - by Application
- 10.1.1. Age (Below 13)
- 10.1.2. Age (13-21)
- 10.1.3. Age (21-35)
- 10.1.4. Age (Above 35)
- 10.2. Market Analysis, Insights and Forecast - by Type
- 10.2.1. General Energy Drinks
- 10.2.2. Energy Shots
- 10.1. Market Analysis, Insights and Forecast - by Application
- 11. Competitive Analysis
- 11.1. Global Market Share Analysis 2025
- 11.2. Company Profiles
- 11.2.1 Red Bull
- 11.2.1.1. Overview
- 11.2.1.2. Products
- 11.2.1.3. SWOT Analysis
- 11.2.1.4. Recent Developments
- 11.2.1.5. Financials (Based on Availability)
- 11.2.2 Monster
- 11.2.2.1. Overview
- 11.2.2.2. Products
- 11.2.2.3. SWOT Analysis
- 11.2.2.4. Recent Developments
- 11.2.2.5. Financials (Based on Availability)
- 11.2.3 Rockstar
- 11.2.3.1. Overview
- 11.2.3.2. Products
- 11.2.3.3. SWOT Analysis
- 11.2.3.4. Recent Developments
- 11.2.3.5. Financials (Based on Availability)
- 11.2.4 Pepsico
- 11.2.4.1. Overview
- 11.2.4.2. Products
- 11.2.4.3. SWOT Analysis
- 11.2.4.4. Recent Developments
- 11.2.4.5. Financials (Based on Availability)
- 11.2.5 Big Red
- 11.2.5.1. Overview
- 11.2.5.2. Products
- 11.2.5.3. SWOT Analysis
- 11.2.5.4. Recent Developments
- 11.2.5.5. Financials (Based on Availability)
- 11.2.6 Arizona
- 11.2.6.1. Overview
- 11.2.6.2. Products
- 11.2.6.3. SWOT Analysis
- 11.2.6.4. Recent Developments
- 11.2.6.5. Financials (Based on Availability)
- 11.2.7 National Beverage
- 11.2.7.1. Overview
- 11.2.7.2. Products
- 11.2.7.3. SWOT Analysis
- 11.2.7.4. Recent Developments
- 11.2.7.5. Financials (Based on Availability)
- 11.2.8 Dr Pepper Snapple Group
- 11.2.8.1. Overview
- 11.2.8.2. Products
- 11.2.8.3. SWOT Analysis
- 11.2.8.4. Recent Developments
- 11.2.8.5. Financials (Based on Availability)
- 11.2.9 Living Essentials Marketing
- 11.2.9.1. Overview
- 11.2.9.2. Products
- 11.2.9.3. SWOT Analysis
- 11.2.9.4. Recent Developments
- 11.2.9.5. Financials (Based on Availability)
- 11.2.10 Vital Pharmaceuticals
- 11.2.10.1. Overview
- 11.2.10.2. Products
- 11.2.10.3. SWOT Analysis
- 11.2.10.4. Recent Developments
- 11.2.10.5. Financials (Based on Availability)
- 11.2.11 Bodyarmor SuperDrink
- 11.2.11.1. Overview
- 11.2.11.2. Products
- 11.2.11.3. SWOT Analysis
- 11.2.11.4. Recent Developments
- 11.2.11.5. Financials (Based on Availability)
- 11.2.1 Red Bull
List of Figures
- Figure 1: Global Sports Energy Drinks Revenue Breakdown (million, %) by Region 2025 & 2033
- Figure 2: North America Sports Energy Drinks Revenue (million), by Application 2025 & 2033
- Figure 3: North America Sports Energy Drinks Revenue Share (%), by Application 2025 & 2033
- Figure 4: North America Sports Energy Drinks Revenue (million), by Type 2025 & 2033
- Figure 5: North America Sports Energy Drinks Revenue Share (%), by Type 2025 & 2033
- Figure 6: North America Sports Energy Drinks Revenue (million), by Country 2025 & 2033
- Figure 7: North America Sports Energy Drinks Revenue Share (%), by Country 2025 & 2033
- Figure 8: South America Sports Energy Drinks Revenue (million), by Application 2025 & 2033
- Figure 9: South America Sports Energy Drinks Revenue Share (%), by Application 2025 & 2033
- Figure 10: South America Sports Energy Drinks Revenue (million), by Type 2025 & 2033
- Figure 11: South America Sports Energy Drinks Revenue Share (%), by Type 2025 & 2033
- Figure 12: South America Sports Energy Drinks Revenue (million), by Country 2025 & 2033
- Figure 13: South America Sports Energy Drinks Revenue Share (%), by Country 2025 & 2033
- Figure 14: Europe Sports Energy Drinks Revenue (million), by Application 2025 & 2033
- Figure 15: Europe Sports Energy Drinks Revenue Share (%), by Application 2025 & 2033
- Figure 16: Europe Sports Energy Drinks Revenue (million), by Type 2025 & 2033
- Figure 17: Europe Sports Energy Drinks Revenue Share (%), by Type 2025 & 2033
- Figure 18: Europe Sports Energy Drinks Revenue (million), by Country 2025 & 2033
- Figure 19: Europe Sports Energy Drinks Revenue Share (%), by Country 2025 & 2033
- Figure 20: Middle East & Africa Sports Energy Drinks Revenue (million), by Application 2025 & 2033
- Figure 21: Middle East & Africa Sports Energy Drinks Revenue Share (%), by Application 2025 & 2033
- Figure 22: Middle East & Africa Sports Energy Drinks Revenue (million), by Type 2025 & 2033
- Figure 23: Middle East & Africa Sports Energy Drinks Revenue Share (%), by Type 2025 & 2033
- Figure 24: Middle East & Africa Sports Energy Drinks Revenue (million), by Country 2025 & 2033
- Figure 25: Middle East & Africa Sports Energy Drinks Revenue Share (%), by Country 2025 & 2033
- Figure 26: Asia Pacific Sports Energy Drinks Revenue (million), by Application 2025 & 2033
- Figure 27: Asia Pacific Sports Energy Drinks Revenue Share (%), by Application 2025 & 2033
- Figure 28: Asia Pacific Sports Energy Drinks Revenue (million), by Type 2025 & 2033
- Figure 29: Asia Pacific Sports Energy Drinks Revenue Share (%), by Type 2025 & 2033
- Figure 30: Asia Pacific Sports Energy Drinks Revenue (million), by Country 2025 & 2033
- Figure 31: Asia Pacific Sports Energy Drinks Revenue Share (%), by Country 2025 & 2033
List of Tables
- Table 1: Global Sports Energy Drinks Revenue million Forecast, by Application 2020 & 2033
- Table 2: Global Sports Energy Drinks Revenue million Forecast, by Type 2020 & 2033
- Table 3: Global Sports Energy Drinks Revenue million Forecast, by Region 2020 & 2033
- Table 4: Global Sports Energy Drinks Revenue million Forecast, by Application 2020 & 2033
- Table 5: Global Sports Energy Drinks Revenue million Forecast, by Type 2020 & 2033
- Table 6: Global Sports Energy Drinks Revenue million Forecast, by Country 2020 & 2033
- Table 7: United States Sports Energy Drinks Revenue (million) Forecast, by Application 2020 & 2033
- Table 8: Canada Sports Energy Drinks Revenue (million) Forecast, by Application 2020 & 2033
- Table 9: Mexico Sports Energy Drinks Revenue (million) Forecast, by Application 2020 & 2033
- Table 10: Global Sports Energy Drinks Revenue million Forecast, by Application 2020 & 2033
- Table 11: Global Sports Energy Drinks Revenue million Forecast, by Type 2020 & 2033
- Table 12: Global Sports Energy Drinks Revenue million Forecast, by Country 2020 & 2033
- Table 13: Brazil Sports Energy Drinks Revenue (million) Forecast, by Application 2020 & 2033
- Table 14: Argentina Sports Energy Drinks Revenue (million) Forecast, by Application 2020 & 2033
- Table 15: Rest of South America Sports Energy Drinks Revenue (million) Forecast, by Application 2020 & 2033
- Table 16: Global Sports Energy Drinks Revenue million Forecast, by Application 2020 & 2033
- Table 17: Global Sports Energy Drinks Revenue million Forecast, by Type 2020 & 2033
- Table 18: Global Sports Energy Drinks Revenue million Forecast, by Country 2020 & 2033
- Table 19: United Kingdom Sports Energy Drinks Revenue (million) Forecast, by Application 2020 & 2033
- Table 20: Germany Sports Energy Drinks Revenue (million) Forecast, by Application 2020 & 2033
- Table 21: France Sports Energy Drinks Revenue (million) Forecast, by Application 2020 & 2033
- Table 22: Italy Sports Energy Drinks Revenue (million) Forecast, by Application 2020 & 2033
- Table 23: Spain Sports Energy Drinks Revenue (million) Forecast, by Application 2020 & 2033
- Table 24: Russia Sports Energy Drinks Revenue (million) Forecast, by Application 2020 & 2033
- Table 25: Benelux Sports Energy Drinks Revenue (million) Forecast, by Application 2020 & 2033
- Table 26: Nordics Sports Energy Drinks Revenue (million) Forecast, by Application 2020 & 2033
- Table 27: Rest of Europe Sports Energy Drinks Revenue (million) Forecast, by Application 2020 & 2033
- Table 28: Global Sports Energy Drinks Revenue million Forecast, by Application 2020 & 2033
- Table 29: Global Sports Energy Drinks Revenue million Forecast, by Type 2020 & 2033
- Table 30: Global Sports Energy Drinks Revenue million Forecast, by Country 2020 & 2033
- Table 31: Turkey Sports Energy Drinks Revenue (million) Forecast, by Application 2020 & 2033
- Table 32: Israel Sports Energy Drinks Revenue (million) Forecast, by Application 2020 & 2033
- Table 33: GCC Sports Energy Drinks Revenue (million) Forecast, by Application 2020 & 2033
- Table 34: North Africa Sports Energy Drinks Revenue (million) Forecast, by Application 2020 & 2033
- Table 35: South Africa Sports Energy Drinks Revenue (million) Forecast, by Application 2020 & 2033
- Table 36: Rest of Middle East & Africa Sports Energy Drinks Revenue (million) Forecast, by Application 2020 & 2033
- Table 37: Global Sports Energy Drinks Revenue million Forecast, by Application 2020 & 2033
- Table 38: Global Sports Energy Drinks Revenue million Forecast, by Type 2020 & 2033
- Table 39: Global Sports Energy Drinks Revenue million Forecast, by Country 2020 & 2033
- Table 40: China Sports Energy Drinks Revenue (million) Forecast, by Application 2020 & 2033
- Table 41: India Sports Energy Drinks Revenue (million) Forecast, by Application 2020 & 2033
- Table 42: Japan Sports Energy Drinks Revenue (million) Forecast, by Application 2020 & 2033
- Table 43: South Korea Sports Energy Drinks Revenue (million) Forecast, by Application 2020 & 2033
- Table 44: ASEAN Sports Energy Drinks Revenue (million) Forecast, by Application 2020 & 2033
- Table 45: Oceania Sports Energy Drinks Revenue (million) Forecast, by Application 2020 & 2033
- Table 46: Rest of Asia Pacific Sports Energy Drinks Revenue (million) Forecast, by Application 2020 & 2033
Frequently Asked Questions
1. What is the projected Compound Annual Growth Rate (CAGR) of the Sports Energy Drinks?
The projected CAGR is approximately XXX%.
2. Which companies are prominent players in the Sports Energy Drinks?
Key companies in the market include Red Bull, Monster, Rockstar, Pepsico, Big Red, Arizona, National Beverage, Dr Pepper Snapple Group, Living Essentials Marketing, Vital Pharmaceuticals, Bodyarmor SuperDrink.
3. What are the main segments of the Sports Energy Drinks?
The market segments include Application, Type.
4. Can you provide details about the market size?
The market size is estimated to be USD XXX million as of 2022.
5. What are some drivers contributing to market growth?
N/A
6. What are the notable trends driving market growth?
N/A
7. Are there any restraints impacting market growth?
N/A
8. Can you provide examples of recent developments in the market?
N/A
9. What pricing options are available for accessing the report?
Pricing options include single-user, multi-user, and enterprise licenses priced at USD 2900.00, USD 4350.00, and USD 5800.00 respectively.
10. Is the market size provided in terms of value or volume?
The market size is provided in terms of value, measured in million.
11. Are there any specific market keywords associated with the report?
Yes, the market keyword associated with the report is "Sports Energy Drinks," which aids in identifying and referencing the specific market segment covered.
12. How do I determine which pricing option suits my needs best?
The pricing options vary based on user requirements and access needs. Individual users may opt for single-user licenses, while businesses requiring broader access may choose multi-user or enterprise licenses for cost-effective access to the report.
13. Are there any additional resources or data provided in the Sports Energy Drinks report?
While the report offers comprehensive insights, it's advisable to review the specific contents or supplementary materials provided to ascertain if additional resources or data are available.
14. How can I stay updated on further developments or reports in the Sports Energy Drinks?
To stay informed about further developments, trends, and reports in the Sports Energy Drinks, consider subscribing to industry newsletters, following relevant companies and organizations, or regularly checking reputable industry news sources and publications.
Methodology
Step 1 - Identification of Relevant Samples Size from Population Database


Step 2 - Approaches for Defining Global Market Size (Value, Volume* & Price*)

Note*: In applicable scenarios
Step 3 - Data Sources
Primary Research
- Web Analytics
- Survey Reports
- Research Institute
- Latest Research Reports
- Opinion Leaders
Secondary Research
- Annual Reports
- White Paper
- Latest Press Release
- Industry Association
- Paid Database
- Investor Presentations

Step 4 - Data Triangulation
Involves using different sources of information in order to increase the validity of a study
These sources are likely to be stakeholders in a program - participants, other researchers, program staff, other community members, and so on.
Then we put all data in single framework & apply various statistical tools to find out the dynamic on the market.
During the analysis stage, feedback from the stakeholder groups would be compared to determine areas of agreement as well as areas of divergence