

Key Insights
The global strawberry jam market is poised for significant expansion, driven by increasing consumer preference for convenient breakfast solutions and the growing appeal of artisanal and organic product varieties. The market is projected to reach $9.39 billion by 2025, with a projected compound annual growth rate (CAGR) of 5.2% from the 2025 base year through 2033. This growth trajectory is underpinned by several key drivers: expanding middle classes in emerging economies, rising disposable incomes enabling greater expenditure on premium food products, and heightened consumer awareness regarding the health advantages of fruit-based spreads. Emerging market trends include the introduction of novel flavors and healthier formulations, such as low-sugar and organic options, to meet evolving consumer demands. Furthermore, the proliferation of e-commerce and direct-to-consumer sales channels is profoundly influencing distribution strategies and market accessibility, thereby accelerating market growth.
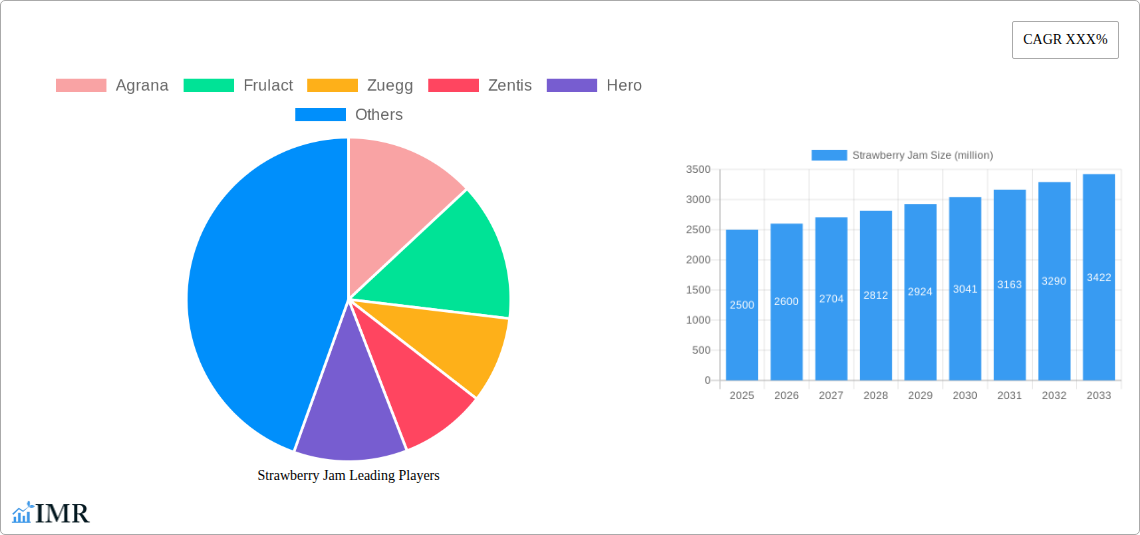
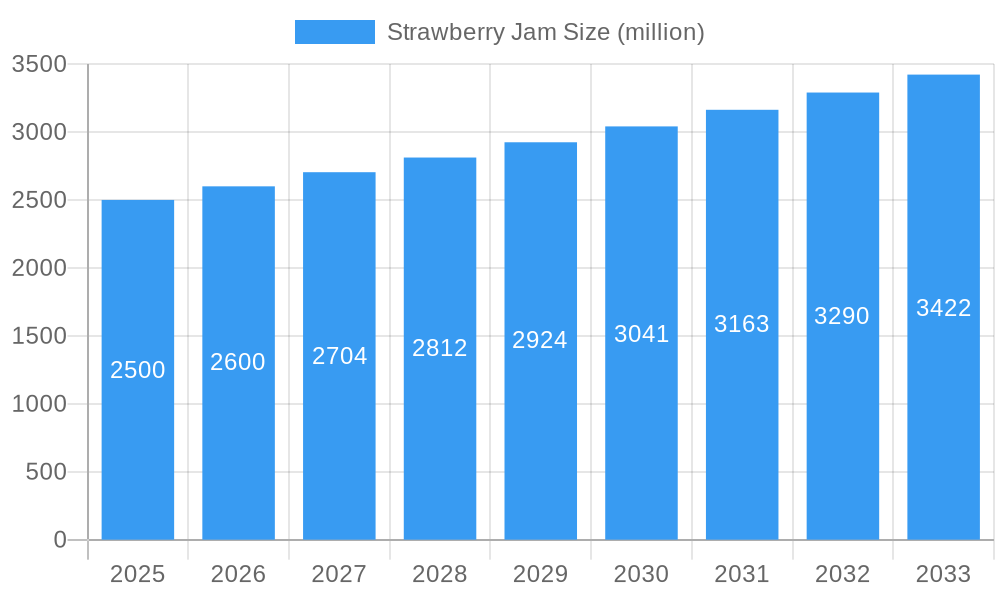
Strawberry Jam Market Size (In Billion)
Key market participants, including Agrana, Frulact, Zuegg, Zentis, Hero, Valio, BINA, Fourayes, Fresh Food Industries, JM Smucker, Ingredion Incorporated, Puratos, Döhler, SVZ International, Tree Top, and Andros France, are actively pursuing product diversification and strategic collaborations to solidify their competitive positions. Nevertheless, the market confronts challenges such as volatility in raw material costs (strawberries) and escalating competition from alternative fruit preserves and spreads. Market segmentation by distribution channels (retail, foodservice, online) and product type (conventional, organic, low-sugar) reveals distinct avenues for growth. Regional variations in consumer tastes and purchasing power also contribute to diverse market performances across North America, Europe, Asia-Pacific, and other global regions. Future market expansion is anticipated to be shaped by ongoing innovation, sustainable sourcing initiatives, and targeted marketing campaigns emphasizing the health and convenience benefits of strawberry jam.
Strawberry Jam Company Market Share
Strawberry Jam Market Report: 2019-2033
This comprehensive report provides an in-depth analysis of the global strawberry jam market, encompassing historical data (2019-2024), current estimates (2025), and future forecasts (2025-2033). Targeting both the parent market (Processed Food) and child market (Fruit Preserves), this report is essential for industry professionals seeking strategic insights and competitive advantages. The market is valued at xx million units in 2025 and is projected to reach xx million units by 2033.
Strawberry Jam Market Dynamics & Structure
The global strawberry jam market is characterized by a moderately consolidated structure, with key players such as Agrana, Frulact, and Zuegg holding significant market share. Market concentration is further analyzed within the report, revealing a Herfindahl-Hirschman Index (HHI) of xx, indicating a [Describe level of concentration: e.g., moderately competitive or oligopolistic] market. Technological innovations, particularly in preservation techniques and packaging, are driving market growth. Stringent regulatory frameworks concerning food safety and labeling influence production practices and consumer confidence. Competitor product substitutes, like other fruit jams or spreads, create competitive pressure. The primary end-user demographic skews towards households with children and individuals prioritizing convenience. Market analysis reveals an average of xx M&A deals per year during the historical period, driven primarily by strategic expansion efforts.
- Market Share (2025): Agrana (xx%), Frulact (xx%), Zuegg (xx%), Others (xx%)
- M&A Deal Volume (2019-2024): xx deals
- Key Innovation Barriers: High R&D costs, stringent regulatory approvals.
Strawberry Jam Growth Trends & Insights
The global strawberry jam market experienced a CAGR of xx% during the historical period (2019-2024), driven by rising disposable incomes, evolving consumer preferences toward convenient breakfast options, and increased demand for natural and organic products. Market penetration is currently estimated at xx%, with significant growth potential in emerging economies. Technological advancements, such as the development of extended shelf-life technologies and innovative packaging solutions, are further boosting market expansion. Changing consumer behavior, including a growing awareness of health and wellness, has led to a rise in demand for low-sugar and sugar-free variants. The market is predicted to grow at a CAGR of xx% during the forecast period (2025-2033), driven by several factors including [mention specific factors contributing to CAGR]. The report includes detailed market sizing estimations and segmentation for a better perspective on growth trends.
Dominant Regions, Countries, or Segments in Strawberry Jam
North America currently dominates the global strawberry jam market, driven by high consumption rates and well-established distribution networks. Europe follows as a significant market, propelled by a strong preference for traditional jams and established production capabilities. Asia-Pacific is expected to witness the fastest growth rate during the forecast period, fueled by rising disposable incomes and changing dietary habits.
- Key Drivers in North America: High per capita consumption, strong retail infrastructure.
- Key Drivers in Europe: Established production base, strong consumer preference.
- Key Drivers in Asia-Pacific: Rising disposable incomes, changing dietary habits, increasing urbanization.
- Market Share (2025): North America (xx%), Europe (xx%), Asia-Pacific (xx%), Rest of World (xx%)
Strawberry Jam Product Landscape
The strawberry jam market offers a diverse range of products, from traditional styles to innovative options such as low-sugar, organic, and specialty varieties incorporating added ingredients. Advancements in preservation techniques ensure extended shelf life and maintain product quality. Unique selling propositions increasingly focus on natural ingredients, reduced sugar content, and convenient packaging formats. Technological advancements in processing and packaging enhance product quality, shelf life and appeal.
Key Drivers, Barriers & Challenges in Strawberry Jam
Key Drivers: Increasing consumer preference for convenient breakfast options, rising disposable incomes in emerging economies, growing demand for natural and organic products. Government initiatives promoting local food production also contribute to growth.
Challenges: Fluctuations in raw material prices (strawberries, sugar), stringent food safety regulations, and intense competition from other spreads and preserves create significant hurdles. Supply chain disruptions, particularly concerning seasonal fruit availability, can impact production and pricing.
Emerging Opportunities in Strawberry Jam
Untapped markets in developing countries, particularly in Africa and Latin America, present significant growth opportunities. Innovative product development, such as functional jams with added health benefits (e.g., probiotics, antioxidants), appeals to health-conscious consumers. Evolving consumer preferences towards personalized nutrition and reduced sugar options are further opportunities to explore.
Growth Accelerators in the Strawberry Jam Industry
Technological advancements, particularly in efficient and sustainable production methods, offer significant growth potential. Strategic partnerships between jam manufacturers and ingredient suppliers can enhance supply chain efficiency and reduce costs. Market expansion strategies targeting emerging economies through innovative marketing and distribution channels will greatly impact the market.
Notable Milestones in Strawberry Jam Sector
- 2020: Agrana launches a new line of organic strawberry jams.
- 2021: Frulact invests in a new high-capacity production facility.
- 2022: Zuegg acquires a smaller regional jam producer.
- 2023: Several key players invest in sustainable packaging solutions.
- 2024: Increased focus on low-sugar and sugar-free options among major manufacturers.
In-Depth Strawberry Jam Market Outlook
The strawberry jam market is poised for continued growth, driven by several factors, including increased consumer demand for convenient and healthy food options, technological advancements in production and packaging, and strategic expansion into new markets. Opportunities exist for manufacturers to capitalize on emerging trends such as the demand for organic and functional jams. Strategic partnerships and investments in innovation will play a crucial role in shaping the future of the industry.
Strawberry Jam Segmentation
-
1. Application
- 1.1. Dairy Industry
- 1.2. Baked Product Industry
- 1.3. Ice-Cream Industry
- 1.4. Others
-
2. Type
- 2.1. High Sugar Jam
- 2.2. Low Sugar Jam
Strawberry Jam Segmentation By Geography
-
1. North America
- 1.1. United States
- 1.2. Canada
- 1.3. Mexico
-
2. South America
- 2.1. Brazil
- 2.2. Argentina
- 2.3. Rest of South America
-
3. Europe
- 3.1. United Kingdom
- 3.2. Germany
- 3.3. France
- 3.4. Italy
- 3.5. Spain
- 3.6. Russia
- 3.7. Benelux
- 3.8. Nordics
- 3.9. Rest of Europe
-
4. Middle East & Africa
- 4.1. Turkey
- 4.2. Israel
- 4.3. GCC
- 4.4. North Africa
- 4.5. South Africa
- 4.6. Rest of Middle East & Africa
-
5. Asia Pacific
- 5.1. China
- 5.2. India
- 5.3. Japan
- 5.4. South Korea
- 5.5. ASEAN
- 5.6. Oceania
- 5.7. Rest of Asia Pacific

Strawberry Jam Regional Market Share
Geographic Coverage of Strawberry Jam
Strawberry Jam REPORT HIGHLIGHTS
| Aspects | Details |
|---|---|
| Study Period | 2020-2034 |
| Base Year | 2025 |
| Estimated Year | 2026 |
| Forecast Period | 2026-2034 |
| Historical Period | 2020-2025 |
| Growth Rate | CAGR of 5.2% from 2020-2034 |
| Segmentation |
|
Table of Contents
- 1. Introduction
- 1.1. Research Scope
- 1.2. Market Segmentation
- 1.3. Research Objective
- 1.4. Definitions and Assumptions
- 2. Executive Summary
- 2.1. Market Snapshot
- 3. Market Dynamics
- 3.1. Market Drivers
- 3.2. Market Restrains
- 3.3. Market Trends
- 3.4. Market Opportunities
- 4. Market Factor Analysis
- 4.1. Porters Five Forces
- 4.1.1. Bargaining Power of Suppliers
- 4.1.2. Bargaining Power of Buyers
- 4.1.3. Threat of New Entrants
- 4.1.4. Threat of Substitutes
- 4.1.5. Competitive Rivalry
- 4.2. PESTEL analysis
- 4.3. BCG Analysis
- 4.3.1. Stars (High Growth, High Market Share)
- 4.3.2. Cash Cows (Low Growth, High Market Share)
- 4.3.3. Question Mark (High Growth, Low Market Share)
- 4.3.4. Dogs (Low Growth, Low Market Share)
- 4.4. Ansoff Matrix Analysis
- 4.5. Supply Chain Analysis
- 4.6. Regulatory Landscape
- 4.7. Current Market Potential and Opportunity Assessment (TAM–SAM–SOM Framework)
- 4.8. IMR Analyst Note
- 4.1. Porters Five Forces
- 5. Market Analysis, Insights and Forecast 2021-2033
- 5.1. Market Analysis, Insights and Forecast - by Application
- 5.1.1. Dairy Industry
- 5.1.2. Baked Product Industry
- 5.1.3. Ice-Cream Industry
- 5.1.4. Others
- 5.2. Market Analysis, Insights and Forecast - by Type
- 5.2.1. High Sugar Jam
- 5.2.2. Low Sugar Jam
- 5.3. Market Analysis, Insights and Forecast - by Region
- 5.3.1. North America
- 5.3.2. South America
- 5.3.3. Europe
- 5.3.4. Middle East & Africa
- 5.3.5. Asia Pacific
- 5.1. Market Analysis, Insights and Forecast - by Application
- 6. Global Strawberry Jam Analysis, Insights and Forecast, 2021-2033
- 6.1. Market Analysis, Insights and Forecast - by Application
- 6.1.1. Dairy Industry
- 6.1.2. Baked Product Industry
- 6.1.3. Ice-Cream Industry
- 6.1.4. Others
- 6.2. Market Analysis, Insights and Forecast - by Type
- 6.2.1. High Sugar Jam
- 6.2.2. Low Sugar Jam
- 6.1. Market Analysis, Insights and Forecast - by Application
- 7. North America Strawberry Jam Analysis, Insights and Forecast, 2020-2032
- 7.1. Market Analysis, Insights and Forecast - by Application
- 7.1.1. Dairy Industry
- 7.1.2. Baked Product Industry
- 7.1.3. Ice-Cream Industry
- 7.1.4. Others
- 7.2. Market Analysis, Insights and Forecast - by Type
- 7.2.1. High Sugar Jam
- 7.2.2. Low Sugar Jam
- 7.1. Market Analysis, Insights and Forecast - by Application
- 8. South America Strawberry Jam Analysis, Insights and Forecast, 2020-2032
- 8.1. Market Analysis, Insights and Forecast - by Application
- 8.1.1. Dairy Industry
- 8.1.2. Baked Product Industry
- 8.1.3. Ice-Cream Industry
- 8.1.4. Others
- 8.2. Market Analysis, Insights and Forecast - by Type
- 8.2.1. High Sugar Jam
- 8.2.2. Low Sugar Jam
- 8.1. Market Analysis, Insights and Forecast - by Application
- 9. Europe Strawberry Jam Analysis, Insights and Forecast, 2020-2032
- 9.1. Market Analysis, Insights and Forecast - by Application
- 9.1.1. Dairy Industry
- 9.1.2. Baked Product Industry
- 9.1.3. Ice-Cream Industry
- 9.1.4. Others
- 9.2. Market Analysis, Insights and Forecast - by Type
- 9.2.1. High Sugar Jam
- 9.2.2. Low Sugar Jam
- 9.1. Market Analysis, Insights and Forecast - by Application
- 10. Middle East & Africa Strawberry Jam Analysis, Insights and Forecast, 2020-2032
- 10.1. Market Analysis, Insights and Forecast - by Application
- 10.1.1. Dairy Industry
- 10.1.2. Baked Product Industry
- 10.1.3. Ice-Cream Industry
- 10.1.4. Others
- 10.2. Market Analysis, Insights and Forecast - by Type
- 10.2.1. High Sugar Jam
- 10.2.2. Low Sugar Jam
- 10.1. Market Analysis, Insights and Forecast - by Application
- 11. Asia Pacific Strawberry Jam Analysis, Insights and Forecast, 2020-2032
- 11.1. Market Analysis, Insights and Forecast - by Application
- 11.1.1. Dairy Industry
- 11.1.2. Baked Product Industry
- 11.1.3. Ice-Cream Industry
- 11.1.4. Others
- 11.2. Market Analysis, Insights and Forecast - by Type
- 11.2.1. High Sugar Jam
- 11.2.2. Low Sugar Jam
- 11.1. Market Analysis, Insights and Forecast - by Application
- 12. Competitive Analysis
- 12.1. Company Profiles
- 12.1.1 Agrana
- 12.1.1.1. Company Overview
- 12.1.1.2. Products
- 12.1.1.3. Company Financials
- 12.1.1.4. SWOT Analysis
- 12.1.2 Frulact
- 12.1.2.1. Company Overview
- 12.1.2.2. Products
- 12.1.2.3. Company Financials
- 12.1.2.4. SWOT Analysis
- 12.1.3 Zuegg
- 12.1.3.1. Company Overview
- 12.1.3.2. Products
- 12.1.3.3. Company Financials
- 12.1.3.4. SWOT Analysis
- 12.1.4 Zentis
- 12.1.4.1. Company Overview
- 12.1.4.2. Products
- 12.1.4.3. Company Financials
- 12.1.4.4. SWOT Analysis
- 12.1.5 Hero
- 12.1.5.1. Company Overview
- 12.1.5.2. Products
- 12.1.5.3. Company Financials
- 12.1.5.4. SWOT Analysis
- 12.1.6 Valio
- 12.1.6.1. Company Overview
- 12.1.6.2. Products
- 12.1.6.3. Company Financials
- 12.1.6.4. SWOT Analysis
- 12.1.7 BINA
- 12.1.7.1. Company Overview
- 12.1.7.2. Products
- 12.1.7.3. Company Financials
- 12.1.7.4. SWOT Analysis
- 12.1.8 Fourayes
- 12.1.8.1. Company Overview
- 12.1.8.2. Products
- 12.1.8.3. Company Financials
- 12.1.8.4. SWOT Analysis
- 12.1.9 Fresh Food Industries
- 12.1.9.1. Company Overview
- 12.1.9.2. Products
- 12.1.9.3. Company Financials
- 12.1.9.4. SWOT Analysis
- 12.1.10 JM Smucker
- 12.1.10.1. Company Overview
- 12.1.10.2. Products
- 12.1.10.3. Company Financials
- 12.1.10.4. SWOT Analysis
- 12.1.11 Ingredion Incorporated
- 12.1.11.1. Company Overview
- 12.1.11.2. Products
- 12.1.11.3. Company Financials
- 12.1.11.4. SWOT Analysis
- 12.1.12 Puratos
- 12.1.12.1. Company Overview
- 12.1.12.2. Products
- 12.1.12.3. Company Financials
- 12.1.12.4. SWOT Analysis
- 12.1.13 Döhler
- 12.1.13.1. Company Overview
- 12.1.13.2. Products
- 12.1.13.3. Company Financials
- 12.1.13.4. SWOT Analysis
- 12.1.14 SVZ International
- 12.1.14.1. Company Overview
- 12.1.14.2. Products
- 12.1.14.3. Company Financials
- 12.1.14.4. SWOT Analysis
- 12.1.15 Tree Top
- 12.1.15.1. Company Overview
- 12.1.15.2. Products
- 12.1.15.3. Company Financials
- 12.1.15.4. SWOT Analysis
- 12.1.16 Andros France
- 12.1.16.1. Company Overview
- 12.1.16.2. Products
- 12.1.16.3. Company Financials
- 12.1.16.4. SWOT Analysis
- 12.1.1 Agrana
- 12.2. Market Entropy
- 12.2.1 Company's Key Areas Served
- 12.2.2 Recent Developments
- 12.3. Company Market Share Analysis 2025
- 12.3.1 Top 5 Companies Market Share Analysis
- 12.3.2 Top 3 Companies Market Share Analysis
- 12.4. List of Potential Customers
- 13. Research Methodology
List of Figures
- Figure 1: Global Strawberry Jam Revenue Breakdown (billion, %) by Region 2025 & 2033
- Figure 2: Global Strawberry Jam Volume Breakdown (K, %) by Region 2025 & 2033
- Figure 3: North America Strawberry Jam Revenue (billion), by Application 2025 & 2033
- Figure 4: North America Strawberry Jam Volume (K), by Application 2025 & 2033
- Figure 5: North America Strawberry Jam Revenue Share (%), by Application 2025 & 2033
- Figure 6: North America Strawberry Jam Volume Share (%), by Application 2025 & 2033
- Figure 7: North America Strawberry Jam Revenue (billion), by Type 2025 & 2033
- Figure 8: North America Strawberry Jam Volume (K), by Type 2025 & 2033
- Figure 9: North America Strawberry Jam Revenue Share (%), by Type 2025 & 2033
- Figure 10: North America Strawberry Jam Volume Share (%), by Type 2025 & 2033
- Figure 11: North America Strawberry Jam Revenue (billion), by Country 2025 & 2033
- Figure 12: North America Strawberry Jam Volume (K), by Country 2025 & 2033
- Figure 13: North America Strawberry Jam Revenue Share (%), by Country 2025 & 2033
- Figure 14: North America Strawberry Jam Volume Share (%), by Country 2025 & 2033
- Figure 15: South America Strawberry Jam Revenue (billion), by Application 2025 & 2033
- Figure 16: South America Strawberry Jam Volume (K), by Application 2025 & 2033
- Figure 17: South America Strawberry Jam Revenue Share (%), by Application 2025 & 2033
- Figure 18: South America Strawberry Jam Volume Share (%), by Application 2025 & 2033
- Figure 19: South America Strawberry Jam Revenue (billion), by Type 2025 & 2033
- Figure 20: South America Strawberry Jam Volume (K), by Type 2025 & 2033
- Figure 21: South America Strawberry Jam Revenue Share (%), by Type 2025 & 2033
- Figure 22: South America Strawberry Jam Volume Share (%), by Type 2025 & 2033
- Figure 23: South America Strawberry Jam Revenue (billion), by Country 2025 & 2033
- Figure 24: South America Strawberry Jam Volume (K), by Country 2025 & 2033
- Figure 25: South America Strawberry Jam Revenue Share (%), by Country 2025 & 2033
- Figure 26: South America Strawberry Jam Volume Share (%), by Country 2025 & 2033
- Figure 27: Europe Strawberry Jam Revenue (billion), by Application 2025 & 2033
- Figure 28: Europe Strawberry Jam Volume (K), by Application 2025 & 2033
- Figure 29: Europe Strawberry Jam Revenue Share (%), by Application 2025 & 2033
- Figure 30: Europe Strawberry Jam Volume Share (%), by Application 2025 & 2033
- Figure 31: Europe Strawberry Jam Revenue (billion), by Type 2025 & 2033
- Figure 32: Europe Strawberry Jam Volume (K), by Type 2025 & 2033
- Figure 33: Europe Strawberry Jam Revenue Share (%), by Type 2025 & 2033
- Figure 34: Europe Strawberry Jam Volume Share (%), by Type 2025 & 2033
- Figure 35: Europe Strawberry Jam Revenue (billion), by Country 2025 & 2033
- Figure 36: Europe Strawberry Jam Volume (K), by Country 2025 & 2033
- Figure 37: Europe Strawberry Jam Revenue Share (%), by Country 2025 & 2033
- Figure 38: Europe Strawberry Jam Volume Share (%), by Country 2025 & 2033
- Figure 39: Middle East & Africa Strawberry Jam Revenue (billion), by Application 2025 & 2033
- Figure 40: Middle East & Africa Strawberry Jam Volume (K), by Application 2025 & 2033
- Figure 41: Middle East & Africa Strawberry Jam Revenue Share (%), by Application 2025 & 2033
- Figure 42: Middle East & Africa Strawberry Jam Volume Share (%), by Application 2025 & 2033
- Figure 43: Middle East & Africa Strawberry Jam Revenue (billion), by Type 2025 & 2033
- Figure 44: Middle East & Africa Strawberry Jam Volume (K), by Type 2025 & 2033
- Figure 45: Middle East & Africa Strawberry Jam Revenue Share (%), by Type 2025 & 2033
- Figure 46: Middle East & Africa Strawberry Jam Volume Share (%), by Type 2025 & 2033
- Figure 47: Middle East & Africa Strawberry Jam Revenue (billion), by Country 2025 & 2033
- Figure 48: Middle East & Africa Strawberry Jam Volume (K), by Country 2025 & 2033
- Figure 49: Middle East & Africa Strawberry Jam Revenue Share (%), by Country 2025 & 2033
- Figure 50: Middle East & Africa Strawberry Jam Volume Share (%), by Country 2025 & 2033
- Figure 51: Asia Pacific Strawberry Jam Revenue (billion), by Application 2025 & 2033
- Figure 52: Asia Pacific Strawberry Jam Volume (K), by Application 2025 & 2033
- Figure 53: Asia Pacific Strawberry Jam Revenue Share (%), by Application 2025 & 2033
- Figure 54: Asia Pacific Strawberry Jam Volume Share (%), by Application 2025 & 2033
- Figure 55: Asia Pacific Strawberry Jam Revenue (billion), by Type 2025 & 2033
- Figure 56: Asia Pacific Strawberry Jam Volume (K), by Type 2025 & 2033
- Figure 57: Asia Pacific Strawberry Jam Revenue Share (%), by Type 2025 & 2033
- Figure 58: Asia Pacific Strawberry Jam Volume Share (%), by Type 2025 & 2033
- Figure 59: Asia Pacific Strawberry Jam Revenue (billion), by Country 2025 & 2033
- Figure 60: Asia Pacific Strawberry Jam Volume (K), by Country 2025 & 2033
- Figure 61: Asia Pacific Strawberry Jam Revenue Share (%), by Country 2025 & 2033
- Figure 62: Asia Pacific Strawberry Jam Volume Share (%), by Country 2025 & 2033
List of Tables
- Table 1: Global Strawberry Jam Revenue billion Forecast, by Application 2020 & 2033
- Table 2: Global Strawberry Jam Volume K Forecast, by Application 2020 & 2033
- Table 3: Global Strawberry Jam Revenue billion Forecast, by Type 2020 & 2033
- Table 4: Global Strawberry Jam Volume K Forecast, by Type 2020 & 2033
- Table 5: Global Strawberry Jam Revenue billion Forecast, by Region 2020 & 2033
- Table 6: Global Strawberry Jam Volume K Forecast, by Region 2020 & 2033
- Table 7: Global Strawberry Jam Revenue billion Forecast, by Application 2020 & 2033
- Table 8: Global Strawberry Jam Volume K Forecast, by Application 2020 & 2033
- Table 9: Global Strawberry Jam Revenue billion Forecast, by Type 2020 & 2033
- Table 10: Global Strawberry Jam Volume K Forecast, by Type 2020 & 2033
- Table 11: Global Strawberry Jam Revenue billion Forecast, by Country 2020 & 2033
- Table 12: Global Strawberry Jam Volume K Forecast, by Country 2020 & 2033
- Table 13: United States Strawberry Jam Revenue (billion) Forecast, by Application 2020 & 2033
- Table 14: United States Strawberry Jam Volume (K) Forecast, by Application 2020 & 2033
- Table 15: Canada Strawberry Jam Revenue (billion) Forecast, by Application 2020 & 2033
- Table 16: Canada Strawberry Jam Volume (K) Forecast, by Application 2020 & 2033
- Table 17: Mexico Strawberry Jam Revenue (billion) Forecast, by Application 2020 & 2033
- Table 18: Mexico Strawberry Jam Volume (K) Forecast, by Application 2020 & 2033
- Table 19: Global Strawberry Jam Revenue billion Forecast, by Application 2020 & 2033
- Table 20: Global Strawberry Jam Volume K Forecast, by Application 2020 & 2033
- Table 21: Global Strawberry Jam Revenue billion Forecast, by Type 2020 & 2033
- Table 22: Global Strawberry Jam Volume K Forecast, by Type 2020 & 2033
- Table 23: Global Strawberry Jam Revenue billion Forecast, by Country 2020 & 2033
- Table 24: Global Strawberry Jam Volume K Forecast, by Country 2020 & 2033
- Table 25: Brazil Strawberry Jam Revenue (billion) Forecast, by Application 2020 & 2033
- Table 26: Brazil Strawberry Jam Volume (K) Forecast, by Application 2020 & 2033
- Table 27: Argentina Strawberry Jam Revenue (billion) Forecast, by Application 2020 & 2033
- Table 28: Argentina Strawberry Jam Volume (K) Forecast, by Application 2020 & 2033
- Table 29: Rest of South America Strawberry Jam Revenue (billion) Forecast, by Application 2020 & 2033
- Table 30: Rest of South America Strawberry Jam Volume (K) Forecast, by Application 2020 & 2033
- Table 31: Global Strawberry Jam Revenue billion Forecast, by Application 2020 & 2033
- Table 32: Global Strawberry Jam Volume K Forecast, by Application 2020 & 2033
- Table 33: Global Strawberry Jam Revenue billion Forecast, by Type 2020 & 2033
- Table 34: Global Strawberry Jam Volume K Forecast, by Type 2020 & 2033
- Table 35: Global Strawberry Jam Revenue billion Forecast, by Country 2020 & 2033
- Table 36: Global Strawberry Jam Volume K Forecast, by Country 2020 & 2033
- Table 37: United Kingdom Strawberry Jam Revenue (billion) Forecast, by Application 2020 & 2033
- Table 38: United Kingdom Strawberry Jam Volume (K) Forecast, by Application 2020 & 2033
- Table 39: Germany Strawberry Jam Revenue (billion) Forecast, by Application 2020 & 2033
- Table 40: Germany Strawberry Jam Volume (K) Forecast, by Application 2020 & 2033
- Table 41: France Strawberry Jam Revenue (billion) Forecast, by Application 2020 & 2033
- Table 42: France Strawberry Jam Volume (K) Forecast, by Application 2020 & 2033
- Table 43: Italy Strawberry Jam Revenue (billion) Forecast, by Application 2020 & 2033
- Table 44: Italy Strawberry Jam Volume (K) Forecast, by Application 2020 & 2033
- Table 45: Spain Strawberry Jam Revenue (billion) Forecast, by Application 2020 & 2033
- Table 46: Spain Strawberry Jam Volume (K) Forecast, by Application 2020 & 2033
- Table 47: Russia Strawberry Jam Revenue (billion) Forecast, by Application 2020 & 2033
- Table 48: Russia Strawberry Jam Volume (K) Forecast, by Application 2020 & 2033
- Table 49: Benelux Strawberry Jam Revenue (billion) Forecast, by Application 2020 & 2033
- Table 50: Benelux Strawberry Jam Volume (K) Forecast, by Application 2020 & 2033
- Table 51: Nordics Strawberry Jam Revenue (billion) Forecast, by Application 2020 & 2033
- Table 52: Nordics Strawberry Jam Volume (K) Forecast, by Application 2020 & 2033
- Table 53: Rest of Europe Strawberry Jam Revenue (billion) Forecast, by Application 2020 & 2033
- Table 54: Rest of Europe Strawberry Jam Volume (K) Forecast, by Application 2020 & 2033
- Table 55: Global Strawberry Jam Revenue billion Forecast, by Application 2020 & 2033
- Table 56: Global Strawberry Jam Volume K Forecast, by Application 2020 & 2033
- Table 57: Global Strawberry Jam Revenue billion Forecast, by Type 2020 & 2033
- Table 58: Global Strawberry Jam Volume K Forecast, by Type 2020 & 2033
- Table 59: Global Strawberry Jam Revenue billion Forecast, by Country 2020 & 2033
- Table 60: Global Strawberry Jam Volume K Forecast, by Country 2020 & 2033
- Table 61: Turkey Strawberry Jam Revenue (billion) Forecast, by Application 2020 & 2033
- Table 62: Turkey Strawberry Jam Volume (K) Forecast, by Application 2020 & 2033
- Table 63: Israel Strawberry Jam Revenue (billion) Forecast, by Application 2020 & 2033
- Table 64: Israel Strawberry Jam Volume (K) Forecast, by Application 2020 & 2033
- Table 65: GCC Strawberry Jam Revenue (billion) Forecast, by Application 2020 & 2033
- Table 66: GCC Strawberry Jam Volume (K) Forecast, by Application 2020 & 2033
- Table 67: North Africa Strawberry Jam Revenue (billion) Forecast, by Application 2020 & 2033
- Table 68: North Africa Strawberry Jam Volume (K) Forecast, by Application 2020 & 2033
- Table 69: South Africa Strawberry Jam Revenue (billion) Forecast, by Application 2020 & 2033
- Table 70: South Africa Strawberry Jam Volume (K) Forecast, by Application 2020 & 2033
- Table 71: Rest of Middle East & Africa Strawberry Jam Revenue (billion) Forecast, by Application 2020 & 2033
- Table 72: Rest of Middle East & Africa Strawberry Jam Volume (K) Forecast, by Application 2020 & 2033
- Table 73: Global Strawberry Jam Revenue billion Forecast, by Application 2020 & 2033
- Table 74: Global Strawberry Jam Volume K Forecast, by Application 2020 & 2033
- Table 75: Global Strawberry Jam Revenue billion Forecast, by Type 2020 & 2033
- Table 76: Global Strawberry Jam Volume K Forecast, by Type 2020 & 2033
- Table 77: Global Strawberry Jam Revenue billion Forecast, by Country 2020 & 2033
- Table 78: Global Strawberry Jam Volume K Forecast, by Country 2020 & 2033
- Table 79: China Strawberry Jam Revenue (billion) Forecast, by Application 2020 & 2033
- Table 80: China Strawberry Jam Volume (K) Forecast, by Application 2020 & 2033
- Table 81: India Strawberry Jam Revenue (billion) Forecast, by Application 2020 & 2033
- Table 82: India Strawberry Jam Volume (K) Forecast, by Application 2020 & 2033
- Table 83: Japan Strawberry Jam Revenue (billion) Forecast, by Application 2020 & 2033
- Table 84: Japan Strawberry Jam Volume (K) Forecast, by Application 2020 & 2033
- Table 85: South Korea Strawberry Jam Revenue (billion) Forecast, by Application 2020 & 2033
- Table 86: South Korea Strawberry Jam Volume (K) Forecast, by Application 2020 & 2033
- Table 87: ASEAN Strawberry Jam Revenue (billion) Forecast, by Application 2020 & 2033
- Table 88: ASEAN Strawberry Jam Volume (K) Forecast, by Application 2020 & 2033
- Table 89: Oceania Strawberry Jam Revenue (billion) Forecast, by Application 2020 & 2033
- Table 90: Oceania Strawberry Jam Volume (K) Forecast, by Application 2020 & 2033
- Table 91: Rest of Asia Pacific Strawberry Jam Revenue (billion) Forecast, by Application 2020 & 2033
- Table 92: Rest of Asia Pacific Strawberry Jam Volume (K) Forecast, by Application 2020 & 2033
Frequently Asked Questions
1. What is the projected Compound Annual Growth Rate (CAGR) of the Strawberry Jam?
The projected CAGR is approximately 5.2%.
2. Which companies are prominent players in the Strawberry Jam?
Key companies in the market include Agrana, Frulact, Zuegg, Zentis, Hero, Valio, BINA, Fourayes, Fresh Food Industries, JM Smucker, Ingredion Incorporated, Puratos, Döhler, SVZ International, Tree Top, Andros France.
3. What are the main segments of the Strawberry Jam?
The market segments include Application, Type.
4. Can you provide details about the market size?
The market size is estimated to be USD 9.39 billion as of 2022.
5. What are some drivers contributing to market growth?
N/A
6. What are the notable trends driving market growth?
N/A
7. Are there any restraints impacting market growth?
N/A
8. Can you provide examples of recent developments in the market?
N/A
9. What pricing options are available for accessing the report?
Pricing options include single-user, multi-user, and enterprise licenses priced at USD 3950.00, USD 5925.00, and USD 7900.00 respectively.
10. Is the market size provided in terms of value or volume?
The market size is provided in terms of value, measured in billion and volume, measured in K.
11. Are there any specific market keywords associated with the report?
Yes, the market keyword associated with the report is "Strawberry Jam," which aids in identifying and referencing the specific market segment covered.
12. How do I determine which pricing option suits my needs best?
The pricing options vary based on user requirements and access needs. Individual users may opt for single-user licenses, while businesses requiring broader access may choose multi-user or enterprise licenses for cost-effective access to the report.
13. Are there any additional resources or data provided in the Strawberry Jam report?
While the report offers comprehensive insights, it's advisable to review the specific contents or supplementary materials provided to ascertain if additional resources or data are available.
14. How can I stay updated on further developments or reports in the Strawberry Jam?
To stay informed about further developments, trends, and reports in the Strawberry Jam, consider subscribing to industry newsletters, following relevant companies and organizations, or regularly checking reputable industry news sources and publications.
Methodology
Step 1 - Identification of Relevant Samples Size from Population Database


Step 2 - Approaches for Defining Global Market Size (Value, Volume* & Price*)

Note*: In applicable scenarios
Step 3 - Data Sources
Primary Research
- Web Analytics
- Survey Reports
- Research Institute
- Latest Research Reports
- Opinion Leaders
Secondary Research
- Annual Reports
- White Paper
- Latest Press Release
- Industry Association
- Paid Database
- Investor Presentations

Step 4 - Data Triangulation
Involves using different sources of information in order to increase the validity of a study
These sources are likely to be stakeholders in a program - participants, other researchers, program staff, other community members, and so on.
Then we put all data in single framework & apply various statistical tools to find out the dynamic on the market.
During the analysis stage, feedback from the stakeholder groups would be compared to determine areas of agreement as well as areas of divergence