

Key Insights
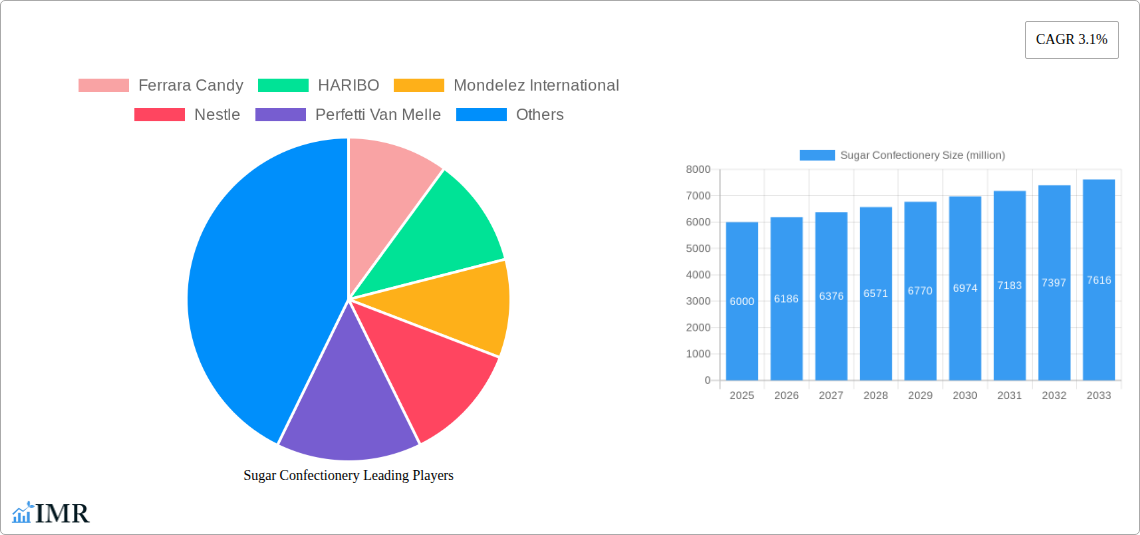
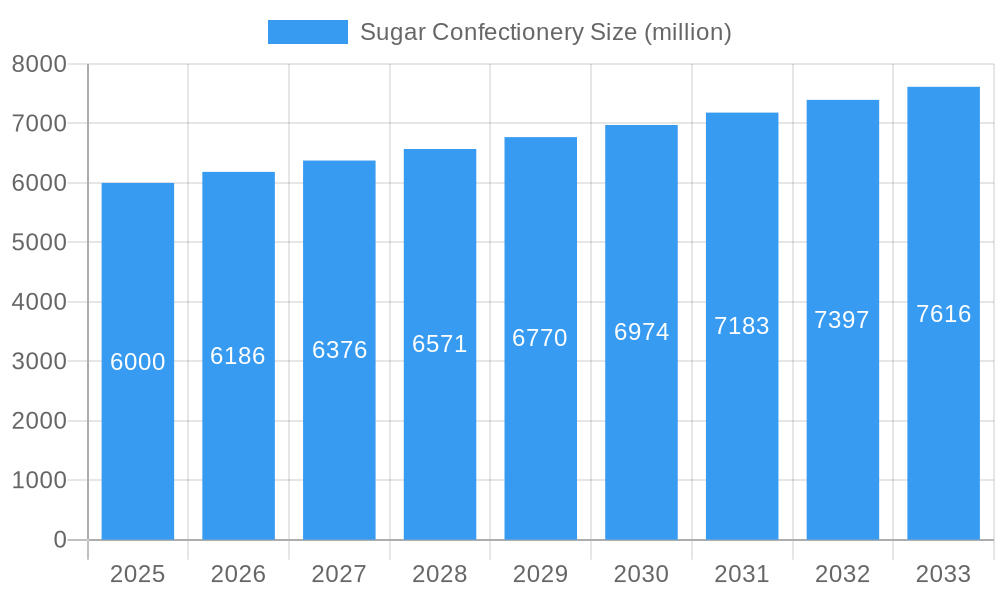
The sugar confectionery market, currently valued at $6,000 million (2025), is projected to experience steady growth, exhibiting a Compound Annual Growth Rate (CAGR) of 3.1% from 2025 to 2033. This growth is driven by several factors. The enduring popularity of classic confectionery items combined with the continuous innovation in flavors, textures, and formats fuels consumer demand. Furthermore, the increasing disposable incomes in developing economies and changing consumer preferences towards convenient, on-the-go snacks contribute to market expansion. The market is also witnessing a shift towards healthier options, with manufacturers introducing products with reduced sugar content or incorporating natural ingredients. However, growing health concerns regarding sugar consumption and increasing awareness of its negative impact pose a significant restraint to market growth. Regulatory changes related to sugar content in food products and fluctuating raw material prices further impact profitability and market dynamics. Key players such as Ferrara Candy, HARIBO, Mondelez International, Nestlé, Perfetti Van Melle, Wrigley, Adams and Brooks Candy, American Licorice, and Anthony-Thomas Candy are actively competing through product diversification, strategic acquisitions, and brand building initiatives to maintain their market positions.
Sugar Confectionery Market Size (In Billion)
The segmentation of the sugar confectionery market is multifaceted, including categories based on product type (e.g., chocolate confectionery, non-chocolate confectionery, gum), distribution channels (e.g., supermarkets, convenience stores, online retailers), and target demographics (e.g., children, adults). Geographical variations in consumer preferences and cultural factors influence regional market penetration. While mature markets in North America and Europe exhibit steady growth, emerging markets in Asia-Pacific and Latin America offer substantial growth opportunities. The competitive landscape is intensely dynamic, with manufacturers focusing on developing innovative products, enhancing distribution networks, and strategic partnerships to cater to evolving consumer demands and sustain market share in the face of economic fluctuations and evolving health and wellness trends.
Sugar Confectionery Company Market Share
Sugar Confectionery Market Report: 2019-2033
This comprehensive report provides an in-depth analysis of the global sugar confectionery market, encompassing historical data (2019-2024), the base year (2025), and a detailed forecast (2025-2033). It segments the market, analyzing key players, trends, and future opportunities within the broader food and beverage industry. The report offers crucial insights for industry professionals, investors, and strategic decision-makers seeking to navigate this dynamic market.
Keywords: Sugar Confectionery Market, Candy Market, Confectionery Industry, Market Size, Market Share, Market Growth, Ferrara Candy, HARIBO, Mondelez International, Nestle, Perfetti Van Melle, Wrigley, Adams and Brooks Candy, American Licorice, Anthony-Thomas Candy, Market Trends, Industry Analysis, Market Forecast, CAGR, M&A, Technological Innovation, Consumer Behavior, Regional Analysis, Growth Opportunities.
Sugar Confectionery Market Dynamics & Structure
The global sugar confectionery market is a highly competitive landscape characterized by a mix of established multinational giants and smaller, specialized players. Market concentration is moderate, with a few key players holding significant market share, while numerous regional and niche brands contribute to the overall volume. Technological innovation focuses primarily on improving production efficiency, enhancing flavor profiles, and developing healthier alternatives (e.g., reduced sugar options). Regulatory frameworks, particularly those concerning sugar content and labeling, significantly impact market dynamics. Competitive substitutes, including gum, chocolate, and other snacks, exert pressure. The end-user demographic is broad, encompassing all age groups, with specific product categories targeting children, adults, and specialized dietary needs. M&A activity has been significant, with larger companies acquiring smaller brands to expand their product portfolios and market reach.
- Market Concentration: Moderate, with top 5 players holding approximately xx% of the market share in 2025.
- Technological Innovation: Focus on automation, new flavor development, and reduced-sugar formulations.
- Regulatory Framework: Increasingly stringent regulations on sugar content and labeling in several key markets.
- Competitive Substitutes: Gum, chocolate, and other snacks are key competitors.
- End-User Demographics: Broad, encompassing all age groups and dietary needs.
- M&A Trends: Consistent M&A activity, with an estimated xx deals in the historical period (2019-2024), primarily focused on expanding product portfolios and geographical reach.
Sugar Confectionery Growth Trends & Insights
The global sugar confectionery market experienced a compound annual growth rate (CAGR) of xx% during the historical period (2019-2024). This growth was driven by factors including rising disposable incomes in developing economies, increasing demand for convenient snack options, and product diversification through new flavors and formats. However, growing health consciousness and increasing awareness of the health implications of high sugar intake have presented challenges, leading to a shift towards healthier alternatives such as reduced-sugar and sugar-free options. Technological disruptions, including the use of advanced manufacturing processes and personalized product offerings, are further shaping the market landscape. Consumer behavior is evolving, with increasing demand for premium, ethically sourced products and personalized experiences driving further segmentation. This trend is expected to continue, with a projected CAGR of xx% during the forecast period (2025-2033), although at a slightly slower pace due to health concerns. Market penetration is estimated at xx% in 2025, with potential for further growth in emerging markets.
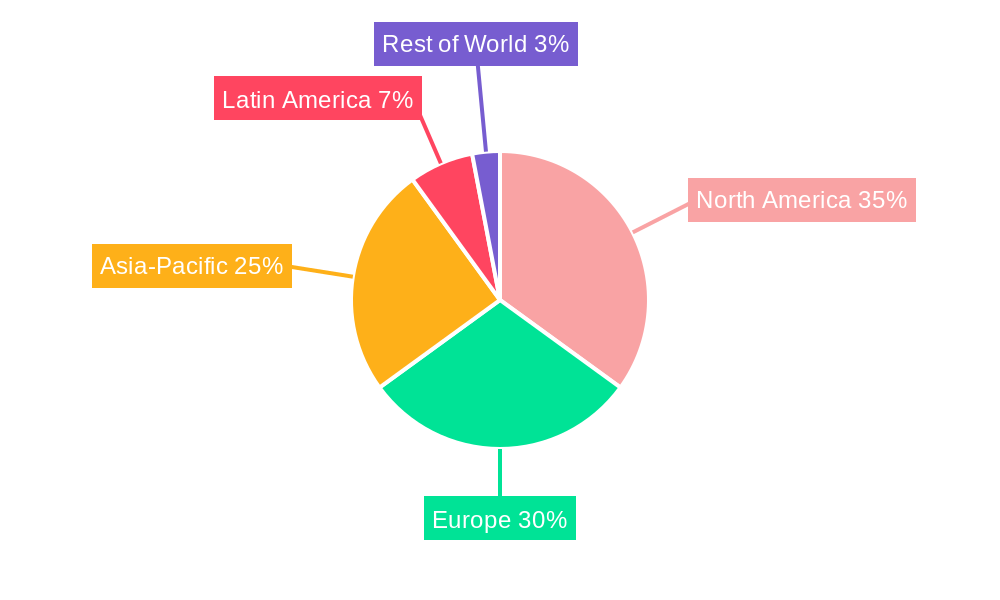
Dominant Regions, Countries, or Segments in Sugar Confectionery
North America currently holds the largest market share in the global sugar confectionery market, followed by Europe and Asia-Pacific. This dominance is largely attributed to factors such as high per capita consumption, established distribution networks, and the presence of major confectionery companies. Key drivers in these regions include strong consumer demand for diverse product offerings and a well-developed retail infrastructure. However, Asia-Pacific is projected to exhibit the highest growth rate during the forecast period, driven by rising disposable incomes, a growing middle class, and increasing urbanization in many developing countries.
- North America: High per capita consumption and established market presence.
- Europe: Mature market with established players and diverse product offerings.
- Asia-Pacific: High growth potential driven by rising disposable incomes and urbanization.
- Other Regions: Significant market potential but facing challenges related to infrastructure and regulatory compliance.
Sugar Confectionery Product Landscape
The sugar confectionery market offers a diverse range of products, including hard candies, chewy candies, gummies, lollipops, and chocolate-covered confectionery. Innovation focuses on new flavor combinations, improved textures, and healthier formulations with reduced sugar or alternative sweeteners. Product performance is increasingly measured by factors such as shelf life, texture stability, and sensory appeal. The successful introduction of innovative products often hinges on creating a unique selling proposition by offering novel flavor combinations, organic ingredients, or unique shapes and sizes.
Key Drivers, Barriers & Challenges in Sugar Confectionery
Key Drivers:
- Increasing disposable incomes globally.
- Growing demand for convenient snack options.
- Product innovation and diversification.
Challenges and Restraints:
- Growing health concerns regarding high sugar consumption.
- Stringent regulations on sugar content and labeling.
- Increasing competition from alternative snack options.
- Supply chain disruptions lead to xx million units shortfall in 2024.
Emerging Opportunities in Sugar Confectionery
- Expansion into emerging markets with growing middle classes.
- Development of healthier options, including reduced-sugar and organic products.
- Personalized and customized confectionery offerings.
- Focus on premium and specialty confectionery segments.
Growth Accelerators in the Sugar Confectionery Industry
Long-term growth will be fueled by strategic partnerships, expansion into untapped markets (particularly in developing economies), and technological advancements in production and formulation. The development of healthier, sustainably sourced ingredients will also be a key driver.
Key Players Shaping the Sugar Confectionery Market
- Ferrara Candy
- HARIBO
- Mondelez International
- Nestle
- Perfetti Van Melle
- Wrigley
- Adams and Brooks Candy
- American Licorice
- Anthony-Thomas Candy
Notable Milestones in Sugar Confectionery Sector
- 2020: Increased focus on e-commerce channels for confectionery sales.
- 2021: Several major confectionery companies launched reduced-sugar product lines.
- 2022: Significant investment in sustainable sourcing practices by leading manufacturers.
- 2023: Launch of innovative confectionery products incorporating new technologies and ingredients.
- 2024: Increased regulatory scrutiny on sugar content and marketing practices.
In-Depth Sugar Confectionery Market Outlook
The future of the sugar confectionery market hinges on the ability of companies to adapt to changing consumer preferences, meet increasingly stringent regulations, and innovate in both product offerings and sustainable production practices. Opportunities exist in expanding into emerging markets, developing healthier options, and utilizing technology to enhance the consumer experience. The overall market is poised for continued growth, though at a moderated pace compared to the past, driven by these key factors.
Sugar Confectionery Segmentation
-
1. Application
- 1.1. Dessert
- 1.2. Drinks
- 1.3. Ice Cream
- 1.4. Other
-
2. Type
- 2.1. Caramels and Toffees
- 2.2. Medicated Confectionery
- 2.3. Mints
- 2.4. Others
Sugar Confectionery Segmentation By Geography
-
1. North America
- 1.1. United States
- 1.2. Canada
- 1.3. Mexico
-
2. South America
- 2.1. Brazil
- 2.2. Argentina
- 2.3. Rest of South America
-
3. Europe
- 3.1. United Kingdom
- 3.2. Germany
- 3.3. France
- 3.4. Italy
- 3.5. Spain
- 3.6. Russia
- 3.7. Benelux
- 3.8. Nordics
- 3.9. Rest of Europe
-
4. Middle East & Africa
- 4.1. Turkey
- 4.2. Israel
- 4.3. GCC
- 4.4. North Africa
- 4.5. South Africa
- 4.6. Rest of Middle East & Africa
-
5. Asia Pacific
- 5.1. China
- 5.2. India
- 5.3. Japan
- 5.4. South Korea
- 5.5. ASEAN
- 5.6. Oceania
- 5.7. Rest of Asia Pacific
Sugar Confectionery Regional Market Share
Geographic Coverage of Sugar Confectionery
Sugar Confectionery REPORT HIGHLIGHTS
| Aspects | Details |
|---|---|
| Study Period | 2020-2034 |
| Base Year | 2025 |
| Estimated Year | 2026 |
| Forecast Period | 2026-2034 |
| Historical Period | 2020-2025 |
| Growth Rate | CAGR of 4.7% from 2020-2034 |
| Segmentation |
|
Table of Contents
- 1. Introduction
- 1.1. Research Scope
- 1.2. Market Segmentation
- 1.3. Research Methodology
- 1.4. Definitions and Assumptions
- 2. Executive Summary
- 2.1. Introduction
- 3. Market Dynamics
- 3.1. Introduction
- 3.2. Market Drivers
- 3.3. Market Restrains
- 3.4. Market Trends
- 4. Market Factor Analysis
- 4.1. Porters Five Forces
- 4.2. Supply/Value Chain
- 4.3. PESTEL analysis
- 4.4. Market Entropy
- 4.5. Patent/Trademark Analysis
- 5. Global Sugar Confectionery Analysis, Insights and Forecast, 2020-2032
- 5.1. Market Analysis, Insights and Forecast - by Application
- 5.1.1. Dessert
- 5.1.2. Drinks
- 5.1.3. Ice Cream
- 5.1.4. Other
- 5.2. Market Analysis, Insights and Forecast - by Type
- 5.2.1. Caramels and Toffees
- 5.2.2. Medicated Confectionery
- 5.2.3. Mints
- 5.2.4. Others
- 5.3. Market Analysis, Insights and Forecast - by Region
- 5.3.1. North America
- 5.3.2. South America
- 5.3.3. Europe
- 5.3.4. Middle East & Africa
- 5.3.5. Asia Pacific
- 5.1. Market Analysis, Insights and Forecast - by Application
- 6. North America Sugar Confectionery Analysis, Insights and Forecast, 2020-2032
- 6.1. Market Analysis, Insights and Forecast - by Application
- 6.1.1. Dessert
- 6.1.2. Drinks
- 6.1.3. Ice Cream
- 6.1.4. Other
- 6.2. Market Analysis, Insights and Forecast - by Type
- 6.2.1. Caramels and Toffees
- 6.2.2. Medicated Confectionery
- 6.2.3. Mints
- 6.2.4. Others
- 6.1. Market Analysis, Insights and Forecast - by Application
- 7. South America Sugar Confectionery Analysis, Insights and Forecast, 2020-2032
- 7.1. Market Analysis, Insights and Forecast - by Application
- 7.1.1. Dessert
- 7.1.2. Drinks
- 7.1.3. Ice Cream
- 7.1.4. Other
- 7.2. Market Analysis, Insights and Forecast - by Type
- 7.2.1. Caramels and Toffees
- 7.2.2. Medicated Confectionery
- 7.2.3. Mints
- 7.2.4. Others
- 7.1. Market Analysis, Insights and Forecast - by Application
- 8. Europe Sugar Confectionery Analysis, Insights and Forecast, 2020-2032
- 8.1. Market Analysis, Insights and Forecast - by Application
- 8.1.1. Dessert
- 8.1.2. Drinks
- 8.1.3. Ice Cream
- 8.1.4. Other
- 8.2. Market Analysis, Insights and Forecast - by Type
- 8.2.1. Caramels and Toffees
- 8.2.2. Medicated Confectionery
- 8.2.3. Mints
- 8.2.4. Others
- 8.1. Market Analysis, Insights and Forecast - by Application
- 9. Middle East & Africa Sugar Confectionery Analysis, Insights and Forecast, 2020-2032
- 9.1. Market Analysis, Insights and Forecast - by Application
- 9.1.1. Dessert
- 9.1.2. Drinks
- 9.1.3. Ice Cream
- 9.1.4. Other
- 9.2. Market Analysis, Insights and Forecast - by Type
- 9.2.1. Caramels and Toffees
- 9.2.2. Medicated Confectionery
- 9.2.3. Mints
- 9.2.4. Others
- 9.1. Market Analysis, Insights and Forecast - by Application
- 10. Asia Pacific Sugar Confectionery Analysis, Insights and Forecast, 2020-2032
- 10.1. Market Analysis, Insights and Forecast - by Application
- 10.1.1. Dessert
- 10.1.2. Drinks
- 10.1.3. Ice Cream
- 10.1.4. Other
- 10.2. Market Analysis, Insights and Forecast - by Type
- 10.2.1. Caramels and Toffees
- 10.2.2. Medicated Confectionery
- 10.2.3. Mints
- 10.2.4. Others
- 10.1. Market Analysis, Insights and Forecast - by Application
- 11. Competitive Analysis
- 11.1. Global Market Share Analysis 2025
- 11.2. Company Profiles
- 11.2.1 Ferrara Candy
- 11.2.1.1. Overview
- 11.2.1.2. Products
- 11.2.1.3. SWOT Analysis
- 11.2.1.4. Recent Developments
- 11.2.1.5. Financials (Based on Availability)
- 11.2.2 HARIBO
- 11.2.2.1. Overview
- 11.2.2.2. Products
- 11.2.2.3. SWOT Analysis
- 11.2.2.4. Recent Developments
- 11.2.2.5. Financials (Based on Availability)
- 11.2.3 Mondelez International
- 11.2.3.1. Overview
- 11.2.3.2. Products
- 11.2.3.3. SWOT Analysis
- 11.2.3.4. Recent Developments
- 11.2.3.5. Financials (Based on Availability)
- 11.2.4 Nestle
- 11.2.4.1. Overview
- 11.2.4.2. Products
- 11.2.4.3. SWOT Analysis
- 11.2.4.4. Recent Developments
- 11.2.4.5. Financials (Based on Availability)
- 11.2.5 Perfetti Van Melle
- 11.2.5.1. Overview
- 11.2.5.2. Products
- 11.2.5.3. SWOT Analysis
- 11.2.5.4. Recent Developments
- 11.2.5.5. Financials (Based on Availability)
- 11.2.6 Wrigley
- 11.2.6.1. Overview
- 11.2.6.2. Products
- 11.2.6.3. SWOT Analysis
- 11.2.6.4. Recent Developments
- 11.2.6.5. Financials (Based on Availability)
- 11.2.7 Adams and Brooks Candy
- 11.2.7.1. Overview
- 11.2.7.2. Products
- 11.2.7.3. SWOT Analysis
- 11.2.7.4. Recent Developments
- 11.2.7.5. Financials (Based on Availability)
- 11.2.8 American Licorice
- 11.2.8.1. Overview
- 11.2.8.2. Products
- 11.2.8.3. SWOT Analysis
- 11.2.8.4. Recent Developments
- 11.2.8.5. Financials (Based on Availability)
- 11.2.9 Anthony-Thomas Candy
- 11.2.9.1. Overview
- 11.2.9.2. Products
- 11.2.9.3. SWOT Analysis
- 11.2.9.4. Recent Developments
- 11.2.9.5. Financials (Based on Availability)
- 11.2.1 Ferrara Candy
List of Figures
- Figure 1: Global Sugar Confectionery Revenue Breakdown (undefined, %) by Region 2025 & 2033
- Figure 2: Global Sugar Confectionery Volume Breakdown (K, %) by Region 2025 & 2033
- Figure 3: North America Sugar Confectionery Revenue (undefined), by Application 2025 & 2033
- Figure 4: North America Sugar Confectionery Volume (K), by Application 2025 & 2033
- Figure 5: North America Sugar Confectionery Revenue Share (%), by Application 2025 & 2033
- Figure 6: North America Sugar Confectionery Volume Share (%), by Application 2025 & 2033
- Figure 7: North America Sugar Confectionery Revenue (undefined), by Type 2025 & 2033
- Figure 8: North America Sugar Confectionery Volume (K), by Type 2025 & 2033
- Figure 9: North America Sugar Confectionery Revenue Share (%), by Type 2025 & 2033
- Figure 10: North America Sugar Confectionery Volume Share (%), by Type 2025 & 2033
- Figure 11: North America Sugar Confectionery Revenue (undefined), by Country 2025 & 2033
- Figure 12: North America Sugar Confectionery Volume (K), by Country 2025 & 2033
- Figure 13: North America Sugar Confectionery Revenue Share (%), by Country 2025 & 2033
- Figure 14: North America Sugar Confectionery Volume Share (%), by Country 2025 & 2033
- Figure 15: South America Sugar Confectionery Revenue (undefined), by Application 2025 & 2033
- Figure 16: South America Sugar Confectionery Volume (K), by Application 2025 & 2033
- Figure 17: South America Sugar Confectionery Revenue Share (%), by Application 2025 & 2033
- Figure 18: South America Sugar Confectionery Volume Share (%), by Application 2025 & 2033
- Figure 19: South America Sugar Confectionery Revenue (undefined), by Type 2025 & 2033
- Figure 20: South America Sugar Confectionery Volume (K), by Type 2025 & 2033
- Figure 21: South America Sugar Confectionery Revenue Share (%), by Type 2025 & 2033
- Figure 22: South America Sugar Confectionery Volume Share (%), by Type 2025 & 2033
- Figure 23: South America Sugar Confectionery Revenue (undefined), by Country 2025 & 2033
- Figure 24: South America Sugar Confectionery Volume (K), by Country 2025 & 2033
- Figure 25: South America Sugar Confectionery Revenue Share (%), by Country 2025 & 2033
- Figure 26: South America Sugar Confectionery Volume Share (%), by Country 2025 & 2033
- Figure 27: Europe Sugar Confectionery Revenue (undefined), by Application 2025 & 2033
- Figure 28: Europe Sugar Confectionery Volume (K), by Application 2025 & 2033
- Figure 29: Europe Sugar Confectionery Revenue Share (%), by Application 2025 & 2033
- Figure 30: Europe Sugar Confectionery Volume Share (%), by Application 2025 & 2033
- Figure 31: Europe Sugar Confectionery Revenue (undefined), by Type 2025 & 2033
- Figure 32: Europe Sugar Confectionery Volume (K), by Type 2025 & 2033
- Figure 33: Europe Sugar Confectionery Revenue Share (%), by Type 2025 & 2033
- Figure 34: Europe Sugar Confectionery Volume Share (%), by Type 2025 & 2033
- Figure 35: Europe Sugar Confectionery Revenue (undefined), by Country 2025 & 2033
- Figure 36: Europe Sugar Confectionery Volume (K), by Country 2025 & 2033
- Figure 37: Europe Sugar Confectionery Revenue Share (%), by Country 2025 & 2033
- Figure 38: Europe Sugar Confectionery Volume Share (%), by Country 2025 & 2033
- Figure 39: Middle East & Africa Sugar Confectionery Revenue (undefined), by Application 2025 & 2033
- Figure 40: Middle East & Africa Sugar Confectionery Volume (K), by Application 2025 & 2033
- Figure 41: Middle East & Africa Sugar Confectionery Revenue Share (%), by Application 2025 & 2033
- Figure 42: Middle East & Africa Sugar Confectionery Volume Share (%), by Application 2025 & 2033
- Figure 43: Middle East & Africa Sugar Confectionery Revenue (undefined), by Type 2025 & 2033
- Figure 44: Middle East & Africa Sugar Confectionery Volume (K), by Type 2025 & 2033
- Figure 45: Middle East & Africa Sugar Confectionery Revenue Share (%), by Type 2025 & 2033
- Figure 46: Middle East & Africa Sugar Confectionery Volume Share (%), by Type 2025 & 2033
- Figure 47: Middle East & Africa Sugar Confectionery Revenue (undefined), by Country 2025 & 2033
- Figure 48: Middle East & Africa Sugar Confectionery Volume (K), by Country 2025 & 2033
- Figure 49: Middle East & Africa Sugar Confectionery Revenue Share (%), by Country 2025 & 2033
- Figure 50: Middle East & Africa Sugar Confectionery Volume Share (%), by Country 2025 & 2033
- Figure 51: Asia Pacific Sugar Confectionery Revenue (undefined), by Application 2025 & 2033
- Figure 52: Asia Pacific Sugar Confectionery Volume (K), by Application 2025 & 2033
- Figure 53: Asia Pacific Sugar Confectionery Revenue Share (%), by Application 2025 & 2033
- Figure 54: Asia Pacific Sugar Confectionery Volume Share (%), by Application 2025 & 2033
- Figure 55: Asia Pacific Sugar Confectionery Revenue (undefined), by Type 2025 & 2033
- Figure 56: Asia Pacific Sugar Confectionery Volume (K), by Type 2025 & 2033
- Figure 57: Asia Pacific Sugar Confectionery Revenue Share (%), by Type 2025 & 2033
- Figure 58: Asia Pacific Sugar Confectionery Volume Share (%), by Type 2025 & 2033
- Figure 59: Asia Pacific Sugar Confectionery Revenue (undefined), by Country 2025 & 2033
- Figure 60: Asia Pacific Sugar Confectionery Volume (K), by Country 2025 & 2033
- Figure 61: Asia Pacific Sugar Confectionery Revenue Share (%), by Country 2025 & 2033
- Figure 62: Asia Pacific Sugar Confectionery Volume Share (%), by Country 2025 & 2033
List of Tables
- Table 1: Global Sugar Confectionery Revenue undefined Forecast, by Application 2020 & 2033
- Table 2: Global Sugar Confectionery Volume K Forecast, by Application 2020 & 2033
- Table 3: Global Sugar Confectionery Revenue undefined Forecast, by Type 2020 & 2033
- Table 4: Global Sugar Confectionery Volume K Forecast, by Type 2020 & 2033
- Table 5: Global Sugar Confectionery Revenue undefined Forecast, by Region 2020 & 2033
- Table 6: Global Sugar Confectionery Volume K Forecast, by Region 2020 & 2033
- Table 7: Global Sugar Confectionery Revenue undefined Forecast, by Application 2020 & 2033
- Table 8: Global Sugar Confectionery Volume K Forecast, by Application 2020 & 2033
- Table 9: Global Sugar Confectionery Revenue undefined Forecast, by Type 2020 & 2033
- Table 10: Global Sugar Confectionery Volume K Forecast, by Type 2020 & 2033
- Table 11: Global Sugar Confectionery Revenue undefined Forecast, by Country 2020 & 2033
- Table 12: Global Sugar Confectionery Volume K Forecast, by Country 2020 & 2033
- Table 13: United States Sugar Confectionery Revenue (undefined) Forecast, by Application 2020 & 2033
- Table 14: United States Sugar Confectionery Volume (K) Forecast, by Application 2020 & 2033
- Table 15: Canada Sugar Confectionery Revenue (undefined) Forecast, by Application 2020 & 2033
- Table 16: Canada Sugar Confectionery Volume (K) Forecast, by Application 2020 & 2033
- Table 17: Mexico Sugar Confectionery Revenue (undefined) Forecast, by Application 2020 & 2033
- Table 18: Mexico Sugar Confectionery Volume (K) Forecast, by Application 2020 & 2033
- Table 19: Global Sugar Confectionery Revenue undefined Forecast, by Application 2020 & 2033
- Table 20: Global Sugar Confectionery Volume K Forecast, by Application 2020 & 2033
- Table 21: Global Sugar Confectionery Revenue undefined Forecast, by Type 2020 & 2033
- Table 22: Global Sugar Confectionery Volume K Forecast, by Type 2020 & 2033
- Table 23: Global Sugar Confectionery Revenue undefined Forecast, by Country 2020 & 2033
- Table 24: Global Sugar Confectionery Volume K Forecast, by Country 2020 & 2033
- Table 25: Brazil Sugar Confectionery Revenue (undefined) Forecast, by Application 2020 & 2033
- Table 26: Brazil Sugar Confectionery Volume (K) Forecast, by Application 2020 & 2033
- Table 27: Argentina Sugar Confectionery Revenue (undefined) Forecast, by Application 2020 & 2033
- Table 28: Argentina Sugar Confectionery Volume (K) Forecast, by Application 2020 & 2033
- Table 29: Rest of South America Sugar Confectionery Revenue (undefined) Forecast, by Application 2020 & 2033
- Table 30: Rest of South America Sugar Confectionery Volume (K) Forecast, by Application 2020 & 2033
- Table 31: Global Sugar Confectionery Revenue undefined Forecast, by Application 2020 & 2033
- Table 32: Global Sugar Confectionery Volume K Forecast, by Application 2020 & 2033
- Table 33: Global Sugar Confectionery Revenue undefined Forecast, by Type 2020 & 2033
- Table 34: Global Sugar Confectionery Volume K Forecast, by Type 2020 & 2033
- Table 35: Global Sugar Confectionery Revenue undefined Forecast, by Country 2020 & 2033
- Table 36: Global Sugar Confectionery Volume K Forecast, by Country 2020 & 2033
- Table 37: United Kingdom Sugar Confectionery Revenue (undefined) Forecast, by Application 2020 & 2033
- Table 38: United Kingdom Sugar Confectionery Volume (K) Forecast, by Application 2020 & 2033
- Table 39: Germany Sugar Confectionery Revenue (undefined) Forecast, by Application 2020 & 2033
- Table 40: Germany Sugar Confectionery Volume (K) Forecast, by Application 2020 & 2033
- Table 41: France Sugar Confectionery Revenue (undefined) Forecast, by Application 2020 & 2033
- Table 42: France Sugar Confectionery Volume (K) Forecast, by Application 2020 & 2033
- Table 43: Italy Sugar Confectionery Revenue (undefined) Forecast, by Application 2020 & 2033
- Table 44: Italy Sugar Confectionery Volume (K) Forecast, by Application 2020 & 2033
- Table 45: Spain Sugar Confectionery Revenue (undefined) Forecast, by Application 2020 & 2033
- Table 46: Spain Sugar Confectionery Volume (K) Forecast, by Application 2020 & 2033
- Table 47: Russia Sugar Confectionery Revenue (undefined) Forecast, by Application 2020 & 2033
- Table 48: Russia Sugar Confectionery Volume (K) Forecast, by Application 2020 & 2033
- Table 49: Benelux Sugar Confectionery Revenue (undefined) Forecast, by Application 2020 & 2033
- Table 50: Benelux Sugar Confectionery Volume (K) Forecast, by Application 2020 & 2033
- Table 51: Nordics Sugar Confectionery Revenue (undefined) Forecast, by Application 2020 & 2033
- Table 52: Nordics Sugar Confectionery Volume (K) Forecast, by Application 2020 & 2033
- Table 53: Rest of Europe Sugar Confectionery Revenue (undefined) Forecast, by Application 2020 & 2033
- Table 54: Rest of Europe Sugar Confectionery Volume (K) Forecast, by Application 2020 & 2033
- Table 55: Global Sugar Confectionery Revenue undefined Forecast, by Application 2020 & 2033
- Table 56: Global Sugar Confectionery Volume K Forecast, by Application 2020 & 2033
- Table 57: Global Sugar Confectionery Revenue undefined Forecast, by Type 2020 & 2033
- Table 58: Global Sugar Confectionery Volume K Forecast, by Type 2020 & 2033
- Table 59: Global Sugar Confectionery Revenue undefined Forecast, by Country 2020 & 2033
- Table 60: Global Sugar Confectionery Volume K Forecast, by Country 2020 & 2033
- Table 61: Turkey Sugar Confectionery Revenue (undefined) Forecast, by Application 2020 & 2033
- Table 62: Turkey Sugar Confectionery Volume (K) Forecast, by Application 2020 & 2033
- Table 63: Israel Sugar Confectionery Revenue (undefined) Forecast, by Application 2020 & 2033
- Table 64: Israel Sugar Confectionery Volume (K) Forecast, by Application 2020 & 2033
- Table 65: GCC Sugar Confectionery Revenue (undefined) Forecast, by Application 2020 & 2033
- Table 66: GCC Sugar Confectionery Volume (K) Forecast, by Application 2020 & 2033
- Table 67: North Africa Sugar Confectionery Revenue (undefined) Forecast, by Application 2020 & 2033
- Table 68: North Africa Sugar Confectionery Volume (K) Forecast, by Application 2020 & 2033
- Table 69: South Africa Sugar Confectionery Revenue (undefined) Forecast, by Application 2020 & 2033
- Table 70: South Africa Sugar Confectionery Volume (K) Forecast, by Application 2020 & 2033
- Table 71: Rest of Middle East & Africa Sugar Confectionery Revenue (undefined) Forecast, by Application 2020 & 2033
- Table 72: Rest of Middle East & Africa Sugar Confectionery Volume (K) Forecast, by Application 2020 & 2033
- Table 73: Global Sugar Confectionery Revenue undefined Forecast, by Application 2020 & 2033
- Table 74: Global Sugar Confectionery Volume K Forecast, by Application 2020 & 2033
- Table 75: Global Sugar Confectionery Revenue undefined Forecast, by Type 2020 & 2033
- Table 76: Global Sugar Confectionery Volume K Forecast, by Type 2020 & 2033
- Table 77: Global Sugar Confectionery Revenue undefined Forecast, by Country 2020 & 2033
- Table 78: Global Sugar Confectionery Volume K Forecast, by Country 2020 & 2033
- Table 79: China Sugar Confectionery Revenue (undefined) Forecast, by Application 2020 & 2033
- Table 80: China Sugar Confectionery Volume (K) Forecast, by Application 2020 & 2033
- Table 81: India Sugar Confectionery Revenue (undefined) Forecast, by Application 2020 & 2033
- Table 82: India Sugar Confectionery Volume (K) Forecast, by Application 2020 & 2033
- Table 83: Japan Sugar Confectionery Revenue (undefined) Forecast, by Application 2020 & 2033
- Table 84: Japan Sugar Confectionery Volume (K) Forecast, by Application 2020 & 2033
- Table 85: South Korea Sugar Confectionery Revenue (undefined) Forecast, by Application 2020 & 2033
- Table 86: South Korea Sugar Confectionery Volume (K) Forecast, by Application 2020 & 2033
- Table 87: ASEAN Sugar Confectionery Revenue (undefined) Forecast, by Application 2020 & 2033
- Table 88: ASEAN Sugar Confectionery Volume (K) Forecast, by Application 2020 & 2033
- Table 89: Oceania Sugar Confectionery Revenue (undefined) Forecast, by Application 2020 & 2033
- Table 90: Oceania Sugar Confectionery Volume (K) Forecast, by Application 2020 & 2033
- Table 91: Rest of Asia Pacific Sugar Confectionery Revenue (undefined) Forecast, by Application 2020 & 2033
- Table 92: Rest of Asia Pacific Sugar Confectionery Volume (K) Forecast, by Application 2020 & 2033
Frequently Asked Questions
1. What is the projected Compound Annual Growth Rate (CAGR) of the Sugar Confectionery?
The projected CAGR is approximately 4.7%.
2. Which companies are prominent players in the Sugar Confectionery?
Key companies in the market include Ferrara Candy, HARIBO, Mondelez International, Nestle, Perfetti Van Melle, Wrigley, Adams and Brooks Candy, American Licorice, Anthony-Thomas Candy.
3. What are the main segments of the Sugar Confectionery?
The market segments include Application, Type.
4. Can you provide details about the market size?
The market size is estimated to be USD XXX N/A as of 2022.
5. What are some drivers contributing to market growth?
N/A
6. What are the notable trends driving market growth?
N/A
7. Are there any restraints impacting market growth?
N/A
8. Can you provide examples of recent developments in the market?
N/A
9. What pricing options are available for accessing the report?
Pricing options include single-user, multi-user, and enterprise licenses priced at USD 3950.00, USD 5925.00, and USD 7900.00 respectively.
10. Is the market size provided in terms of value or volume?
The market size is provided in terms of value, measured in N/A and volume, measured in K.
11. Are there any specific market keywords associated with the report?
Yes, the market keyword associated with the report is "Sugar Confectionery," which aids in identifying and referencing the specific market segment covered.
12. How do I determine which pricing option suits my needs best?
The pricing options vary based on user requirements and access needs. Individual users may opt for single-user licenses, while businesses requiring broader access may choose multi-user or enterprise licenses for cost-effective access to the report.
13. Are there any additional resources or data provided in the Sugar Confectionery report?
While the report offers comprehensive insights, it's advisable to review the specific contents or supplementary materials provided to ascertain if additional resources or data are available.
14. How can I stay updated on further developments or reports in the Sugar Confectionery?
To stay informed about further developments, trends, and reports in the Sugar Confectionery, consider subscribing to industry newsletters, following relevant companies and organizations, or regularly checking reputable industry news sources and publications.
Methodology
Step 1 - Identification of Relevant Samples Size from Population Database


Step 2 - Approaches for Defining Global Market Size (Value, Volume* & Price*)

Note*: In applicable scenarios
Step 3 - Data Sources
Primary Research
- Web Analytics
- Survey Reports
- Research Institute
- Latest Research Reports
- Opinion Leaders
Secondary Research
- Annual Reports
- White Paper
- Latest Press Release
- Industry Association
- Paid Database
- Investor Presentations

Step 4 - Data Triangulation
Involves using different sources of information in order to increase the validity of a study
These sources are likely to be stakeholders in a program - participants, other researchers, program staff, other community members, and so on.
Then we put all data in single framework & apply various statistical tools to find out the dynamic on the market.
During the analysis stage, feedback from the stakeholder groups would be compared to determine areas of agreement as well as areas of divergence