

Key Insights
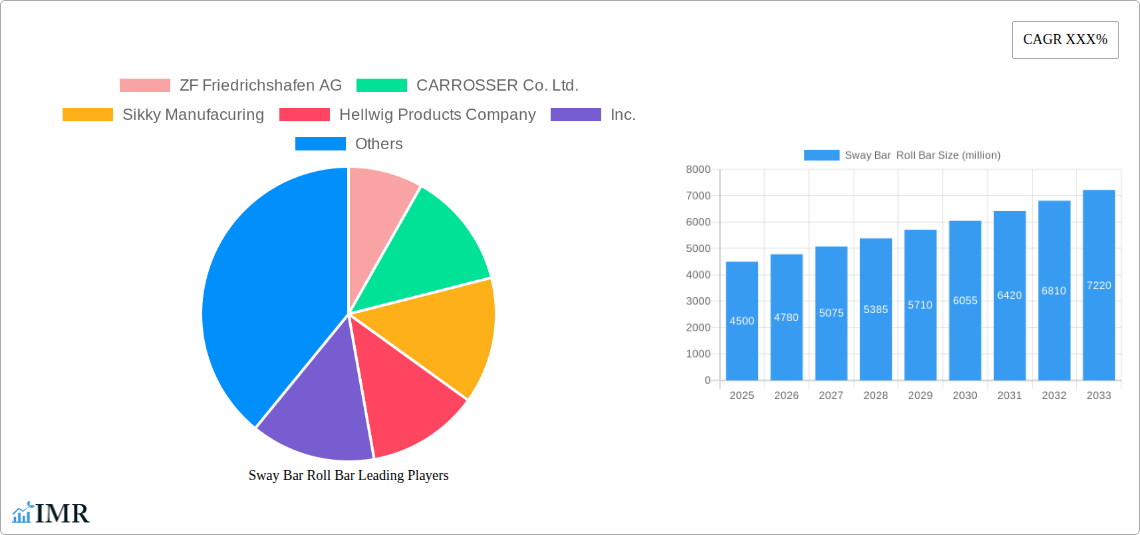
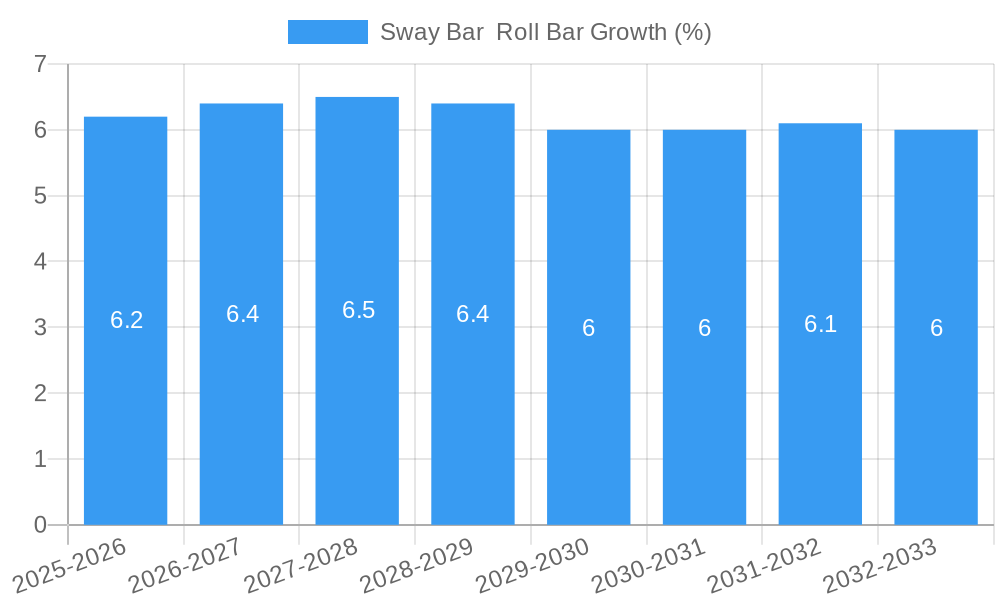
The global Sway Bar Roll Bar market is experiencing robust growth, driven by an increasing emphasis on vehicle handling, stability, and safety across both OEM and aftermarket segments. With a projected market size of approximately USD 4,500 million in 2025, the market is anticipated to expand at a Compound Annual Growth Rate (CAGR) of around 6.5% through 2033. This sustained growth is largely fueled by advancements in automotive technology, leading to more sophisticated suspension systems. The rising demand for performance-oriented vehicles, coupled with the aftermarket desire for enhanced driving dynamics and customization, significantly contributes to market expansion. Furthermore, stringent safety regulations and consumer awareness regarding vehicle stability, particularly in SUVs and performance cars, are pivotal drivers. The increasing adoption of active sway bar systems, which offer dynamic adjustment for optimal handling in various driving conditions, is a key trend reshaping the market. These systems provide a superior driving experience and improved safety, making them increasingly attractive to both manufacturers and end-users.
Despite the positive growth trajectory, the market faces certain restraints, including the initial cost of advanced sway bar systems, particularly active ones, which can impact their widespread adoption in budget-conscious segments. Additionally, the complexity of installation and the need for specialized expertise for certain aftermarket applications might pose a challenge. However, the increasing production of vehicles globally and the continuous innovation by key players like ZF Friedrichshafen AG, Mubea, and Hellwig Products Company, Inc., are expected to mitigate these restraints. The market is characterized by a competitive landscape with a mix of established global players and regional specialists catering to diverse customer needs. Geographic segmentation indicates a strong presence in North America and Europe, driven by a high concentration of automotive manufacturing and a strong aftermarket culture. Asia Pacific, particularly China and India, represents a significant growth opportunity due to the rapidly expanding automotive sector and increasing consumer spending on vehicle enhancements.
Sway Bar Roll Bar Market Dynamics & Structure
The global Sway Bar Roll Bar market exhibits a moderately concentrated structure, with key players like ZF Friedrichshafen AG, CARROSSER Co. Ltd., and Mubea holding significant influence. Technological innovation is a primary driver, with advancements in materials science leading to lighter and stronger sway bars, enhancing vehicle handling and performance. Regulatory frameworks, particularly those focused on vehicle safety and emissions, indirectly influence sway bar development by promoting efficient chassis design. Competitive product substitutes include advanced suspension systems that offer similar handling benefits, albeit at a higher cost. End-user demographics are segmented, with performance enthusiasts and motorsport participants forming a significant aftermarket segment, while OEM applications cater to mass-market vehicles seeking improved stability. Mergers and acquisitions (M&A) trends indicate a consolidation phase, with larger entities acquiring innovative smaller players to expand their product portfolios and market reach. For instance, the acquisition of niche performance component manufacturers by larger automotive suppliers has been observed. Innovation barriers include the high cost of R&D for advanced materials and the long lead times required for OEM integration.
- Market Concentration: Moderate, with top 5 players estimated to hold 35-45% of the global market share.
- Technological Innovation Drivers: Lightweight materials (e.g., carbon fiber composites), active sway bar technology, and integrated sensor systems for adaptive control.
- Regulatory Frameworks: Primarily influenced by vehicle safety standards and performance enhancement regulations.
- Competitive Product Substitutes: Advanced adaptive dampers, active anti-roll suspension systems, and sophisticated chassis tuning.
- End-User Demographics: Aftermarket: Performance tuning enthusiasts, off-roaders, racing teams. OEM: Passenger cars, SUVs, performance vehicles, commercial vehicles.
- M&A Trends: Acquisition of specialty manufacturers by Tier-1 suppliers, strategic alliances for technology development.
Sway Bar Roll Bar Growth Trends & Insights
The Sway Bar Roll Bar market is projected to experience robust growth throughout the forecast period of 2025–2033, driven by an increasing consumer demand for enhanced vehicle performance, handling, and safety. The Sway Bar Roll Bar market size is estimated to reach approximately $3.2 billion in 2025, with a projected Compound Annual Growth Rate (CAGR) of 5.8% over the forecast period. This expansion is fueled by evolving consumer preferences towards sportier and more agile vehicles, even in segments traditionally focused on comfort. The aftermarket segment, in particular, is witnessing accelerated adoption rates as performance enthusiasts seek to upgrade their vehicles' dynamic capabilities. Technological disruptions, such as the development of active sway bar systems that dynamically adjust stiffness based on driving conditions, are a significant growth catalyst. These systems, often integrated with advanced electronic control units, offer a superior driving experience by minimizing body roll in corners while allowing for greater articulation on uneven terrain. Consumer behavior shifts are also playing a crucial role, with a growing awareness among vehicle owners about the benefits of sway bars for improved stability, tire wear reduction, and overall driving pleasure.
The automotive aftermarket sway bar segment is expected to outpace OEM applications in terms of growth rate, owing to the accessibility and affordability of aftermarket upgrades for a wider range of vehicles. Furthermore, the increasing popularity of motorsports and track day events globally provides a substantial impetus for the demand for high-performance sway bar solutions. The ongoing trend of vehicle customization further bolsters the aftermarket, as consumers actively seek components that enhance both aesthetics and performance. The integration of lightweight materials like high-strength steel alloys and composite materials in sway bar manufacturing is a key technological advancement that contributes to weight reduction and improved vehicle efficiency, aligning with broader automotive industry trends. The passive sway bar segment, while mature, continues to see steady demand due to its cost-effectiveness and proven reliability. However, the rapid innovation and performance benefits offered by active systems are gradually capturing market share. The roll bar for automotive application is also experiencing a significant uptick in demand due to rising safety consciousness, especially in performance-oriented vehicles. This report provides in-depth analysis of the market penetration of both active and passive sway bars, offering granular insights into regional adoption patterns and future growth trajectories, leveraging proprietary data and advanced analytical models to deliver accurate market size estimations and CAGR forecasts. The performance sway bar segment is a key focus, with detailed segmentation by vehicle type and performance application.
Dominant Regions, Countries, or Segments in Sway Bar Roll Bar
The Sway Bar Roll Bar market is experiencing robust growth across various regions, with North America currently holding a dominant position, projected to account for approximately 38% of the global market share in 2025. This dominance is attributed to several key factors: a mature automotive industry with a high vehicle parc, a strong aftermarket culture emphasizing performance upgrades, and a significant concentration of automotive manufacturers. The United States, in particular, is a major contributor, driven by a strong demand for SUVs and pickup trucks, where sway bars are crucial for enhancing stability and reducing body roll. The aftermarket segment within North America is exceptionally strong, with consumers actively investing in vehicle modifications to improve handling and aesthetics. This segment is projected to grow at a CAGR of 6.2% from 2025 to 2033.
North America: Leading region due to a high volume of vehicle sales, a robust aftermarket culture, and a strong presence of performance tuning enthusiasts.
- Key Drivers: High disposable income, prevalence of performance vehicles and trucks, favorable regulatory environment for aftermarket modifications, strong aftermarket retail infrastructure.
- Market Share (Estimated 2025): 38%
- Growth Potential: High, driven by ongoing vehicle parc expansion and increasing demand for handling upgrades.
Europe: The second-largest market, driven by a strong OEM presence and increasing consumer interest in dynamic vehicle performance. Countries like Germany, with its automotive powerhouse status and renowned performance vehicle manufacturers, are key contributors. The demand for performance sway bar solutions is growing as emissions regulations push for lighter and more efficient vehicles, where optimized chassis components play a vital role. The aftermarket in Europe is also gaining traction, though it is more fragmented than in North America.
- Key Drivers: Strong OEM manufacturing base, increasing adoption of performance-oriented vehicles, growing demand for aftermarket upgrades, stringent safety regulations promoting chassis stability.
- Market Share (Estimated 2025): 30%
- Growth Potential: Moderate to High, influenced by economic conditions and evolving consumer preferences for sporty driving dynamics.
Asia Pacific: This region is emerging as a significant growth engine, driven by the rapidly expanding automotive industry in countries like China and India. Increasing disposable incomes, a growing middle class, and a burgeoning demand for SUVs and passenger cars are fueling the adoption of sway bars, both in OEM and aftermarket applications. The active sway bar segment is expected to see substantial growth in this region as advanced vehicle technologies become more accessible.
- Key Drivers: Rapidly expanding automotive production, increasing vehicle ownership, growing middle class with higher disposable incomes, rising interest in vehicle customization and performance.
- Market Share (Estimated 2025): 25%
- Growth Potential: Very High, expected to be the fastest-growing region over the forecast period.
Within segments, the Aftermarket application is expected to dominate in terms of growth rate due to its accessibility and consumer-driven demand for performance enhancements. The OEM segment, while larger in absolute volume, will see steady growth driven by manufacturers integrating sway bars as standard features for improved vehicle dynamics. The Passive Sway Bar type remains the volume leader due to its cost-effectiveness, but the Active Sway Bar segment is projected for the highest CAGR, reflecting technological advancements and a growing appetite for sophisticated vehicle control.
Sway Bar Roll Bar Product Landscape
The Sway Bar Roll Bar product landscape is characterized by continuous innovation focused on enhancing vehicle handling, stability, and driver experience. Manufacturers are developing advanced solutions utilizing lightweight materials like high-strength steel alloys and carbon fiber composites to reduce unsprung weight and improve performance. Product innovations include adjustable sway bars that allow users to fine-tune stiffness for different driving conditions and terrains. Furthermore, the integration of electronic control systems in active sway bar systems offers dynamic adjustment of roll stiffness, providing optimal performance during cornering and minimizing body roll. These advancements cater to both the OEM market, where manufacturers are integrating sway bars for superior ride and handling, and the aftermarket, where performance enthusiasts seek to upgrade their vehicles for enhanced dynamic capabilities. Companies like Whiteline USA and Hellwig Products Company, Inc. are prominent in offering a wide range of performance-oriented sway bar kits.
Key Drivers, Barriers & Challenges in Sway Bar Roll Bar
Key Drivers:
- Growing demand for enhanced vehicle performance and handling: Consumers are increasingly seeking improved driving dynamics, leading to higher demand for sway bars.
- Rise of the automotive aftermarket: The strong aftermarket culture, particularly in performance tuning, fuels the demand for upgradeable sway bar components.
- Technological advancements in materials and design: Development of lighter, stronger, and more adjustable sway bars drives innovation and market growth.
- Increasing popularity of SUVs and performance vehicles: These vehicle segments often benefit significantly from sway bar upgrades for improved stability.
Barriers & Challenges:
- High cost of advanced materials and manufacturing: Innovations in lightweight and active sway bars can lead to higher production costs.
- Perceived complexity of installation and tuning: Some aftermarket sway bar systems may require specialized knowledge for installation and adjustment.
- Economic downturns impacting consumer discretionary spending: Vehicle upgrades, especially aftermarket parts, can be sensitive to economic fluctuations.
- Competition from integrated suspension systems: Advanced integrated suspension technologies can offer similar handling benefits, posing a competitive threat.
- Supply chain disruptions and raw material price volatility: Global supply chain issues can impact the availability and cost of key components and raw materials. For instance, a 10-15% fluctuation in steel prices can directly impact manufacturing costs.
Emerging Opportunities in Sway Bar Roll Bar
Emerging opportunities in the Sway Bar Roll Bar market are primarily driven by the continued evolution of vehicle technology and consumer preferences. The increasing adoption of electric vehicles (EVs) presents a significant opportunity, as their lower center of gravity and higher torque often necessitate advanced chassis control systems, including sophisticated sway bar solutions for optimal handling and battery range management. The development of integrated active sway bar systems specifically designed for EV platforms, offering precise control and weight savings, is a key growth avenue. Furthermore, the expansion of the off-road and overlanding segment creates demand for robust and adaptable sway bars that can improve vehicle stability on uneven terrain while maintaining articulation. Untapped markets in developing economies, with their rapidly growing automotive sectors, also represent substantial potential. The trend towards vehicle customization and personalization continues to drive demand for a wide array of aftermarket sway bar products, from adjustable kits to specialized designs for specific vehicle applications.
Growth Accelerators in the Sway Bar Roll Bar Industry
The Sway Bar Roll Bar industry is propelled by several growth accelerators that are shaping its long-term trajectory. Technological breakthroughs in materials science, such as the increasing use of advanced alloys and composites, are enabling the development of lighter, stronger, and more durable sway bars, thereby enhancing vehicle performance and efficiency. Strategic partnerships between sway bar manufacturers and automotive OEMs are crucial for integrating these components into new vehicle platforms, driving adoption and establishing market presence. Furthermore, market expansion strategies, including entry into emerging economies and targeted marketing campaigns aimed at performance enthusiasts, are vital for capturing new customer bases. The continuous innovation in active sway bar technology, offering dynamic adjustment capabilities, is a major accelerator, appealing to consumers seeking advanced vehicle dynamics. The increasing participation in motorsports and track days globally also fuels demand for high-performance sway bar solutions.
Key Players Shaping the Sway Bar Roll Bar Market
- ZF Friedrichshafen AG
- CARROSSER Co. Ltd.
- Sikky Manufacuring
- Hellwig Products Company, Inc.
- Tanabe USA Inc.
- Whiteline USA
- ADDCO Manufacturing Company, Inc.
- Mubea
- Swaytec Co. Ltd.
- Nengun Co. Ltd.
- TSL Turton Ltd.
- Ridetech
- MOOG
- Alta Performance
- Superpro Europe Ltd.
Notable Milestones in Sway Bar Roll Bar Sector
- 2019: Introduction of advanced composite materials for lighter and stronger sway bars by several leading manufacturers, improving vehicle weight and fuel efficiency.
- 2020: Increased OEM adoption of active sway bar systems in premium performance vehicles, enhancing handling and driver comfort.
- 2021: Significant growth in the aftermarket segment driven by a surge in vehicle customization and performance tuning activities globally.
- 2022: Launch of highly adjustable sway bar kits catering to specific vehicle models and driving conditions by key aftermarket players.
- 2023: Increased focus on integrated sensor technology for active sway bars, enabling more precise and responsive dynamic adjustments.
- 2024: Emerging trend of developing specialized sway bar solutions for electric vehicles to address their unique handling characteristics and weight distribution.
In-Depth Sway Bar Roll Bar Market Outlook
The Sway Bar Roll Bar market is poised for sustained growth, driven by ongoing technological advancements and evolving consumer demand for enhanced vehicle performance and safety. The increasing integration of active sway bar technology in both OEM and aftermarket applications, coupled with the growing popularity of performance vehicles and motorsports, will continue to be significant growth catalysts. The expanding automotive sector in emerging economies presents a substantial opportunity for market penetration and expansion. Furthermore, the development of specialized sway bar solutions for electric vehicles is expected to unlock new avenues of growth. Strategic collaborations, product diversification, and a focus on innovation in materials and control systems will be critical for key players to capitalize on the market's future potential and maintain a competitive edge in the dynamic automotive landscape.
Sway Bar Roll Bar Segmentation
-
1. Application
- 1.1. OEM
- 1.2. Aftermarket
-
2. Type
- 2.1. Active Sway Bar
- 2.2. Passive Sway Bar
Sway Bar Roll Bar Segmentation By Geography
-
1. North America
- 1.1. United States
- 1.2. Canada
- 1.3. Mexico
-
2. South America
- 2.1. Brazil
- 2.2. Argentina
- 2.3. Rest of South America
-
3. Europe
- 3.1. United Kingdom
- 3.2. Germany
- 3.3. France
- 3.4. Italy
- 3.5. Spain
- 3.6. Russia
- 3.7. Benelux
- 3.8. Nordics
- 3.9. Rest of Europe
-
4. Middle East & Africa
- 4.1. Turkey
- 4.2. Israel
- 4.3. GCC
- 4.4. North Africa
- 4.5. South Africa
- 4.6. Rest of Middle East & Africa
-
5. Asia Pacific
- 5.1. China
- 5.2. India
- 5.3. Japan
- 5.4. South Korea
- 5.5. ASEAN
- 5.6. Oceania
- 5.7. Rest of Asia Pacific

Sway Bar Roll Bar REPORT HIGHLIGHTS
| Aspects | Details |
|---|---|
| Study Period | 2019-2033 |
| Base Year | 2024 |
| Estimated Year | 2025 |
| Forecast Period | 2025-2033 |
| Historical Period | 2019-2024 |
| Growth Rate | CAGR of XXX% from 2019-2033 |
| Segmentation |
|
Table of Contents
- 1. Introduction
- 1.1. Research Scope
- 1.2. Market Segmentation
- 1.3. Research Methodology
- 1.4. Definitions and Assumptions
- 2. Executive Summary
- 2.1. Introduction
- 3. Market Dynamics
- 3.1. Introduction
- 3.2. Market Drivers
- 3.3. Market Restrains
- 3.4. Market Trends
- 4. Market Factor Analysis
- 4.1. Porters Five Forces
- 4.2. Supply/Value Chain
- 4.3. PESTEL analysis
- 4.4. Market Entropy
- 4.5. Patent/Trademark Analysis
- 5. Global Sway Bar Roll Bar Analysis, Insights and Forecast, 2019-2031
- 5.1. Market Analysis, Insights and Forecast - by Application
- 5.1.1. OEM
- 5.1.2. Aftermarket
- 5.2. Market Analysis, Insights and Forecast - by Type
- 5.2.1. Active Sway Bar
- 5.2.2. Passive Sway Bar
- 5.3. Market Analysis, Insights and Forecast - by Region
- 5.3.1. North America
- 5.3.2. South America
- 5.3.3. Europe
- 5.3.4. Middle East & Africa
- 5.3.5. Asia Pacific
- 5.1. Market Analysis, Insights and Forecast - by Application
- 6. North America Sway Bar Roll Bar Analysis, Insights and Forecast, 2019-2031
- 6.1. Market Analysis, Insights and Forecast - by Application
- 6.1.1. OEM
- 6.1.2. Aftermarket
- 6.2. Market Analysis, Insights and Forecast - by Type
- 6.2.1. Active Sway Bar
- 6.2.2. Passive Sway Bar
- 6.1. Market Analysis, Insights and Forecast - by Application
- 7. South America Sway Bar Roll Bar Analysis, Insights and Forecast, 2019-2031
- 7.1. Market Analysis, Insights and Forecast - by Application
- 7.1.1. OEM
- 7.1.2. Aftermarket
- 7.2. Market Analysis, Insights and Forecast - by Type
- 7.2.1. Active Sway Bar
- 7.2.2. Passive Sway Bar
- 7.1. Market Analysis, Insights and Forecast - by Application
- 8. Europe Sway Bar Roll Bar Analysis, Insights and Forecast, 2019-2031
- 8.1. Market Analysis, Insights and Forecast - by Application
- 8.1.1. OEM
- 8.1.2. Aftermarket
- 8.2. Market Analysis, Insights and Forecast - by Type
- 8.2.1. Active Sway Bar
- 8.2.2. Passive Sway Bar
- 8.1. Market Analysis, Insights and Forecast - by Application
- 9. Middle East & Africa Sway Bar Roll Bar Analysis, Insights and Forecast, 2019-2031
- 9.1. Market Analysis, Insights and Forecast - by Application
- 9.1.1. OEM
- 9.1.2. Aftermarket
- 9.2. Market Analysis, Insights and Forecast - by Type
- 9.2.1. Active Sway Bar
- 9.2.2. Passive Sway Bar
- 9.1. Market Analysis, Insights and Forecast - by Application
- 10. Asia Pacific Sway Bar Roll Bar Analysis, Insights and Forecast, 2019-2031
- 10.1. Market Analysis, Insights and Forecast - by Application
- 10.1.1. OEM
- 10.1.2. Aftermarket
- 10.2. Market Analysis, Insights and Forecast - by Type
- 10.2.1. Active Sway Bar
- 10.2.2. Passive Sway Bar
- 10.1. Market Analysis, Insights and Forecast - by Application
- 11. Competitive Analysis
- 11.1. Global Market Share Analysis 2024
- 11.2. Company Profiles
- 11.2.1 ZF Friedrichshafen AG
- 11.2.1.1. Overview
- 11.2.1.2. Products
- 11.2.1.3. SWOT Analysis
- 11.2.1.4. Recent Developments
- 11.2.1.5. Financials (Based on Availability)
- 11.2.2 CARROSSER Co. Ltd.
- 11.2.2.1. Overview
- 11.2.2.2. Products
- 11.2.2.3. SWOT Analysis
- 11.2.2.4. Recent Developments
- 11.2.2.5. Financials (Based on Availability)
- 11.2.3 Sikky Manufacuring
- 11.2.3.1. Overview
- 11.2.3.2. Products
- 11.2.3.3. SWOT Analysis
- 11.2.3.4. Recent Developments
- 11.2.3.5. Financials (Based on Availability)
- 11.2.4 Hellwig Products Company
- 11.2.4.1. Overview
- 11.2.4.2. Products
- 11.2.4.3. SWOT Analysis
- 11.2.4.4. Recent Developments
- 11.2.4.5. Financials (Based on Availability)
- 11.2.5 Inc.
- 11.2.5.1. Overview
- 11.2.5.2. Products
- 11.2.5.3. SWOT Analysis
- 11.2.5.4. Recent Developments
- 11.2.5.5. Financials (Based on Availability)
- 11.2.6 Tanabe USA Inc.
- 11.2.6.1. Overview
- 11.2.6.2. Products
- 11.2.6.3. SWOT Analysis
- 11.2.6.4. Recent Developments
- 11.2.6.5. Financials (Based on Availability)
- 11.2.7 Whiteline USA
- 11.2.7.1. Overview
- 11.2.7.2. Products
- 11.2.7.3. SWOT Analysis
- 11.2.7.4. Recent Developments
- 11.2.7.5. Financials (Based on Availability)
- 11.2.8 ADDCO Manufacturing Company
- 11.2.8.1. Overview
- 11.2.8.2. Products
- 11.2.8.3. SWOT Analysis
- 11.2.8.4. Recent Developments
- 11.2.8.5. Financials (Based on Availability)
- 11.2.9 Inc.
- 11.2.9.1. Overview
- 11.2.9.2. Products
- 11.2.9.3. SWOT Analysis
- 11.2.9.4. Recent Developments
- 11.2.9.5. Financials (Based on Availability)
- 11.2.10 Mubea
- 11.2.10.1. Overview
- 11.2.10.2. Products
- 11.2.10.3. SWOT Analysis
- 11.2.10.4. Recent Developments
- 11.2.10.5. Financials (Based on Availability)
- 11.2.11 Swaytec Co. Ltd.
- 11.2.11.1. Overview
- 11.2.11.2. Products
- 11.2.11.3. SWOT Analysis
- 11.2.11.4. Recent Developments
- 11.2.11.5. Financials (Based on Availability)
- 11.2.12 Nengun Co. Ltd.
- 11.2.12.1. Overview
- 11.2.12.2. Products
- 11.2.12.3. SWOT Analysis
- 11.2.12.4. Recent Developments
- 11.2.12.5. Financials (Based on Availability)
- 11.2.13 TSL Turton Ltd.
- 11.2.13.1. Overview
- 11.2.13.2. Products
- 11.2.13.3. SWOT Analysis
- 11.2.13.4. Recent Developments
- 11.2.13.5. Financials (Based on Availability)
- 11.2.14 Ridetech
- 11.2.14.1. Overview
- 11.2.14.2. Products
- 11.2.14.3. SWOT Analysis
- 11.2.14.4. Recent Developments
- 11.2.14.5. Financials (Based on Availability)
- 11.2.15 MOOG
- 11.2.15.1. Overview
- 11.2.15.2. Products
- 11.2.15.3. SWOT Analysis
- 11.2.15.4. Recent Developments
- 11.2.15.5. Financials (Based on Availability)
- 11.2.16 Alta Performance
- 11.2.16.1. Overview
- 11.2.16.2. Products
- 11.2.16.3. SWOT Analysis
- 11.2.16.4. Recent Developments
- 11.2.16.5. Financials (Based on Availability)
- 11.2.17 Superpro Europe Ltd.
- 11.2.17.1. Overview
- 11.2.17.2. Products
- 11.2.17.3. SWOT Analysis
- 11.2.17.4. Recent Developments
- 11.2.17.5. Financials (Based on Availability)
- 11.2.1 ZF Friedrichshafen AG
List of Figures
- Figure 1: Global Sway Bar Roll Bar Revenue Breakdown (million, %) by Region 2024 & 2032
- Figure 2: North America Sway Bar Roll Bar Revenue (million), by Application 2024 & 2032
- Figure 3: North America Sway Bar Roll Bar Revenue Share (%), by Application 2024 & 2032
- Figure 4: North America Sway Bar Roll Bar Revenue (million), by Type 2024 & 2032
- Figure 5: North America Sway Bar Roll Bar Revenue Share (%), by Type 2024 & 2032
- Figure 6: North America Sway Bar Roll Bar Revenue (million), by Country 2024 & 2032
- Figure 7: North America Sway Bar Roll Bar Revenue Share (%), by Country 2024 & 2032
- Figure 8: South America Sway Bar Roll Bar Revenue (million), by Application 2024 & 2032
- Figure 9: South America Sway Bar Roll Bar Revenue Share (%), by Application 2024 & 2032
- Figure 10: South America Sway Bar Roll Bar Revenue (million), by Type 2024 & 2032
- Figure 11: South America Sway Bar Roll Bar Revenue Share (%), by Type 2024 & 2032
- Figure 12: South America Sway Bar Roll Bar Revenue (million), by Country 2024 & 2032
- Figure 13: South America Sway Bar Roll Bar Revenue Share (%), by Country 2024 & 2032
- Figure 14: Europe Sway Bar Roll Bar Revenue (million), by Application 2024 & 2032
- Figure 15: Europe Sway Bar Roll Bar Revenue Share (%), by Application 2024 & 2032
- Figure 16: Europe Sway Bar Roll Bar Revenue (million), by Type 2024 & 2032
- Figure 17: Europe Sway Bar Roll Bar Revenue Share (%), by Type 2024 & 2032
- Figure 18: Europe Sway Bar Roll Bar Revenue (million), by Country 2024 & 2032
- Figure 19: Europe Sway Bar Roll Bar Revenue Share (%), by Country 2024 & 2032
- Figure 20: Middle East & Africa Sway Bar Roll Bar Revenue (million), by Application 2024 & 2032
- Figure 21: Middle East & Africa Sway Bar Roll Bar Revenue Share (%), by Application 2024 & 2032
- Figure 22: Middle East & Africa Sway Bar Roll Bar Revenue (million), by Type 2024 & 2032
- Figure 23: Middle East & Africa Sway Bar Roll Bar Revenue Share (%), by Type 2024 & 2032
- Figure 24: Middle East & Africa Sway Bar Roll Bar Revenue (million), by Country 2024 & 2032
- Figure 25: Middle East & Africa Sway Bar Roll Bar Revenue Share (%), by Country 2024 & 2032
- Figure 26: Asia Pacific Sway Bar Roll Bar Revenue (million), by Application 2024 & 2032
- Figure 27: Asia Pacific Sway Bar Roll Bar Revenue Share (%), by Application 2024 & 2032
- Figure 28: Asia Pacific Sway Bar Roll Bar Revenue (million), by Type 2024 & 2032
- Figure 29: Asia Pacific Sway Bar Roll Bar Revenue Share (%), by Type 2024 & 2032
- Figure 30: Asia Pacific Sway Bar Roll Bar Revenue (million), by Country 2024 & 2032
- Figure 31: Asia Pacific Sway Bar Roll Bar Revenue Share (%), by Country 2024 & 2032
List of Tables
- Table 1: Global Sway Bar Roll Bar Revenue million Forecast, by Region 2019 & 2032
- Table 2: Global Sway Bar Roll Bar Revenue million Forecast, by Application 2019 & 2032
- Table 3: Global Sway Bar Roll Bar Revenue million Forecast, by Type 2019 & 2032
- Table 4: Global Sway Bar Roll Bar Revenue million Forecast, by Region 2019 & 2032
- Table 5: Global Sway Bar Roll Bar Revenue million Forecast, by Application 2019 & 2032
- Table 6: Global Sway Bar Roll Bar Revenue million Forecast, by Type 2019 & 2032
- Table 7: Global Sway Bar Roll Bar Revenue million Forecast, by Country 2019 & 2032
- Table 8: United States Sway Bar Roll Bar Revenue (million) Forecast, by Application 2019 & 2032
- Table 9: Canada Sway Bar Roll Bar Revenue (million) Forecast, by Application 2019 & 2032
- Table 10: Mexico Sway Bar Roll Bar Revenue (million) Forecast, by Application 2019 & 2032
- Table 11: Global Sway Bar Roll Bar Revenue million Forecast, by Application 2019 & 2032
- Table 12: Global Sway Bar Roll Bar Revenue million Forecast, by Type 2019 & 2032
- Table 13: Global Sway Bar Roll Bar Revenue million Forecast, by Country 2019 & 2032
- Table 14: Brazil Sway Bar Roll Bar Revenue (million) Forecast, by Application 2019 & 2032
- Table 15: Argentina Sway Bar Roll Bar Revenue (million) Forecast, by Application 2019 & 2032
- Table 16: Rest of South America Sway Bar Roll Bar Revenue (million) Forecast, by Application 2019 & 2032
- Table 17: Global Sway Bar Roll Bar Revenue million Forecast, by Application 2019 & 2032
- Table 18: Global Sway Bar Roll Bar Revenue million Forecast, by Type 2019 & 2032
- Table 19: Global Sway Bar Roll Bar Revenue million Forecast, by Country 2019 & 2032
- Table 20: United Kingdom Sway Bar Roll Bar Revenue (million) Forecast, by Application 2019 & 2032
- Table 21: Germany Sway Bar Roll Bar Revenue (million) Forecast, by Application 2019 & 2032
- Table 22: France Sway Bar Roll Bar Revenue (million) Forecast, by Application 2019 & 2032
- Table 23: Italy Sway Bar Roll Bar Revenue (million) Forecast, by Application 2019 & 2032
- Table 24: Spain Sway Bar Roll Bar Revenue (million) Forecast, by Application 2019 & 2032
- Table 25: Russia Sway Bar Roll Bar Revenue (million) Forecast, by Application 2019 & 2032
- Table 26: Benelux Sway Bar Roll Bar Revenue (million) Forecast, by Application 2019 & 2032
- Table 27: Nordics Sway Bar Roll Bar Revenue (million) Forecast, by Application 2019 & 2032
- Table 28: Rest of Europe Sway Bar Roll Bar Revenue (million) Forecast, by Application 2019 & 2032
- Table 29: Global Sway Bar Roll Bar Revenue million Forecast, by Application 2019 & 2032
- Table 30: Global Sway Bar Roll Bar Revenue million Forecast, by Type 2019 & 2032
- Table 31: Global Sway Bar Roll Bar Revenue million Forecast, by Country 2019 & 2032
- Table 32: Turkey Sway Bar Roll Bar Revenue (million) Forecast, by Application 2019 & 2032
- Table 33: Israel Sway Bar Roll Bar Revenue (million) Forecast, by Application 2019 & 2032
- Table 34: GCC Sway Bar Roll Bar Revenue (million) Forecast, by Application 2019 & 2032
- Table 35: North Africa Sway Bar Roll Bar Revenue (million) Forecast, by Application 2019 & 2032
- Table 36: South Africa Sway Bar Roll Bar Revenue (million) Forecast, by Application 2019 & 2032
- Table 37: Rest of Middle East & Africa Sway Bar Roll Bar Revenue (million) Forecast, by Application 2019 & 2032
- Table 38: Global Sway Bar Roll Bar Revenue million Forecast, by Application 2019 & 2032
- Table 39: Global Sway Bar Roll Bar Revenue million Forecast, by Type 2019 & 2032
- Table 40: Global Sway Bar Roll Bar Revenue million Forecast, by Country 2019 & 2032
- Table 41: China Sway Bar Roll Bar Revenue (million) Forecast, by Application 2019 & 2032
- Table 42: India Sway Bar Roll Bar Revenue (million) Forecast, by Application 2019 & 2032
- Table 43: Japan Sway Bar Roll Bar Revenue (million) Forecast, by Application 2019 & 2032
- Table 44: South Korea Sway Bar Roll Bar Revenue (million) Forecast, by Application 2019 & 2032
- Table 45: ASEAN Sway Bar Roll Bar Revenue (million) Forecast, by Application 2019 & 2032
- Table 46: Oceania Sway Bar Roll Bar Revenue (million) Forecast, by Application 2019 & 2032
- Table 47: Rest of Asia Pacific Sway Bar Roll Bar Revenue (million) Forecast, by Application 2019 & 2032
Frequently Asked Questions
1. What is the projected Compound Annual Growth Rate (CAGR) of the Sway Bar Roll Bar?
The projected CAGR is approximately XXX%.
2. Which companies are prominent players in the Sway Bar Roll Bar?
Key companies in the market include ZF Friedrichshafen AG, CARROSSER Co. Ltd., Sikky Manufacuring, Hellwig Products Company, Inc., Tanabe USA Inc., Whiteline USA, ADDCO Manufacturing Company, Inc., Mubea, Swaytec Co. Ltd., Nengun Co. Ltd., TSL Turton Ltd., Ridetech, MOOG, Alta Performance, Superpro Europe Ltd..
3. What are the main segments of the Sway Bar Roll Bar?
The market segments include Application, Type.
4. Can you provide details about the market size?
The market size is estimated to be USD XXX million as of 2022.
5. What are some drivers contributing to market growth?
N/A
6. What are the notable trends driving market growth?
N/A
7. Are there any restraints impacting market growth?
N/A
8. Can you provide examples of recent developments in the market?
N/A
9. What pricing options are available for accessing the report?
Pricing options include single-user, multi-user, and enterprise licenses priced at USD 2900.00, USD 4350.00, and USD 5800.00 respectively.
10. Is the market size provided in terms of value or volume?
The market size is provided in terms of value, measured in million.
11. Are there any specific market keywords associated with the report?
Yes, the market keyword associated with the report is "Sway Bar Roll Bar," which aids in identifying and referencing the specific market segment covered.
12. How do I determine which pricing option suits my needs best?
The pricing options vary based on user requirements and access needs. Individual users may opt for single-user licenses, while businesses requiring broader access may choose multi-user or enterprise licenses for cost-effective access to the report.
13. Are there any additional resources or data provided in the Sway Bar Roll Bar report?
While the report offers comprehensive insights, it's advisable to review the specific contents or supplementary materials provided to ascertain if additional resources or data are available.
14. How can I stay updated on further developments or reports in the Sway Bar Roll Bar?
To stay informed about further developments, trends, and reports in the Sway Bar Roll Bar, consider subscribing to industry newsletters, following relevant companies and organizations, or regularly checking reputable industry news sources and publications.
Methodology
Step 1 - Identification of Relevant Samples Size from Population Database


Step 2 - Approaches for Defining Global Market Size (Value, Volume* & Price*)

Note*: In applicable scenarios
Step 3 - Data Sources
Primary Research
- Web Analytics
- Survey Reports
- Research Institute
- Latest Research Reports
- Opinion Leaders
Secondary Research
- Annual Reports
- White Paper
- Latest Press Release
- Industry Association
- Paid Database
- Investor Presentations

Step 4 - Data Triangulation
Involves using different sources of information in order to increase the validity of a study
These sources are likely to be stakeholders in a program - participants, other researchers, program staff, other community members, and so on.
Then we put all data in single framework & apply various statistical tools to find out the dynamic on the market.
During the analysis stage, feedback from the stakeholder groups would be compared to determine areas of agreement as well as areas of divergence
