

Key Insights
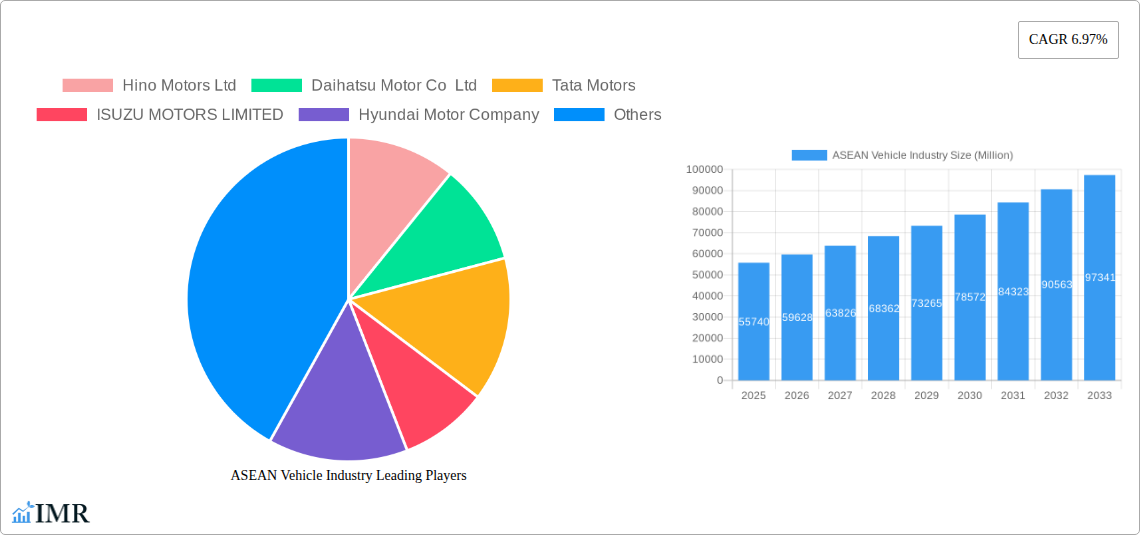
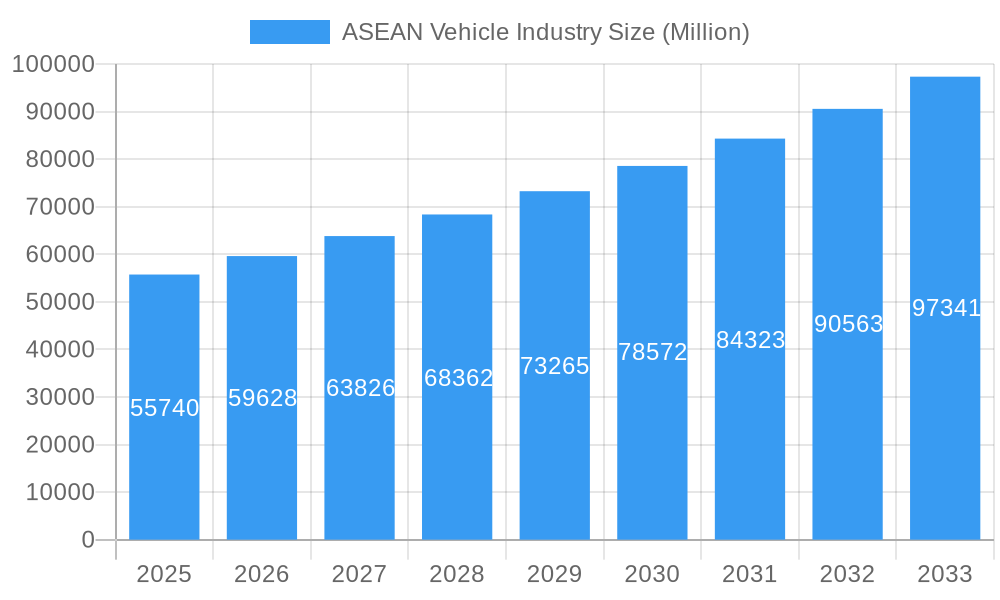
The ASEAN vehicle industry, valued at $55.74 billion in 2025, is projected to experience robust growth, driven by rising disposable incomes, expanding infrastructure development, and a burgeoning middle class across the region. Indonesia, Thailand, and Vietnam are key contributors to this market, representing a significant portion of the overall sales volume, primarily due to their large populations and developing automotive sectors. Growth is fueled by increasing demand for both light commercial vehicles (LCVs) used for business and transportation, and medium- and heavy-duty commercial vehicles (M&HCVs) crucial for logistics and infrastructure projects. The industry benefits from government initiatives promoting automotive manufacturing and infrastructure development, further stimulating market expansion. However, challenges such as fluctuating fuel prices, supply chain disruptions, and the increasing adoption of electric vehicles (EVs) present potential headwinds. The competitive landscape features a mix of established global players like Hino, Isuzu, and Tata Motors, alongside local and regional manufacturers vying for market share. The forecast period (2025-2033) anticipates a continued upward trajectory, with the CAGR of 6.97% indicating substantial growth potential. Specific segment performance will depend on evolving consumer preferences, government policies, and economic conditions within each ASEAN nation. The introduction of stricter emission regulations is also anticipated to influence the types of vehicles manufactured and sold in the region.
ASEAN Vehicle Industry Market Size (In Billion)
The future of the ASEAN vehicle industry hinges on effectively navigating these challenges and capitalizing on emerging opportunities. Technological advancements, particularly in electric and hybrid vehicles, will play a crucial role in shaping the industry's trajectory. Manufacturers will need to adapt their strategies to accommodate changing consumer preferences and environmental regulations. Furthermore, strengthening regional supply chains and fostering collaborative partnerships will be essential for sustained growth and competitiveness. The increasing emphasis on sustainable transportation and the adoption of innovative technologies are expected to drive further transformation within the ASEAN vehicle market, creating both opportunities and challenges for businesses operating in this dynamic sector.
ASEAN Vehicle Industry Company Market Share
ASEAN Vehicle Industry Market Report: 2019-2033
This comprehensive report provides an in-depth analysis of the ASEAN vehicle industry, covering market dynamics, growth trends, dominant segments, and future outlook. The study period spans 2019-2033, with a base year of 2025 and a forecast period of 2025-2033. This report is essential for industry professionals, investors, and policymakers seeking to understand and capitalize on opportunities within this dynamic market. Key segments analyzed include Light Commercial Vehicles and Medium- and Heavy-duty Commercial Vehicles across major ASEAN countries: Indonesia, Thailand, Vietnam, Singapore, Malaysia, Philippines, and the Rest of ASEAN. The report leverages robust data and qualitative insights to provide a holistic view of the industry's current state and future trajectory.
ASEAN Vehicle Industry Market Dynamics & Structure
The ASEAN vehicle market is characterized by diverse dynamics, including varying levels of market concentration across different countries and segments. Technological innovation, driven by the push towards electric vehicles (EVs) and improved fuel efficiency, is a significant factor. Regulatory frameworks, including emission standards and safety regulations, play a crucial role in shaping industry growth. The market also sees competition from alternative transportation modes and evolving consumer preferences. Mergers and acquisitions (M&A) activity is moderate, with strategic alliances and joint ventures becoming increasingly prevalent.
- Market Concentration: Indonesia and Thailand hold the largest market shares, resulting in higher concentration in these markets compared to smaller ASEAN nations. The overall market is moderately concentrated, with a few major players dominating specific segments.
- Technological Innovation: The shift toward EVs is a primary driver, impacting the entire value chain. However, charging infrastructure limitations and high initial investment costs pose significant barriers to widespread EV adoption. Other innovations include advanced driver-assistance systems (ADAS) and connected car technologies.
- Regulatory Framework: ASEAN countries are implementing stricter emission standards, pushing manufacturers to invest in cleaner technologies. Safety regulations are also evolving, demanding improvements in vehicle safety features.
- Competitive Product Substitutes: Public transportation, ride-hailing services, and two-wheelers compete for market share, particularly in urban areas.
- End-User Demographics: Growing urbanization and rising disposable incomes are fueling demand, especially for personal vehicles in wealthier segments. Commercial vehicle demand is driven by economic activity and infrastructure development.
- M&A Trends: The number of M&A deals in the ASEAN vehicle industry averaged xx per year during the historical period (2019-2024), with a predicted xx deals in 2025. Many deals focused on strategic partnerships to enhance technological capabilities and expand market reach.
ASEAN Vehicle Industry Growth Trends & Insights
The ASEAN vehicle industry experienced significant growth during the historical period (2019-2024), with a Compound Annual Growth Rate (CAGR) of xx Million units. This growth was largely driven by robust economic expansion in several ASEAN countries, coupled with rising disposable incomes and increasing urbanization. However, the COVID-19 pandemic caused a temporary disruption in 2020, impacting production and sales. Market recovery was observed in subsequent years, although supply chain constraints and semiconductor shortages continued to pose challenges. The shift towards electric vehicles is gaining momentum, albeit at a gradual pace. Consumer preferences are evolving, with increasing demand for features such as safety, fuel efficiency, and connectivity. The forecast period (2025-2033) projects a CAGR of xx Million units, driven by continued economic growth, infrastructure development, and the gradual adoption of EVs. Market penetration of EVs is projected to reach xx% by 2033.
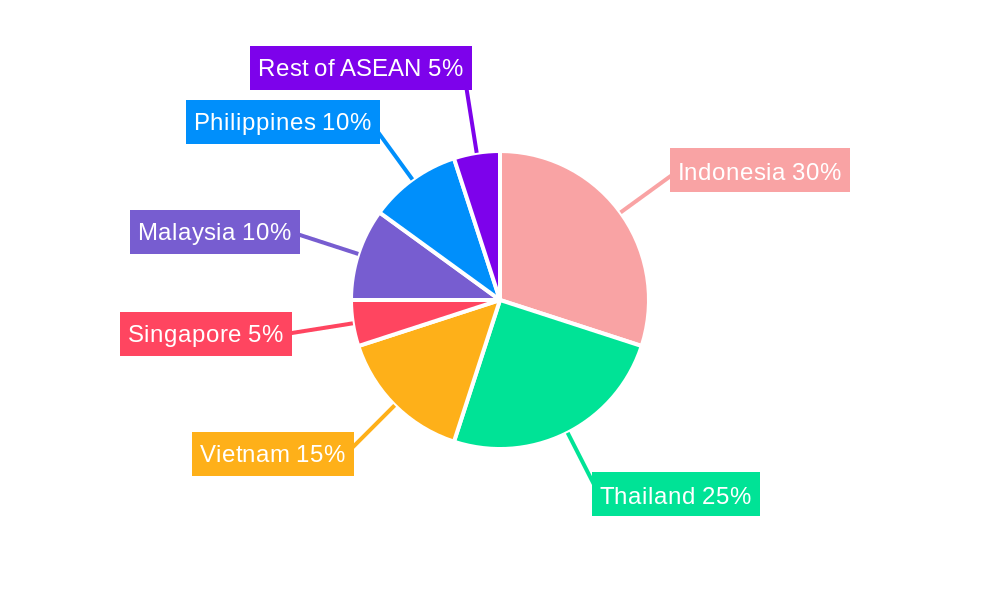
Dominant Regions, Countries, or Segments in ASEAN Vehicle Industry
Indonesia and Thailand are the dominant markets in the ASEAN vehicle industry, accounting for a combined xx% of total sales during the historical period. Their large populations, robust economies, and well-established automotive manufacturing sectors contribute to their market leadership. The light commercial vehicle segment consistently holds the largest market share due to its broad application across various sectors, including logistics, transportation, and retail.
- Indonesia: Strong domestic demand fueled by a large population and expanding middle class.
- Thailand: Established automotive manufacturing base and significant export volumes.
- Vietnam: Rapid economic growth and increasing urbanization drive demand, but market share is significantly lower than Indonesia and Thailand.
- Light Commercial Vehicles: High demand across various sectors, including logistics and retail, driven by robust economic activity.
- Medium- and Heavy-duty Commercial Vehicles: Demand is linked to infrastructure development and industrial growth, with growth potential tied to infrastructure projects.
ASEAN Vehicle Industry Product Landscape
The ASEAN vehicle market offers a diverse range of products, catering to varied needs and budgets. Innovation is driven by factors such as fuel efficiency, safety, and connectivity. Light commercial vehicles dominate in terms of volume, while medium- and heavy-duty trucks are essential for infrastructure development. The emergence of electric vehicles introduces a new dimension, with manufacturers focusing on enhancing battery technology and charging infrastructure. Unique selling propositions (USPs) include advanced driver-assistance systems (ADAS) and increasingly sophisticated infotainment systems, while technological advancements such as hybrid and electric powertrains are shaping the future product landscape.
Key Drivers, Barriers & Challenges in ASEAN Vehicle Industry
Key Drivers:
- Economic Growth: Rising disposable incomes and expanding middle class fuel demand for personal and commercial vehicles.
- Infrastructure Development: Investment in roads, railways, and ports drives demand for commercial vehicles.
- Government Support: Policies promoting vehicle manufacturing and the adoption of cleaner technologies.
Challenges:
- Supply Chain Disruptions: Global supply chain issues impacting component availability and production costs.
- Regulatory Hurdles: Stricter emission standards and safety regulations increase compliance costs.
- Competition: Intense competition among established and emerging players.
Emerging Opportunities in ASEAN Vehicle Industry
- Electric Vehicle Adoption: Growth potential in the EV segment driven by government support and increasing consumer awareness.
- Shared Mobility Services: Opportunities in ride-hailing and car-sharing platforms.
- Aftermarket Services: Growth potential in maintenance, repair, and parts distribution.
Growth Accelerators in the ASEAN Vehicle Industry Industry
Long-term growth in the ASEAN vehicle industry will be significantly influenced by technological breakthroughs in battery technology, leading to more affordable and longer-range electric vehicles. Strategic partnerships between established automakers and technology companies are also essential in accelerating innovation and market penetration. Expansion of charging infrastructure and supportive government policies promoting EV adoption will further propel long-term growth.
Key Players Shaping the ASEAN Vehicle Industry Market
Notable Milestones in ASEAN Vehicle Industry Sector
- October 2022: Energy Absolute PCL announced plans to launch a 1-ton electric pickup truck.
- September 2022: PT Indika Energy Tbk established a joint venture to manufacture commercial electric vehicles and batteries.
- June 2022: MAN Truck & Bus (M) Sdn Bhd delivered its first batch of new MAN Truck Generation vehicles.
In-Depth ASEAN Vehicle Industry Market Outlook
The ASEAN vehicle market is poised for continued growth over the forecast period, driven by factors such as economic expansion, infrastructure development, and the gradual adoption of electric vehicles. Strategic opportunities exist for companies that can adapt to evolving consumer preferences, invest in innovative technologies, and navigate the challenges posed by supply chain disruptions and regulatory changes. The long-term outlook remains positive, particularly for companies focused on sustainable and technologically advanced vehicles.
ASEAN Vehicle Industry Segmentation
-
1. Vehicle Type
- 1.1. Light Commercial Vehicles
- 1.2. Medium- and Heavy-duty Commercial Vehicles
ASEAN Vehicle Industry Segmentation By Geography
-
1. North America
- 1.1. United States
- 1.2. Canada
- 1.3. Mexico
-
2. South America
- 2.1. Brazil
- 2.2. Argentina
- 2.3. Rest of South America
-
3. Europe
- 3.1. United Kingdom
- 3.2. Germany
- 3.3. France
- 3.4. Italy
- 3.5. Spain
- 3.6. Russia
- 3.7. Benelux
- 3.8. Nordics
- 3.9. Rest of Europe
-
4. Middle East & Africa
- 4.1. Turkey
- 4.2. Israel
- 4.3. GCC
- 4.4. North Africa
- 4.5. South Africa
- 4.6. Rest of Middle East & Africa
-
5. Asia Pacific
- 5.1. China
- 5.2. India
- 5.3. Japan
- 5.4. South Korea
- 5.5. ASEAN
- 5.6. Oceania
- 5.7. Rest of Asia Pacific
ASEAN Vehicle Industry Regional Market Share
Geographic Coverage of ASEAN Vehicle Industry
ASEAN Vehicle Industry REPORT HIGHLIGHTS
| Aspects | Details |
|---|---|
| Study Period | 2020-2034 |
| Base Year | 2025 |
| Estimated Year | 2026 |
| Forecast Period | 2026-2034 |
| Historical Period | 2020-2025 |
| Growth Rate | CAGR of 6.97% from 2020-2034 |
| Segmentation |
|
Table of Contents
- 1. Introduction
- 1.1. Research Scope
- 1.2. Market Segmentation
- 1.3. Research Objective
- 1.4. Definitions and Assumptions
- 2. Executive Summary
- 2.1. Market Snapshot
- 3. Market Dynamics
- 3.1. Market Drivers
- 3.2. Market Restrains
- 3.3. Market Trends
- 3.4. Market Opportunities
- 4. Market Factor Analysis
- 4.1. Porters Five Forces
- 4.1.1. Bargaining Power of Suppliers
- 4.1.2. Bargaining Power of Buyers
- 4.1.3. Threat of New Entrants
- 4.1.4. Threat of Substitutes
- 4.1.5. Competitive Rivalry
- 4.2. PESTEL analysis
- 4.3. BCG Analysis
- 4.3.1. Stars (High Growth, High Market Share)
- 4.3.2. Cash Cows (Low Growth, High Market Share)
- 4.3.3. Question Mark (High Growth, Low Market Share)
- 4.3.4. Dogs (Low Growth, Low Market Share)
- 4.4. Ansoff Matrix Analysis
- 4.5. Supply Chain Analysis
- 4.6. Regulatory Landscape
- 4.7. Current Market Potential and Opportunity Assessment (TAM–SAM–SOM Framework)
- 4.8. IMR Analyst Note
- 4.1. Porters Five Forces
- 5. Market Analysis, Insights and Forecast 2021-2033
- 5.1. Market Analysis, Insights and Forecast - by Vehicle Type
- 5.1.1. Light Commercial Vehicles
- 5.1.2. Medium- and Heavy-duty Commercial Vehicles
- 5.2. Market Analysis, Insights and Forecast - by Region
- 5.2.1. North America
- 5.2.2. South America
- 5.2.3. Europe
- 5.2.4. Middle East & Africa
- 5.2.5. Asia Pacific
- 5.1. Market Analysis, Insights and Forecast - by Vehicle Type
- 6. Global ASEAN Vehicle Industry Analysis, Insights and Forecast, 2021-2033
- 6.1. Market Analysis, Insights and Forecast - by Vehicle Type
- 6.1.1. Light Commercial Vehicles
- 6.1.2. Medium- and Heavy-duty Commercial Vehicles
- 6.1. Market Analysis, Insights and Forecast - by Vehicle Type
- 7. North America ASEAN Vehicle Industry Analysis, Insights and Forecast, 2020-2032
- 7.1. Market Analysis, Insights and Forecast - by Vehicle Type
- 7.1.1. Light Commercial Vehicles
- 7.1.2. Medium- and Heavy-duty Commercial Vehicles
- 7.1. Market Analysis, Insights and Forecast - by Vehicle Type
- 8. South America ASEAN Vehicle Industry Analysis, Insights and Forecast, 2020-2032
- 8.1. Market Analysis, Insights and Forecast - by Vehicle Type
- 8.1.1. Light Commercial Vehicles
- 8.1.2. Medium- and Heavy-duty Commercial Vehicles
- 8.1. Market Analysis, Insights and Forecast - by Vehicle Type
- 9. Europe ASEAN Vehicle Industry Analysis, Insights and Forecast, 2020-2032
- 9.1. Market Analysis, Insights and Forecast - by Vehicle Type
- 9.1.1. Light Commercial Vehicles
- 9.1.2. Medium- and Heavy-duty Commercial Vehicles
- 9.1. Market Analysis, Insights and Forecast - by Vehicle Type
- 10. Middle East & Africa ASEAN Vehicle Industry Analysis, Insights and Forecast, 2020-2032
- 10.1. Market Analysis, Insights and Forecast - by Vehicle Type
- 10.1.1. Light Commercial Vehicles
- 10.1.2. Medium- and Heavy-duty Commercial Vehicles
- 10.1. Market Analysis, Insights and Forecast - by Vehicle Type
- 11. Asia Pacific ASEAN Vehicle Industry Analysis, Insights and Forecast, 2020-2032
- 11.1. Market Analysis, Insights and Forecast - by Vehicle Type
- 11.1.1. Light Commercial Vehicles
- 11.1.2. Medium- and Heavy-duty Commercial Vehicles
- 11.1. Market Analysis, Insights and Forecast - by Vehicle Type
- 12. Competitive Analysis
- 12.1. Company Profiles
- 12.1.1 Hino Motors Ltd
- 12.1.1.1. Company Overview
- 12.1.1.2. Products
- 12.1.1.3. Company Financials
- 12.1.1.4. SWOT Analysis
- 12.1.2 Daihatsu Motor Co Ltd
- 12.1.2.1. Company Overview
- 12.1.2.2. Products
- 12.1.2.3. Company Financials
- 12.1.2.4. SWOT Analysis
- 12.1.3 Tata Motors
- 12.1.3.1. Company Overview
- 12.1.3.2. Products
- 12.1.3.3. Company Financials
- 12.1.3.4. SWOT Analysis
- 12.1.4 ISUZU MOTORS LIMITED
- 12.1.4.1. Company Overview
- 12.1.4.2. Products
- 12.1.4.3. Company Financials
- 12.1.4.4. SWOT Analysis
- 12.1.5 Hyundai Motor Company
- 12.1.5.1. Company Overview
- 12.1.5.2. Products
- 12.1.5.3. Company Financials
- 12.1.5.4. SWOT Analysis
- 12.1.6 FCA US LLC
- 12.1.6.1. Company Overview
- 12.1.6.2. Products
- 12.1.6.3. Company Financials
- 12.1.6.4. SWOT Analysis
- 12.1.7 Scania
- 12.1.7.1. Company Overview
- 12.1.7.2. Products
- 12.1.7.3. Company Financials
- 12.1.7.4. SWOT Analysis
- 12.1.8 UD Trucks Corp
- 12.1.8.1. Company Overview
- 12.1.8.2. Products
- 12.1.8.3. Company Financials
- 12.1.8.4. SWOT Analysis
- 12.1.9 IVECO
- 12.1.9.1. Company Overview
- 12.1.9.2. Products
- 12.1.9.3. Company Financials
- 12.1.9.4. SWOT Analysis
- 12.1.10 Honda Motor Co Ltd
- 12.1.10.1. Company Overview
- 12.1.10.2. Products
- 12.1.10.3. Company Financials
- 12.1.10.4. SWOT Analysis
- 12.1.11 MITSUBISHI MOTORS CORPORATION
- 12.1.11.1. Company Overview
- 12.1.11.2. Products
- 12.1.11.3. Company Financials
- 12.1.11.4. SWOT Analysis
- 12.1.12 Ford Motor Company
- 12.1.12.1. Company Overview
- 12.1.12.2. Products
- 12.1.12.3. Company Financials
- 12.1.12.4. SWOT Analysis
- 12.1.1 Hino Motors Ltd
- 12.2. Market Entropy
- 12.2.1 Company's Key Areas Served
- 12.2.2 Recent Developments
- 12.3. Company Market Share Analysis 2025
- 12.3.1 Top 5 Companies Market Share Analysis
- 12.3.2 Top 3 Companies Market Share Analysis
- 12.4. List of Potential Customers
- 13. Research Methodology
List of Figures
- Figure 1: Global ASEAN Vehicle Industry Revenue Breakdown (Million, %) by Region 2025 & 2033
- Figure 2: North America ASEAN Vehicle Industry Revenue (Million), by Vehicle Type 2025 & 2033
- Figure 3: North America ASEAN Vehicle Industry Revenue Share (%), by Vehicle Type 2025 & 2033
- Figure 4: North America ASEAN Vehicle Industry Revenue (Million), by Country 2025 & 2033
- Figure 5: North America ASEAN Vehicle Industry Revenue Share (%), by Country 2025 & 2033
- Figure 6: South America ASEAN Vehicle Industry Revenue (Million), by Vehicle Type 2025 & 2033
- Figure 7: South America ASEAN Vehicle Industry Revenue Share (%), by Vehicle Type 2025 & 2033
- Figure 8: South America ASEAN Vehicle Industry Revenue (Million), by Country 2025 & 2033
- Figure 9: South America ASEAN Vehicle Industry Revenue Share (%), by Country 2025 & 2033
- Figure 10: Europe ASEAN Vehicle Industry Revenue (Million), by Vehicle Type 2025 & 2033
- Figure 11: Europe ASEAN Vehicle Industry Revenue Share (%), by Vehicle Type 2025 & 2033
- Figure 12: Europe ASEAN Vehicle Industry Revenue (Million), by Country 2025 & 2033
- Figure 13: Europe ASEAN Vehicle Industry Revenue Share (%), by Country 2025 & 2033
- Figure 14: Middle East & Africa ASEAN Vehicle Industry Revenue (Million), by Vehicle Type 2025 & 2033
- Figure 15: Middle East & Africa ASEAN Vehicle Industry Revenue Share (%), by Vehicle Type 2025 & 2033
- Figure 16: Middle East & Africa ASEAN Vehicle Industry Revenue (Million), by Country 2025 & 2033
- Figure 17: Middle East & Africa ASEAN Vehicle Industry Revenue Share (%), by Country 2025 & 2033
- Figure 18: Asia Pacific ASEAN Vehicle Industry Revenue (Million), by Vehicle Type 2025 & 2033
- Figure 19: Asia Pacific ASEAN Vehicle Industry Revenue Share (%), by Vehicle Type 2025 & 2033
- Figure 20: Asia Pacific ASEAN Vehicle Industry Revenue (Million), by Country 2025 & 2033
- Figure 21: Asia Pacific ASEAN Vehicle Industry Revenue Share (%), by Country 2025 & 2033
List of Tables
- Table 1: Global ASEAN Vehicle Industry Revenue Million Forecast, by Vehicle Type 2020 & 2033
- Table 2: Global ASEAN Vehicle Industry Revenue Million Forecast, by Region 2020 & 2033
- Table 3: Global ASEAN Vehicle Industry Revenue Million Forecast, by Vehicle Type 2020 & 2033
- Table 4: Global ASEAN Vehicle Industry Revenue Million Forecast, by Country 2020 & 2033
- Table 5: United States ASEAN Vehicle Industry Revenue (Million) Forecast, by Application 2020 & 2033
- Table 6: Canada ASEAN Vehicle Industry Revenue (Million) Forecast, by Application 2020 & 2033
- Table 7: Mexico ASEAN Vehicle Industry Revenue (Million) Forecast, by Application 2020 & 2033
- Table 8: Global ASEAN Vehicle Industry Revenue Million Forecast, by Vehicle Type 2020 & 2033
- Table 9: Global ASEAN Vehicle Industry Revenue Million Forecast, by Country 2020 & 2033
- Table 10: Brazil ASEAN Vehicle Industry Revenue (Million) Forecast, by Application 2020 & 2033
- Table 11: Argentina ASEAN Vehicle Industry Revenue (Million) Forecast, by Application 2020 & 2033
- Table 12: Rest of South America ASEAN Vehicle Industry Revenue (Million) Forecast, by Application 2020 & 2033
- Table 13: Global ASEAN Vehicle Industry Revenue Million Forecast, by Vehicle Type 2020 & 2033
- Table 14: Global ASEAN Vehicle Industry Revenue Million Forecast, by Country 2020 & 2033
- Table 15: United Kingdom ASEAN Vehicle Industry Revenue (Million) Forecast, by Application 2020 & 2033
- Table 16: Germany ASEAN Vehicle Industry Revenue (Million) Forecast, by Application 2020 & 2033
- Table 17: France ASEAN Vehicle Industry Revenue (Million) Forecast, by Application 2020 & 2033
- Table 18: Italy ASEAN Vehicle Industry Revenue (Million) Forecast, by Application 2020 & 2033
- Table 19: Spain ASEAN Vehicle Industry Revenue (Million) Forecast, by Application 2020 & 2033
- Table 20: Russia ASEAN Vehicle Industry Revenue (Million) Forecast, by Application 2020 & 2033
- Table 21: Benelux ASEAN Vehicle Industry Revenue (Million) Forecast, by Application 2020 & 2033
- Table 22: Nordics ASEAN Vehicle Industry Revenue (Million) Forecast, by Application 2020 & 2033
- Table 23: Rest of Europe ASEAN Vehicle Industry Revenue (Million) Forecast, by Application 2020 & 2033
- Table 24: Global ASEAN Vehicle Industry Revenue Million Forecast, by Vehicle Type 2020 & 2033
- Table 25: Global ASEAN Vehicle Industry Revenue Million Forecast, by Country 2020 & 2033
- Table 26: Turkey ASEAN Vehicle Industry Revenue (Million) Forecast, by Application 2020 & 2033
- Table 27: Israel ASEAN Vehicle Industry Revenue (Million) Forecast, by Application 2020 & 2033
- Table 28: GCC ASEAN Vehicle Industry Revenue (Million) Forecast, by Application 2020 & 2033
- Table 29: North Africa ASEAN Vehicle Industry Revenue (Million) Forecast, by Application 2020 & 2033
- Table 30: South Africa ASEAN Vehicle Industry Revenue (Million) Forecast, by Application 2020 & 2033
- Table 31: Rest of Middle East & Africa ASEAN Vehicle Industry Revenue (Million) Forecast, by Application 2020 & 2033
- Table 32: Global ASEAN Vehicle Industry Revenue Million Forecast, by Vehicle Type 2020 & 2033
- Table 33: Global ASEAN Vehicle Industry Revenue Million Forecast, by Country 2020 & 2033
- Table 34: China ASEAN Vehicle Industry Revenue (Million) Forecast, by Application 2020 & 2033
- Table 35: India ASEAN Vehicle Industry Revenue (Million) Forecast, by Application 2020 & 2033
- Table 36: Japan ASEAN Vehicle Industry Revenue (Million) Forecast, by Application 2020 & 2033
- Table 37: South Korea ASEAN Vehicle Industry Revenue (Million) Forecast, by Application 2020 & 2033
- Table 38: ASEAN ASEAN Vehicle Industry Revenue (Million) Forecast, by Application 2020 & 2033
- Table 39: Oceania ASEAN Vehicle Industry Revenue (Million) Forecast, by Application 2020 & 2033
- Table 40: Rest of Asia Pacific ASEAN Vehicle Industry Revenue (Million) Forecast, by Application 2020 & 2033
Frequently Asked Questions
1. What is the projected Compound Annual Growth Rate (CAGR) of the ASEAN Vehicle Industry?
The projected CAGR is approximately 6.97%.
2. Which companies are prominent players in the ASEAN Vehicle Industry?
Key companies in the market include Hino Motors Ltd, Daihatsu Motor Co Ltd, Tata Motors, ISUZU MOTORS LIMITED, Hyundai Motor Company, FCA US LLC, Scania, UD Trucks Corp, IVECO, Honda Motor Co Ltd, MITSUBISHI MOTORS CORPORATION, Ford Motor Company.
3. What are the main segments of the ASEAN Vehicle Industry?
The market segments include Vehicle Type.
4. Can you provide details about the market size?
The market size is estimated to be USD 55.74 Million as of 2022.
5. What are some drivers contributing to market growth?
Technological Advancements In Vehicles Driving Demand; Others.
6. What are the notable trends driving market growth?
The Light Commercial Vehicle Segment Dominates the Market.
7. Are there any restraints impacting market growth?
High Scan Tool Costs to Limit Growth; Others.
8. Can you provide examples of recent developments in the market?
Oct 2022- Energy Absolute PCL revealed that the development of its 100% electric passenger car MINE SPA1 under MINE Mobility was still one of EA's major business plans. The current focus of EA would be on commercial vehicles first, while the MINE SPA1 electric car project would be continued. EA also revealed that it plans to launch a 1-ton electric pickup truck under the brand MINE in Q4/2022.
9. What pricing options are available for accessing the report?
Pricing options include single-user, multi-user, and enterprise licenses priced at USD 3800, USD 4500, and USD 5800 respectively.
10. Is the market size provided in terms of value or volume?
The market size is provided in terms of value, measured in Million.
11. Are there any specific market keywords associated with the report?
Yes, the market keyword associated with the report is "ASEAN Vehicle Industry," which aids in identifying and referencing the specific market segment covered.
12. How do I determine which pricing option suits my needs best?
The pricing options vary based on user requirements and access needs. Individual users may opt for single-user licenses, while businesses requiring broader access may choose multi-user or enterprise licenses for cost-effective access to the report.
13. Are there any additional resources or data provided in the ASEAN Vehicle Industry report?
While the report offers comprehensive insights, it's advisable to review the specific contents or supplementary materials provided to ascertain if additional resources or data are available.
14. How can I stay updated on further developments or reports in the ASEAN Vehicle Industry?
To stay informed about further developments, trends, and reports in the ASEAN Vehicle Industry, consider subscribing to industry newsletters, following relevant companies and organizations, or regularly checking reputable industry news sources and publications.
Methodology
Step 1 - Identification of Relevant Samples Size from Population Database


Step 2 - Approaches for Defining Global Market Size (Value, Volume* & Price*)

Note*: In applicable scenarios
Step 3 - Data Sources
Primary Research
- Web Analytics
- Survey Reports
- Research Institute
- Latest Research Reports
- Opinion Leaders
Secondary Research
- Annual Reports
- White Paper
- Latest Press Release
- Industry Association
- Paid Database
- Investor Presentations

Step 4 - Data Triangulation
Involves using different sources of information in order to increase the validity of a study
These sources are likely to be stakeholders in a program - participants, other researchers, program staff, other community members, and so on.
Then we put all data in single framework & apply various statistical tools to find out the dynamic on the market.
During the analysis stage, feedback from the stakeholder groups would be compared to determine areas of agreement as well as areas of divergence