

Key Insights
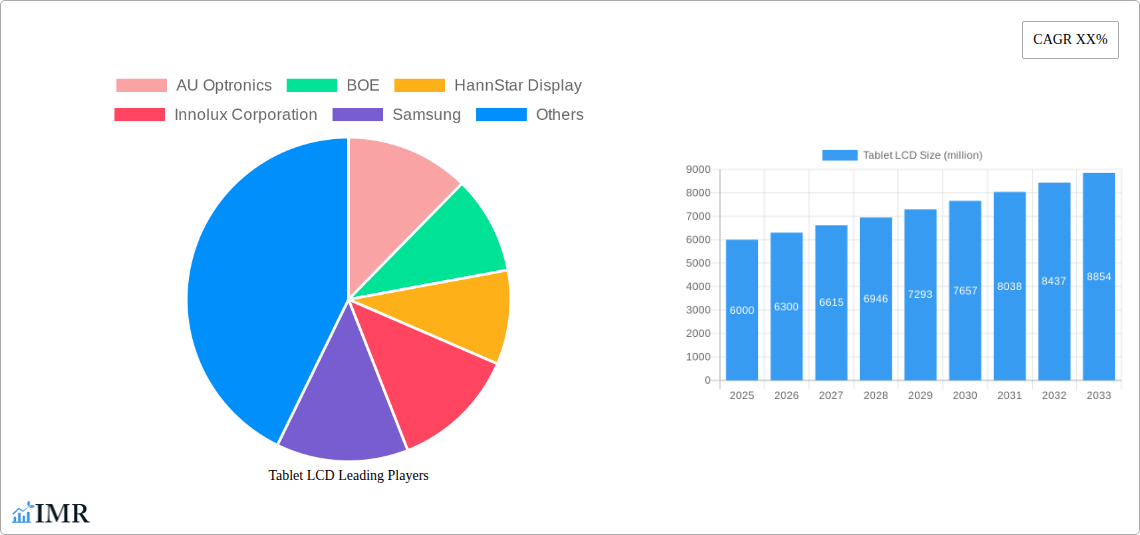
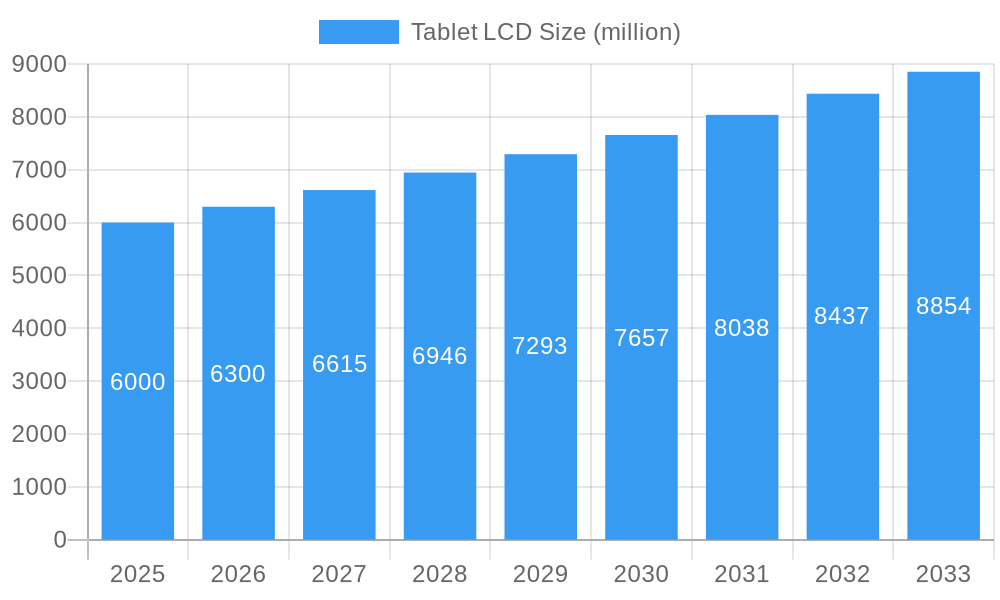
The global tablet LCD market is projected for substantial growth, fueled by the escalating demand for portable computing devices and continuous display technology innovations. With an estimated market size of $2.14 billion in the base year 2025, the market is forecasted to expand at a Compound Annual Growth Rate (CAGR) of 8.98%. This trajectory suggests a market value reaching significant figures by 2033. Key growth drivers encompass the sustained appeal of tablets for both entertainment and professional use, alongside technological advancements offering enhanced resolution, superior refresh rates, and more sophisticated, lightweight designs. Emerging trends include the adoption of mini-LED backlighting for superior contrast and brightness, and the development of flexible display technologies. However, market expansion may be tempered by intense competition from larger-screen smartphones and broader economic conditions affecting consumer expenditure. The market is segmented by screen size (e.g., 7-inch, 10-inch), resolution, and display technology (e.g., IPS, AMOLED). Prominent industry players, including AU Optronics, BOE, Samsung, and Sharp, compete through pricing, product quality, and innovation. Geographically, the market is expected to mirror established consumer electronics hubs in North America, Europe, and Asia-Pacific.
Tablet LCD Market Size (In Billion)
The forecast period (2025-2033) presents significant opportunities. Strategic imperatives for companies include capitalizing on specialized market segments such as educational or industrial tablets, and driving innovation in product quality, energy efficiency, and user experience. Strategic alliances and mergers & acquisitions will likely be crucial for maintaining a competitive advantage. Adaptability to evolving consumer preferences and foresight into future technological breakthroughs will be paramount for success in this dynamic market.
Tablet LCD Company Market Share
Tablet LCD Market Report: 2019-2033
Unlocking Growth Opportunities in the Thriving Tablet Display Ecosystem
This comprehensive report provides a deep dive into the global Tablet LCD market, offering invaluable insights for industry professionals, investors, and strategic decision-makers. With a detailed analysis spanning the period 2019-2033, this report leverages rigorous data analysis and expert insights to illuminate growth trajectories, key players, and emerging opportunities within this dynamic sector. The study period covers the historical period (2019-2024), the base year (2025), and the forecast period (2025-2033), focusing on the estimated year 2025. Market values are presented in million units.
Tablet LCD Market Dynamics & Structure
This section analyzes the competitive landscape of the Tablet LCD market, examining market concentration, technological innovation, regulatory landscapes, substitute products, end-user demographics, and M&A activity. The report delves into the interplay of these factors, providing a comprehensive understanding of the market's structure and dynamics.
- Market Concentration: The global Tablet LCD market exhibits a moderately concentrated structure, with the top five players commanding approximately xx% of the market share in 2025. This concentration is attributed to economies of scale and significant investments in R&D.
- Technological Innovation: Continuous advancements in LCD technology, such as the development of higher resolution displays and improved energy efficiency, are key drivers of market growth. However, the rising popularity of OLED and mini-LED technologies presents a challenge.
- Regulatory Frameworks: Government regulations concerning energy consumption and e-waste management influence the design and production of Tablet LCDs. Compliance costs and environmental concerns present ongoing challenges.
- Competitive Product Substitutes: OLED and mini-LED technologies are emerging as strong substitutes for Tablet LCDs, posing a significant threat to market share. The competitive intensity is expected to increase in the forecast period.
- End-User Demographics: The growth of the Tablet LCD market is directly linked to the adoption of tablets across various demographics, particularly in emerging economies. Changes in consumer preferences and purchasing power influence market demand.
- M&A Trends: The Tablet LCD industry has witnessed a moderate level of M&A activity in recent years, driven by the need for consolidation and technological advancements. xx M&A deals were recorded between 2019 and 2024, with an estimated xx million USD value.
Tablet LCD Growth Trends & Insights
This section provides a comprehensive analysis of the Tablet LCD market's growth trajectory, incorporating data-driven insights and expert commentary. The analysis includes market size evolution, adoption rates, technological disruptions, and consumer behavior shifts, offering a detailed understanding of the market’s past performance and future potential.
The Tablet LCD market experienced a CAGR of xx% during the historical period (2019-2024), reaching xx million units in 2024. The market is projected to maintain a CAGR of xx% during the forecast period (2025-2033), driven by factors such as increasing demand for portable devices and technological advancements in display technology. The market penetration rate for Tablet LCDs in key regions is expected to increase steadily. Market size for 2025 is estimated at xx million units. Technological disruptions, such as the introduction of higher resolution and flexible displays, are expected to significantly influence market growth. Consumer behavior shifts towards larger screen sizes and improved portability further contribute to market demand.
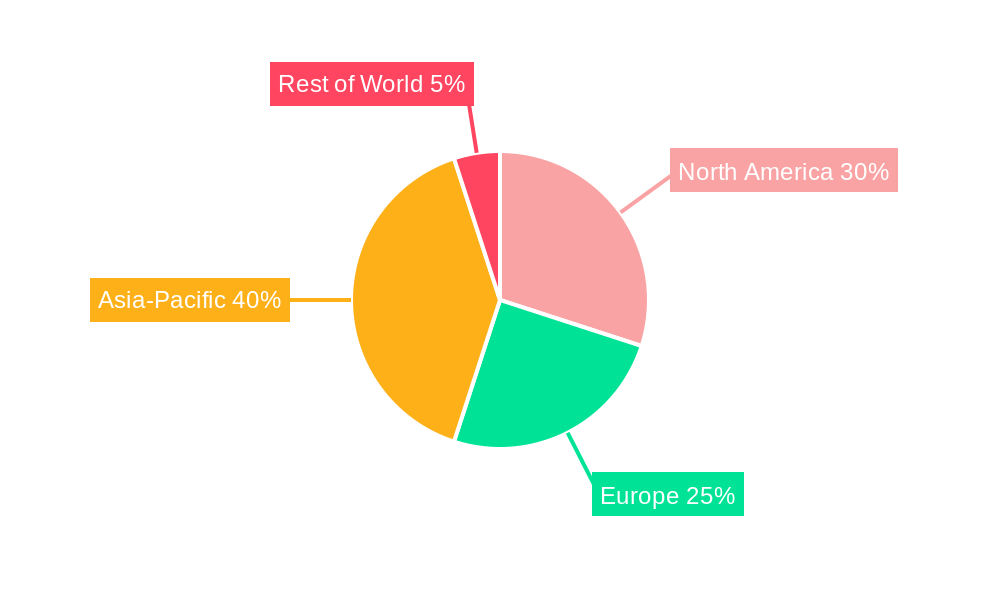
Dominant Regions, Countries, or Segments in Tablet LCD
This section identifies the leading regions, countries, or segments driving Tablet LCD market growth. A detailed analysis of market share and growth potential in each region/segment provides valuable insights for targeted market entry strategies.
- Dominant Region: Asia-Pacific is projected to be the dominant region in the Tablet LCD market throughout the forecast period, accounting for xx% of the global market share in 2025.
- Key Drivers in Asia-Pacific:
- Strong economic growth and rising disposable incomes.
- Increasing adoption of tablets across various demographics.
- Robust manufacturing infrastructure and supply chain capabilities.
- Government initiatives promoting the adoption of technology.
The North American and European markets are expected to exhibit steady growth, although at a slower pace compared to Asia-Pacific. Factors contributing to growth in these regions include ongoing technological advancements and the growing demand for high-quality displays. Market share variations are influenced by consumer preferences, economic conditions, and regional regulations.
Tablet LCD Product Landscape
The Tablet LCD product landscape is characterized by a wide range of displays differing in size, resolution, and features. Continuous advancements in display technology have led to the development of higher resolution, brighter, and more energy-efficient LCD panels. Key features include improved color accuracy, wider viewing angles, and enhanced touch sensitivity, differentiating products based on performance metrics and unique selling propositions.
Key Drivers, Barriers & Challenges in Tablet LCD
Key Drivers:
- Increasing demand for portable electronic devices.
- Advancements in display technology, leading to higher resolution and better image quality.
- Decreasing production costs making Tablet LCDs more affordable.
Challenges & Restraints:
- Competition from alternative display technologies such as OLED and mini-LED.
- Fluctuations in raw material prices impacting production costs.
- Supply chain disruptions and geopolitical instability.
These factors contribute to the overall complexity of the Tablet LCD market, significantly impacting growth and profitability.
Emerging Opportunities in Tablet LCD
Emerging opportunities in the Tablet LCD market include:
- Growing demand for high-resolution displays in emerging markets.
- Increasing adoption of tablets in education and healthcare sectors.
- Development of innovative applications for Tablet LCDs in augmented reality and virtual reality.
Growth Accelerators in the Tablet LCD Industry
Long-term growth in the Tablet LCD industry will be accelerated by technological advancements in display technology, strategic partnerships between display manufacturers and tablet makers, and expansion into new markets with high growth potential. Investments in R&D and increased production capacity will further bolster market growth.
Key Players Shaping the Tablet LCD Market
- AU Optronics
- BOE
- HannStar Display
- Innolux Corporation
- Samsung
- Sharp
- Sony
- Tianma Microelectronics
- Truly International Holdings Limited
- ViewSonic Corporation
Notable Milestones in Tablet LCD Sector
- 2020: BOE launched its new generation of high-resolution Tablet LCD panels.
- 2021: Samsung introduced a new foldable tablet with an improved LCD screen.
- 2022: AU Optronics partnered with a major tablet manufacturer to develop a new range of eco-friendly LCDs.
- 2023: Innolux Corporation secured a significant contract to supply LCD panels to a leading global tablet brand.
- 2024: Sharp announced a breakthrough in LCD technology, resulting in a significant increase in energy efficiency.
In-Depth Tablet LCD Market Outlook
The Tablet LCD market is poised for continued growth, driven by technological advancements and increasing demand in emerging markets. Strategic partnerships and investments in R&D will further fuel market expansion. While facing competition from alternative display technologies, LCD technology's cost-effectiveness and mature supply chain will ensure its continued relevance in the tablet market for the foreseeable future. The market is expected to witness significant growth in the coming years, presenting attractive opportunities for both established and new players.
Tablet LCD Segmentation
-
1. Application
- 1.1. Enterprise
- 1.2. Individual
-
2. Types
- 2.1. Monochrome LCD
- 2.2. Two-color LCD
- 2.3. Colorful LCD
Tablet LCD Segmentation By Geography
-
1. North America
- 1.1. United States
- 1.2. Canada
- 1.3. Mexico
-
2. South America
- 2.1. Brazil
- 2.2. Argentina
- 2.3. Rest of South America
-
3. Europe
- 3.1. United Kingdom
- 3.2. Germany
- 3.3. France
- 3.4. Italy
- 3.5. Spain
- 3.6. Russia
- 3.7. Benelux
- 3.8. Nordics
- 3.9. Rest of Europe
-
4. Middle East & Africa
- 4.1. Turkey
- 4.2. Israel
- 4.3. GCC
- 4.4. North Africa
- 4.5. South Africa
- 4.6. Rest of Middle East & Africa
-
5. Asia Pacific
- 5.1. China
- 5.2. India
- 5.3. Japan
- 5.4. South Korea
- 5.5. ASEAN
- 5.6. Oceania
- 5.7. Rest of Asia Pacific
Tablet LCD Regional Market Share
Geographic Coverage of Tablet LCD
Tablet LCD REPORT HIGHLIGHTS
| Aspects | Details |
|---|---|
| Study Period | 2020-2034 |
| Base Year | 2025 |
| Estimated Year | 2026 |
| Forecast Period | 2026-2034 |
| Historical Period | 2020-2025 |
| Growth Rate | CAGR of 8.98% from 2020-2034 |
| Segmentation |
|
Table of Contents
- 1. Introduction
- 1.1. Research Scope
- 1.2. Market Segmentation
- 1.3. Research Objective
- 1.4. Definitions and Assumptions
- 2. Executive Summary
- 2.1. Market Snapshot
- 3. Market Dynamics
- 3.1. Market Drivers
- 3.2. Market Restrains
- 3.3. Market Trends
- 3.4. Market Opportunities
- 4. Market Factor Analysis
- 4.1. Porters Five Forces
- 4.1.1. Bargaining Power of Suppliers
- 4.1.2. Bargaining Power of Buyers
- 4.1.3. Threat of New Entrants
- 4.1.4. Threat of Substitutes
- 4.1.5. Competitive Rivalry
- 4.2. PESTEL analysis
- 4.3. BCG Analysis
- 4.3.1. Stars (High Growth, High Market Share)
- 4.3.2. Cash Cows (Low Growth, High Market Share)
- 4.3.3. Question Mark (High Growth, Low Market Share)
- 4.3.4. Dogs (Low Growth, Low Market Share)
- 4.4. Ansoff Matrix Analysis
- 4.5. Supply Chain Analysis
- 4.6. Regulatory Landscape
- 4.7. Current Market Potential and Opportunity Assessment (TAM–SAM–SOM Framework)
- 4.8. IMR Analyst Note
- 4.1. Porters Five Forces
- 5. Market Analysis, Insights and Forecast 2021-2033
- 5.1. Market Analysis, Insights and Forecast - by Application
- 5.1.1. Enterprise
- 5.1.2. Individual
- 5.2. Market Analysis, Insights and Forecast - by Types
- 5.2.1. Monochrome LCD
- 5.2.2. Two-color LCD
- 5.2.3. Colorful LCD
- 5.3. Market Analysis, Insights and Forecast - by Region
- 5.3.1. North America
- 5.3.2. South America
- 5.3.3. Europe
- 5.3.4. Middle East & Africa
- 5.3.5. Asia Pacific
- 5.1. Market Analysis, Insights and Forecast - by Application
- 6. Global Tablet LCD Analysis, Insights and Forecast, 2021-2033
- 6.1. Market Analysis, Insights and Forecast - by Application
- 6.1.1. Enterprise
- 6.1.2. Individual
- 6.2. Market Analysis, Insights and Forecast - by Types
- 6.2.1. Monochrome LCD
- 6.2.2. Two-color LCD
- 6.2.3. Colorful LCD
- 6.1. Market Analysis, Insights and Forecast - by Application
- 7. North America Tablet LCD Analysis, Insights and Forecast, 2020-2032
- 7.1. Market Analysis, Insights and Forecast - by Application
- 7.1.1. Enterprise
- 7.1.2. Individual
- 7.2. Market Analysis, Insights and Forecast - by Types
- 7.2.1. Monochrome LCD
- 7.2.2. Two-color LCD
- 7.2.3. Colorful LCD
- 7.1. Market Analysis, Insights and Forecast - by Application
- 8. South America Tablet LCD Analysis, Insights and Forecast, 2020-2032
- 8.1. Market Analysis, Insights and Forecast - by Application
- 8.1.1. Enterprise
- 8.1.2. Individual
- 8.2. Market Analysis, Insights and Forecast - by Types
- 8.2.1. Monochrome LCD
- 8.2.2. Two-color LCD
- 8.2.3. Colorful LCD
- 8.1. Market Analysis, Insights and Forecast - by Application
- 9. Europe Tablet LCD Analysis, Insights and Forecast, 2020-2032
- 9.1. Market Analysis, Insights and Forecast - by Application
- 9.1.1. Enterprise
- 9.1.2. Individual
- 9.2. Market Analysis, Insights and Forecast - by Types
- 9.2.1. Monochrome LCD
- 9.2.2. Two-color LCD
- 9.2.3. Colorful LCD
- 9.1. Market Analysis, Insights and Forecast - by Application
- 10. Middle East & Africa Tablet LCD Analysis, Insights and Forecast, 2020-2032
- 10.1. Market Analysis, Insights and Forecast - by Application
- 10.1.1. Enterprise
- 10.1.2. Individual
- 10.2. Market Analysis, Insights and Forecast - by Types
- 10.2.1. Monochrome LCD
- 10.2.2. Two-color LCD
- 10.2.3. Colorful LCD
- 10.1. Market Analysis, Insights and Forecast - by Application
- 11. Asia Pacific Tablet LCD Analysis, Insights and Forecast, 2020-2032
- 11.1. Market Analysis, Insights and Forecast - by Application
- 11.1.1. Enterprise
- 11.1.2. Individual
- 11.2. Market Analysis, Insights and Forecast - by Types
- 11.2.1. Monochrome LCD
- 11.2.2. Two-color LCD
- 11.2.3. Colorful LCD
- 11.1. Market Analysis, Insights and Forecast - by Application
- 12. Competitive Analysis
- 12.1. Company Profiles
- 12.1.1 AU Optronics
- 12.1.1.1. Company Overview
- 12.1.1.2. Products
- 12.1.1.3. Company Financials
- 12.1.1.4. SWOT Analysis
- 12.1.2 BOE
- 12.1.2.1. Company Overview
- 12.1.2.2. Products
- 12.1.2.3. Company Financials
- 12.1.2.4. SWOT Analysis
- 12.1.3 HannStar Display
- 12.1.3.1. Company Overview
- 12.1.3.2. Products
- 12.1.3.3. Company Financials
- 12.1.3.4. SWOT Analysis
- 12.1.4 Innolux Corporation
- 12.1.4.1. Company Overview
- 12.1.4.2. Products
- 12.1.4.3. Company Financials
- 12.1.4.4. SWOT Analysis
- 12.1.5 Samsung
- 12.1.5.1. Company Overview
- 12.1.5.2. Products
- 12.1.5.3. Company Financials
- 12.1.5.4. SWOT Analysis
- 12.1.6 Sharp
- 12.1.6.1. Company Overview
- 12.1.6.2. Products
- 12.1.6.3. Company Financials
- 12.1.6.4. SWOT Analysis
- 12.1.7 Sony
- 12.1.7.1. Company Overview
- 12.1.7.2. Products
- 12.1.7.3. Company Financials
- 12.1.7.4. SWOT Analysis
- 12.1.8 Tianma Microelectronics
- 12.1.8.1. Company Overview
- 12.1.8.2. Products
- 12.1.8.3. Company Financials
- 12.1.8.4. SWOT Analysis
- 12.1.9 Truly International Holdings Limited
- 12.1.9.1. Company Overview
- 12.1.9.2. Products
- 12.1.9.3. Company Financials
- 12.1.9.4. SWOT Analysis
- 12.1.10 ViewSonic Corporation
- 12.1.10.1. Company Overview
- 12.1.10.2. Products
- 12.1.10.3. Company Financials
- 12.1.10.4. SWOT Analysis
- 12.1.1 AU Optronics
- 12.2. Market Entropy
- 12.2.1 Company's Key Areas Served
- 12.2.2 Recent Developments
- 12.3. Company Market Share Analysis 2025
- 12.3.1 Top 5 Companies Market Share Analysis
- 12.3.2 Top 3 Companies Market Share Analysis
- 12.4. List of Potential Customers
- 13. Research Methodology
List of Figures
- Figure 1: Global Tablet LCD Revenue Breakdown (billion, %) by Region 2025 & 2033
- Figure 2: Global Tablet LCD Volume Breakdown (K, %) by Region 2025 & 2033
- Figure 3: North America Tablet LCD Revenue (billion), by Application 2025 & 2033
- Figure 4: North America Tablet LCD Volume (K), by Application 2025 & 2033
- Figure 5: North America Tablet LCD Revenue Share (%), by Application 2025 & 2033
- Figure 6: North America Tablet LCD Volume Share (%), by Application 2025 & 2033
- Figure 7: North America Tablet LCD Revenue (billion), by Types 2025 & 2033
- Figure 8: North America Tablet LCD Volume (K), by Types 2025 & 2033
- Figure 9: North America Tablet LCD Revenue Share (%), by Types 2025 & 2033
- Figure 10: North America Tablet LCD Volume Share (%), by Types 2025 & 2033
- Figure 11: North America Tablet LCD Revenue (billion), by Country 2025 & 2033
- Figure 12: North America Tablet LCD Volume (K), by Country 2025 & 2033
- Figure 13: North America Tablet LCD Revenue Share (%), by Country 2025 & 2033
- Figure 14: North America Tablet LCD Volume Share (%), by Country 2025 & 2033
- Figure 15: South America Tablet LCD Revenue (billion), by Application 2025 & 2033
- Figure 16: South America Tablet LCD Volume (K), by Application 2025 & 2033
- Figure 17: South America Tablet LCD Revenue Share (%), by Application 2025 & 2033
- Figure 18: South America Tablet LCD Volume Share (%), by Application 2025 & 2033
- Figure 19: South America Tablet LCD Revenue (billion), by Types 2025 & 2033
- Figure 20: South America Tablet LCD Volume (K), by Types 2025 & 2033
- Figure 21: South America Tablet LCD Revenue Share (%), by Types 2025 & 2033
- Figure 22: South America Tablet LCD Volume Share (%), by Types 2025 & 2033
- Figure 23: South America Tablet LCD Revenue (billion), by Country 2025 & 2033
- Figure 24: South America Tablet LCD Volume (K), by Country 2025 & 2033
- Figure 25: South America Tablet LCD Revenue Share (%), by Country 2025 & 2033
- Figure 26: South America Tablet LCD Volume Share (%), by Country 2025 & 2033
- Figure 27: Europe Tablet LCD Revenue (billion), by Application 2025 & 2033
- Figure 28: Europe Tablet LCD Volume (K), by Application 2025 & 2033
- Figure 29: Europe Tablet LCD Revenue Share (%), by Application 2025 & 2033
- Figure 30: Europe Tablet LCD Volume Share (%), by Application 2025 & 2033
- Figure 31: Europe Tablet LCD Revenue (billion), by Types 2025 & 2033
- Figure 32: Europe Tablet LCD Volume (K), by Types 2025 & 2033
- Figure 33: Europe Tablet LCD Revenue Share (%), by Types 2025 & 2033
- Figure 34: Europe Tablet LCD Volume Share (%), by Types 2025 & 2033
- Figure 35: Europe Tablet LCD Revenue (billion), by Country 2025 & 2033
- Figure 36: Europe Tablet LCD Volume (K), by Country 2025 & 2033
- Figure 37: Europe Tablet LCD Revenue Share (%), by Country 2025 & 2033
- Figure 38: Europe Tablet LCD Volume Share (%), by Country 2025 & 2033
- Figure 39: Middle East & Africa Tablet LCD Revenue (billion), by Application 2025 & 2033
- Figure 40: Middle East & Africa Tablet LCD Volume (K), by Application 2025 & 2033
- Figure 41: Middle East & Africa Tablet LCD Revenue Share (%), by Application 2025 & 2033
- Figure 42: Middle East & Africa Tablet LCD Volume Share (%), by Application 2025 & 2033
- Figure 43: Middle East & Africa Tablet LCD Revenue (billion), by Types 2025 & 2033
- Figure 44: Middle East & Africa Tablet LCD Volume (K), by Types 2025 & 2033
- Figure 45: Middle East & Africa Tablet LCD Revenue Share (%), by Types 2025 & 2033
- Figure 46: Middle East & Africa Tablet LCD Volume Share (%), by Types 2025 & 2033
- Figure 47: Middle East & Africa Tablet LCD Revenue (billion), by Country 2025 & 2033
- Figure 48: Middle East & Africa Tablet LCD Volume (K), by Country 2025 & 2033
- Figure 49: Middle East & Africa Tablet LCD Revenue Share (%), by Country 2025 & 2033
- Figure 50: Middle East & Africa Tablet LCD Volume Share (%), by Country 2025 & 2033
- Figure 51: Asia Pacific Tablet LCD Revenue (billion), by Application 2025 & 2033
- Figure 52: Asia Pacific Tablet LCD Volume (K), by Application 2025 & 2033
- Figure 53: Asia Pacific Tablet LCD Revenue Share (%), by Application 2025 & 2033
- Figure 54: Asia Pacific Tablet LCD Volume Share (%), by Application 2025 & 2033
- Figure 55: Asia Pacific Tablet LCD Revenue (billion), by Types 2025 & 2033
- Figure 56: Asia Pacific Tablet LCD Volume (K), by Types 2025 & 2033
- Figure 57: Asia Pacific Tablet LCD Revenue Share (%), by Types 2025 & 2033
- Figure 58: Asia Pacific Tablet LCD Volume Share (%), by Types 2025 & 2033
- Figure 59: Asia Pacific Tablet LCD Revenue (billion), by Country 2025 & 2033
- Figure 60: Asia Pacific Tablet LCD Volume (K), by Country 2025 & 2033
- Figure 61: Asia Pacific Tablet LCD Revenue Share (%), by Country 2025 & 2033
- Figure 62: Asia Pacific Tablet LCD Volume Share (%), by Country 2025 & 2033
List of Tables
- Table 1: Global Tablet LCD Revenue billion Forecast, by Application 2020 & 2033
- Table 2: Global Tablet LCD Volume K Forecast, by Application 2020 & 2033
- Table 3: Global Tablet LCD Revenue billion Forecast, by Types 2020 & 2033
- Table 4: Global Tablet LCD Volume K Forecast, by Types 2020 & 2033
- Table 5: Global Tablet LCD Revenue billion Forecast, by Region 2020 & 2033
- Table 6: Global Tablet LCD Volume K Forecast, by Region 2020 & 2033
- Table 7: Global Tablet LCD Revenue billion Forecast, by Application 2020 & 2033
- Table 8: Global Tablet LCD Volume K Forecast, by Application 2020 & 2033
- Table 9: Global Tablet LCD Revenue billion Forecast, by Types 2020 & 2033
- Table 10: Global Tablet LCD Volume K Forecast, by Types 2020 & 2033
- Table 11: Global Tablet LCD Revenue billion Forecast, by Country 2020 & 2033
- Table 12: Global Tablet LCD Volume K Forecast, by Country 2020 & 2033
- Table 13: United States Tablet LCD Revenue (billion) Forecast, by Application 2020 & 2033
- Table 14: United States Tablet LCD Volume (K) Forecast, by Application 2020 & 2033
- Table 15: Canada Tablet LCD Revenue (billion) Forecast, by Application 2020 & 2033
- Table 16: Canada Tablet LCD Volume (K) Forecast, by Application 2020 & 2033
- Table 17: Mexico Tablet LCD Revenue (billion) Forecast, by Application 2020 & 2033
- Table 18: Mexico Tablet LCD Volume (K) Forecast, by Application 2020 & 2033
- Table 19: Global Tablet LCD Revenue billion Forecast, by Application 2020 & 2033
- Table 20: Global Tablet LCD Volume K Forecast, by Application 2020 & 2033
- Table 21: Global Tablet LCD Revenue billion Forecast, by Types 2020 & 2033
- Table 22: Global Tablet LCD Volume K Forecast, by Types 2020 & 2033
- Table 23: Global Tablet LCD Revenue billion Forecast, by Country 2020 & 2033
- Table 24: Global Tablet LCD Volume K Forecast, by Country 2020 & 2033
- Table 25: Brazil Tablet LCD Revenue (billion) Forecast, by Application 2020 & 2033
- Table 26: Brazil Tablet LCD Volume (K) Forecast, by Application 2020 & 2033
- Table 27: Argentina Tablet LCD Revenue (billion) Forecast, by Application 2020 & 2033
- Table 28: Argentina Tablet LCD Volume (K) Forecast, by Application 2020 & 2033
- Table 29: Rest of South America Tablet LCD Revenue (billion) Forecast, by Application 2020 & 2033
- Table 30: Rest of South America Tablet LCD Volume (K) Forecast, by Application 2020 & 2033
- Table 31: Global Tablet LCD Revenue billion Forecast, by Application 2020 & 2033
- Table 32: Global Tablet LCD Volume K Forecast, by Application 2020 & 2033
- Table 33: Global Tablet LCD Revenue billion Forecast, by Types 2020 & 2033
- Table 34: Global Tablet LCD Volume K Forecast, by Types 2020 & 2033
- Table 35: Global Tablet LCD Revenue billion Forecast, by Country 2020 & 2033
- Table 36: Global Tablet LCD Volume K Forecast, by Country 2020 & 2033
- Table 37: United Kingdom Tablet LCD Revenue (billion) Forecast, by Application 2020 & 2033
- Table 38: United Kingdom Tablet LCD Volume (K) Forecast, by Application 2020 & 2033
- Table 39: Germany Tablet LCD Revenue (billion) Forecast, by Application 2020 & 2033
- Table 40: Germany Tablet LCD Volume (K) Forecast, by Application 2020 & 2033
- Table 41: France Tablet LCD Revenue (billion) Forecast, by Application 2020 & 2033
- Table 42: France Tablet LCD Volume (K) Forecast, by Application 2020 & 2033
- Table 43: Italy Tablet LCD Revenue (billion) Forecast, by Application 2020 & 2033
- Table 44: Italy Tablet LCD Volume (K) Forecast, by Application 2020 & 2033
- Table 45: Spain Tablet LCD Revenue (billion) Forecast, by Application 2020 & 2033
- Table 46: Spain Tablet LCD Volume (K) Forecast, by Application 2020 & 2033
- Table 47: Russia Tablet LCD Revenue (billion) Forecast, by Application 2020 & 2033
- Table 48: Russia Tablet LCD Volume (K) Forecast, by Application 2020 & 2033
- Table 49: Benelux Tablet LCD Revenue (billion) Forecast, by Application 2020 & 2033
- Table 50: Benelux Tablet LCD Volume (K) Forecast, by Application 2020 & 2033
- Table 51: Nordics Tablet LCD Revenue (billion) Forecast, by Application 2020 & 2033
- Table 52: Nordics Tablet LCD Volume (K) Forecast, by Application 2020 & 2033
- Table 53: Rest of Europe Tablet LCD Revenue (billion) Forecast, by Application 2020 & 2033
- Table 54: Rest of Europe Tablet LCD Volume (K) Forecast, by Application 2020 & 2033
- Table 55: Global Tablet LCD Revenue billion Forecast, by Application 2020 & 2033
- Table 56: Global Tablet LCD Volume K Forecast, by Application 2020 & 2033
- Table 57: Global Tablet LCD Revenue billion Forecast, by Types 2020 & 2033
- Table 58: Global Tablet LCD Volume K Forecast, by Types 2020 & 2033
- Table 59: Global Tablet LCD Revenue billion Forecast, by Country 2020 & 2033
- Table 60: Global Tablet LCD Volume K Forecast, by Country 2020 & 2033
- Table 61: Turkey Tablet LCD Revenue (billion) Forecast, by Application 2020 & 2033
- Table 62: Turkey Tablet LCD Volume (K) Forecast, by Application 2020 & 2033
- Table 63: Israel Tablet LCD Revenue (billion) Forecast, by Application 2020 & 2033
- Table 64: Israel Tablet LCD Volume (K) Forecast, by Application 2020 & 2033
- Table 65: GCC Tablet LCD Revenue (billion) Forecast, by Application 2020 & 2033
- Table 66: GCC Tablet LCD Volume (K) Forecast, by Application 2020 & 2033
- Table 67: North Africa Tablet LCD Revenue (billion) Forecast, by Application 2020 & 2033
- Table 68: North Africa Tablet LCD Volume (K) Forecast, by Application 2020 & 2033
- Table 69: South Africa Tablet LCD Revenue (billion) Forecast, by Application 2020 & 2033
- Table 70: South Africa Tablet LCD Volume (K) Forecast, by Application 2020 & 2033
- Table 71: Rest of Middle East & Africa Tablet LCD Revenue (billion) Forecast, by Application 2020 & 2033
- Table 72: Rest of Middle East & Africa Tablet LCD Volume (K) Forecast, by Application 2020 & 2033
- Table 73: Global Tablet LCD Revenue billion Forecast, by Application 2020 & 2033
- Table 74: Global Tablet LCD Volume K Forecast, by Application 2020 & 2033
- Table 75: Global Tablet LCD Revenue billion Forecast, by Types 2020 & 2033
- Table 76: Global Tablet LCD Volume K Forecast, by Types 2020 & 2033
- Table 77: Global Tablet LCD Revenue billion Forecast, by Country 2020 & 2033
- Table 78: Global Tablet LCD Volume K Forecast, by Country 2020 & 2033
- Table 79: China Tablet LCD Revenue (billion) Forecast, by Application 2020 & 2033
- Table 80: China Tablet LCD Volume (K) Forecast, by Application 2020 & 2033
- Table 81: India Tablet LCD Revenue (billion) Forecast, by Application 2020 & 2033
- Table 82: India Tablet LCD Volume (K) Forecast, by Application 2020 & 2033
- Table 83: Japan Tablet LCD Revenue (billion) Forecast, by Application 2020 & 2033
- Table 84: Japan Tablet LCD Volume (K) Forecast, by Application 2020 & 2033
- Table 85: South Korea Tablet LCD Revenue (billion) Forecast, by Application 2020 & 2033
- Table 86: South Korea Tablet LCD Volume (K) Forecast, by Application 2020 & 2033
- Table 87: ASEAN Tablet LCD Revenue (billion) Forecast, by Application 2020 & 2033
- Table 88: ASEAN Tablet LCD Volume (K) Forecast, by Application 2020 & 2033
- Table 89: Oceania Tablet LCD Revenue (billion) Forecast, by Application 2020 & 2033
- Table 90: Oceania Tablet LCD Volume (K) Forecast, by Application 2020 & 2033
- Table 91: Rest of Asia Pacific Tablet LCD Revenue (billion) Forecast, by Application 2020 & 2033
- Table 92: Rest of Asia Pacific Tablet LCD Volume (K) Forecast, by Application 2020 & 2033
Frequently Asked Questions
1. What is the projected Compound Annual Growth Rate (CAGR) of the Tablet LCD?
The projected CAGR is approximately 8.98%.
2. Which companies are prominent players in the Tablet LCD?
Key companies in the market include AU Optronics, BOE, HannStar Display, Innolux Corporation, Samsung, Sharp, Sony, Tianma Microelectronics, Truly International Holdings Limited, ViewSonic Corporation.
3. What are the main segments of the Tablet LCD?
The market segments include Application, Types.
4. Can you provide details about the market size?
The market size is estimated to be USD 2.14 billion as of 2022.
5. What are some drivers contributing to market growth?
N/A
6. What are the notable trends driving market growth?
N/A
7. Are there any restraints impacting market growth?
N/A
8. Can you provide examples of recent developments in the market?
N/A
9. What pricing options are available for accessing the report?
Pricing options include single-user, multi-user, and enterprise licenses priced at USD 4350.00, USD 6525.00, and USD 8700.00 respectively.
10. Is the market size provided in terms of value or volume?
The market size is provided in terms of value, measured in billion and volume, measured in K.
11. Are there any specific market keywords associated with the report?
Yes, the market keyword associated with the report is "Tablet LCD," which aids in identifying and referencing the specific market segment covered.
12. How do I determine which pricing option suits my needs best?
The pricing options vary based on user requirements and access needs. Individual users may opt for single-user licenses, while businesses requiring broader access may choose multi-user or enterprise licenses for cost-effective access to the report.
13. Are there any additional resources or data provided in the Tablet LCD report?
While the report offers comprehensive insights, it's advisable to review the specific contents or supplementary materials provided to ascertain if additional resources or data are available.
14. How can I stay updated on further developments or reports in the Tablet LCD?
To stay informed about further developments, trends, and reports in the Tablet LCD, consider subscribing to industry newsletters, following relevant companies and organizations, or regularly checking reputable industry news sources and publications.
Methodology
Step 1 - Identification of Relevant Samples Size from Population Database


Step 2 - Approaches for Defining Global Market Size (Value, Volume* & Price*)

Note*: In applicable scenarios
Step 3 - Data Sources
Primary Research
- Web Analytics
- Survey Reports
- Research Institute
- Latest Research Reports
- Opinion Leaders
Secondary Research
- Annual Reports
- White Paper
- Latest Press Release
- Industry Association
- Paid Database
- Investor Presentations

Step 4 - Data Triangulation
Involves using different sources of information in order to increase the validity of a study
These sources are likely to be stakeholders in a program - participants, other researchers, program staff, other community members, and so on.
Then we put all data in single framework & apply various statistical tools to find out the dynamic on the market.
During the analysis stage, feedback from the stakeholder groups would be compared to determine areas of agreement as well as areas of divergence