

Key Insights
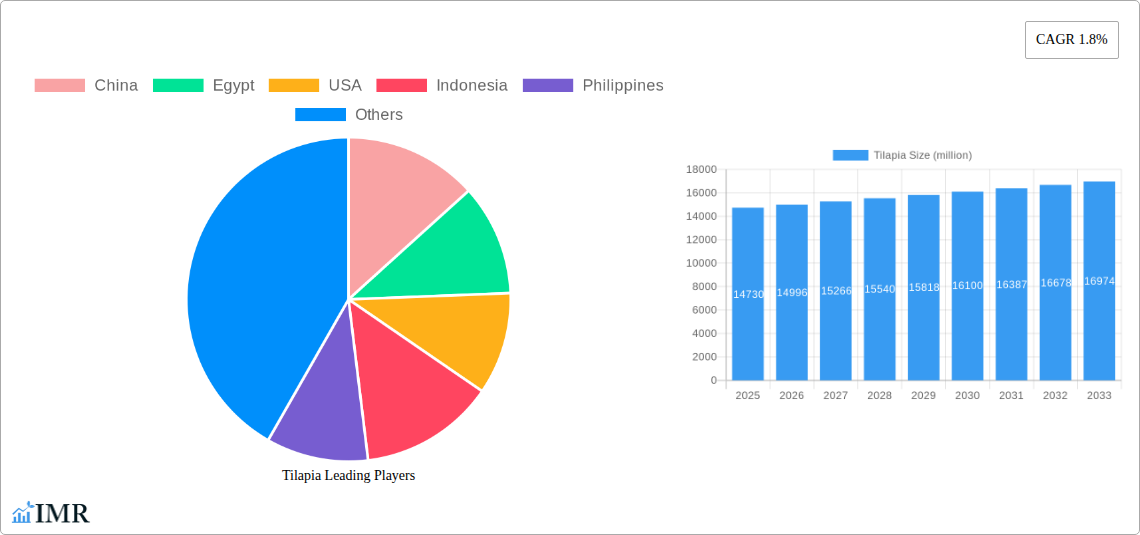
The global tilapia market, valued at $15.14 billion in 2025, is poised for robust expansion. This growth is fueled by escalating consumer preference for accessible and nutrient-rich protein alternatives. Expanding global populations, especially in emerging economies, are driving demand for tilapia due to its cost-effectiveness compared to other protein sources. Innovations in aquaculture, including optimized farming methodologies and enhanced disease control, are boosting production efficiency and market penetration. Key growth factors include the rising popularity of processed tilapia products such as frozen fillets, canned varieties, and surimi, alongside its increasing adoption in global cuisines. Despite potential challenges like disease outbreaks and feed price volatility, technological advancements and sustainable aquaculture initiatives are expected to mitigate these risks. The market's projected Compound Annual Growth Rate (CAGR) of 4.8% indicates sustained expansion throughout the forecast period (2025-2033). Significant market contributions are anticipated from Southeast Asia (Indonesia, Philippines, Thailand, Vietnam, Malaysia) and African regions (Egypt, Uganda), highlighting tilapia's widespread global appeal.
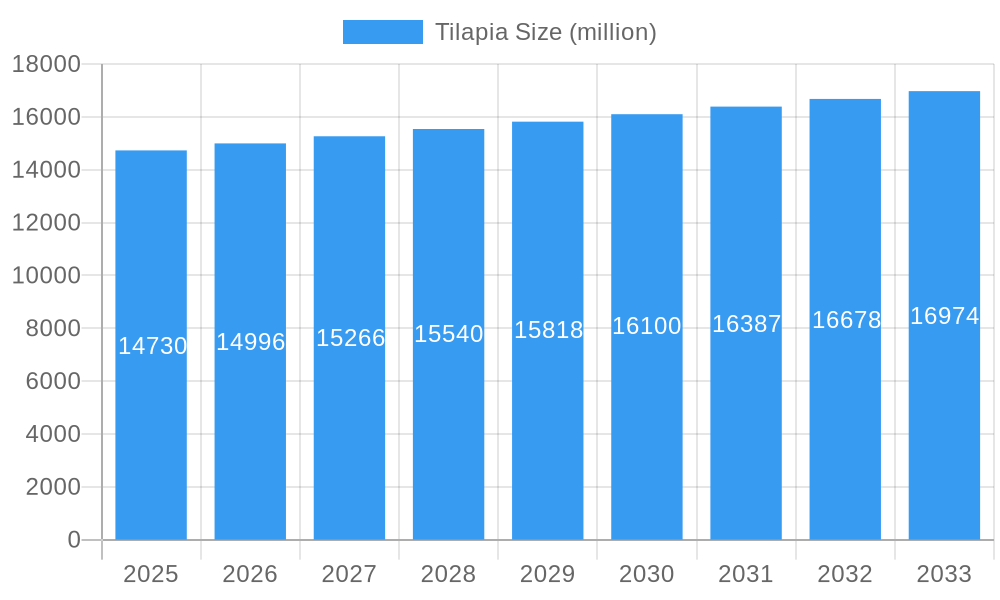
Tilapia Market Size (In Billion)
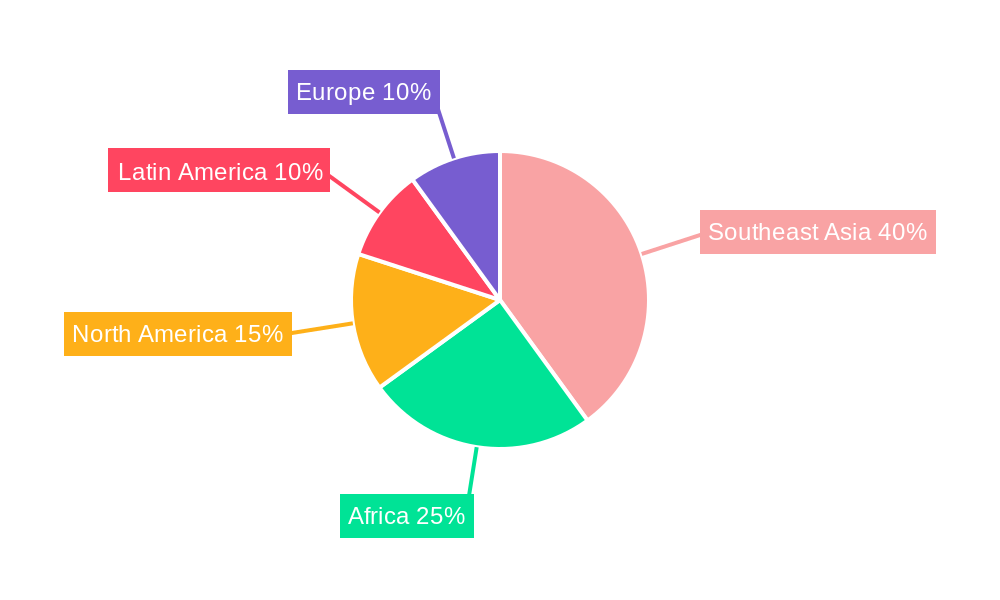
The global distribution of tilapia production and consumption is shaped by varying levels of aquaculture maturity and regional dietary preferences. While North America and Europe are substantial consumption hubs, their production contribution is less significant than that of developing nations in Asia, Africa, and Latin America. This trend is likely to persist, driven by lower production costs and favorable environmental conditions in these regions. However, demand for sustainably farmed tilapia is expected to rise in North America and Europe, influencing production standards and supply chain dynamics. Future market development will hinge on addressing sustainability imperatives, optimizing supply chain logistics, and meeting the growing demand for diverse tilapia product forms and advanced processing techniques. Continued investment in research and development, alongside the implementation of responsible aquaculture practices, will be pivotal for the long-term viability and growth of the tilapia market.
Tilapia Company Market Share
Tilapia Market Report: A Comprehensive Analysis (2019-2033)
This comprehensive report provides a detailed analysis of the global Tilapia market, encompassing market dynamics, growth trends, regional dominance, product landscape, and future outlook. The report utilizes data from the historical period (2019-2024), base year (2025), and estimated year (2025) to forecast market trends up to 2033. The study covers key players in major producing and consuming countries, including China, Egypt, USA, Indonesia, Philippines, Thailand, Brazil, Vietnam, Colombia, Ecuador, Myanmar, Malaysia, Uganda, and Bangladesh, offering invaluable insights for industry professionals, investors, and stakeholders. The market is segmented by [Insert Specific Segments Here - e.g., fresh, frozen, processed, farmed, wild-caught].
Tilapia Market Dynamics & Structure
The global Tilapia market exhibits a moderately concentrated structure, with significant production from a few major players. China and Egypt, for instance, hold substantial market shares, while several other countries contribute to the overall supply. Technological innovation is gradually increasing efficiency and yield, particularly through advancements in aquaculture techniques. However, several regulatory hurdles and varying standards across regions represent challenges. Competitive pressures stem from substitutes like other farmed fish species (e.g., catfish, pangasius) and the fluctuating demand impacting market pricing. End-user demographics are shifting, with a growing preference for healthier and sustainably sourced protein driving demand. Market consolidation through mergers and acquisitions (M&A) is slowly increasing, with approximately xx million USD worth of deals observed during 2019-2024.
- Market Concentration: China and Egypt hold approximately xx% and xx% market share, respectively.
- Technological Innovation: Focus on improving feed efficiency, disease resistance, and sustainable aquaculture practices.
- Regulatory Framework: Varying regulations across countries create compliance complexities.
- Competitive Substitutes: Catfish, pangasius, and other white fish compete with Tilapia.
- End-User Demographics: Growing demand from health-conscious consumers.
- M&A Trends: Approximately xx deals between 2019-2024 with a total value of xx million USD.
Tilapia Growth Trends & Insights
The global Tilapia market experienced substantial growth during the historical period (2019-2024), driven by factors including rising global population, increasing demand for affordable protein, and improvements in aquaculture techniques. The market size reached approximately xx million units in 2024, exhibiting a Compound Annual Growth Rate (CAGR) of xx%. The forecast period (2025-2033) anticipates continued growth, with a projected CAGR of xx%, reaching xx million units by 2033. Technological disruptions, such as advancements in recirculating aquaculture systems (RAS), are expected to further enhance productivity and sustainability. Consumer behavior shifts toward healthier dietary choices will support market expansion. Market penetration within new and emerging markets also remains a significant growth driver.
Dominant Regions, Countries, or Segments in Tilapia
China dominates the global Tilapia market, holding a significant share due to its extensive aquaculture industry and large domestic consumption. Egypt also plays a crucial role, thanks to its established aquaculture infrastructure and export capabilities. Other key contributors include Indonesia, Philippines, and Vietnam, driven by favorable climatic conditions and government support. These countries are leveraging economic policies, including subsidies and infrastructure investments, to boost Tilapia production and export capabilities. Market dominance is further analyzed considering factors such as production capacity, export volumes, and per capita consumption. Significant growth potential is observed in several African and South American markets, driven by rising demand and increased farming activities.
- Key Drivers in China: Large domestic market, efficient aquaculture practices, government support.
- Key Drivers in Egypt: Robust export market, established aquaculture infrastructure.
- Key Drivers in Southeast Asia: Favorable climatic conditions, supportive government policies.
- Growth Potential: Significant untapped potential in Africa and South America.
Tilapia Product Landscape
The Tilapia market offers diverse product forms, including fresh, frozen, and processed products (fillets, steaks). Recent innovations focus on improving product quality, extending shelf life, and offering value-added products. Technological advancements are enhancing farming techniques and processing efficiency. Unique selling propositions include the product's affordability, nutritional value, and versatility in culinary applications.
Key Drivers, Barriers & Challenges in Tilapia
Key Drivers:
- Rising global population and increasing demand for affordable protein.
- Advancements in aquaculture technology resulting in improved productivity and efficiency.
- Government support and investments in aquaculture infrastructure.
Key Challenges and Restraints:
- Disease outbreaks impacting Tilapia production and supply chain stability.
- Fluctuations in feed prices, directly impacting profitability.
- Environmental concerns related to aquaculture practices, impacting market sustainability.
- Intense competition and price pressure from substitute products.
Emerging Opportunities in Tilapia
- Expansion into new and emerging markets with high growth potential.
- Development of value-added products and processed Tilapia offerings to meet consumer preferences.
- Focus on sustainable aquaculture practices to address environmental concerns.
- Increasing research and development on disease-resistant strains and improved farming techniques.
Growth Accelerators in the Tilapia Industry
Technological breakthroughs in aquaculture, such as RAS and improved feed formulations, are key drivers of long-term growth. Strategic partnerships between producers and processors enhance value chain integration. Market expansion into under-served regions and diversification of product offerings further drive market expansion. Increased investments in research and development pave the way for innovations and improvements in disease resistance and farming efficiency.
Key Players Shaping the Tilapia Market
- China
- Egypt
- USA
- Indonesia
- Philippines
- Thailand
- Brazil
- Viet Nam
- Colombia
- Ecuador
- Myanmar
- Malaysia
- Uganda
- Bangladesh
Notable Milestones in Tilapia Sector
- 2020: Introduction of a new disease-resistant Tilapia strain by [Insert Company/Research Institute].
- 2022: Significant investment in RAS technology by [Insert Company].
- 2023: Implementation of stricter environmental regulations in [Insert Country/Region].
- 2024: Successful expansion into a new market by [Insert Company].
In-Depth Tilapia Market Outlook
The Tilapia market is poised for sustained growth, driven by strong demand, technological advancements, and strategic market expansions. The forecast period (2025-2033) anticipates significant growth potential, with opportunities in value-added product development, sustainable aquaculture practices, and penetration of new markets. Focus on innovation, strategic partnerships, and addressing sustainability concerns are critical for achieving long-term success in the Tilapia market.
Tilapia Segmentation
-
1. Application
- 1.1. Fresh
- 1.2. Freezing
- 1.3. Food Processing
-
2. Type
- 2.1. Tilapia
- 2.2. Tilapia Fillet
Tilapia Segmentation By Geography
-
1. North America
- 1.1. United States
- 1.2. Canada
- 1.3. Mexico
-
2. South America
- 2.1. Brazil
- 2.2. Argentina
- 2.3. Rest of South America
-
3. Europe
- 3.1. United Kingdom
- 3.2. Germany
- 3.3. France
- 3.4. Italy
- 3.5. Spain
- 3.6. Russia
- 3.7. Benelux
- 3.8. Nordics
- 3.9. Rest of Europe
-
4. Middle East & Africa
- 4.1. Turkey
- 4.2. Israel
- 4.3. GCC
- 4.4. North Africa
- 4.5. South Africa
- 4.6. Rest of Middle East & Africa
-
5. Asia Pacific
- 5.1. China
- 5.2. India
- 5.3. Japan
- 5.4. South Korea
- 5.5. ASEAN
- 5.6. Oceania
- 5.7. Rest of Asia Pacific
Tilapia Regional Market Share
Geographic Coverage of Tilapia
Tilapia REPORT HIGHLIGHTS
| Aspects | Details |
|---|---|
| Study Period | 2020-2034 |
| Base Year | 2025 |
| Estimated Year | 2026 |
| Forecast Period | 2026-2034 |
| Historical Period | 2020-2025 |
| Growth Rate | CAGR of 4.8% from 2020-2034 |
| Segmentation |
|
Table of Contents
- 1. Introduction
- 1.1. Research Scope
- 1.2. Market Segmentation
- 1.3. Research Methodology
- 1.4. Definitions and Assumptions
- 2. Executive Summary
- 2.1. Introduction
- 3. Market Dynamics
- 3.1. Introduction
- 3.2. Market Drivers
- 3.3. Market Restrains
- 3.4. Market Trends
- 4. Market Factor Analysis
- 4.1. Porters Five Forces
- 4.2. Supply/Value Chain
- 4.3. PESTEL analysis
- 4.4. Market Entropy
- 4.5. Patent/Trademark Analysis
- 5. Global Tilapia Analysis, Insights and Forecast, 2020-2032
- 5.1. Market Analysis, Insights and Forecast - by Application
- 5.1.1. Fresh
- 5.1.2. Freezing
- 5.1.3. Food Processing
- 5.2. Market Analysis, Insights and Forecast - by Type
- 5.2.1. Tilapia
- 5.2.2. Tilapia Fillet
- 5.3. Market Analysis, Insights and Forecast - by Region
- 5.3.1. North America
- 5.3.2. South America
- 5.3.3. Europe
- 5.3.4. Middle East & Africa
- 5.3.5. Asia Pacific
- 5.1. Market Analysis, Insights and Forecast - by Application
- 6. North America Tilapia Analysis, Insights and Forecast, 2020-2032
- 6.1. Market Analysis, Insights and Forecast - by Application
- 6.1.1. Fresh
- 6.1.2. Freezing
- 6.1.3. Food Processing
- 6.2. Market Analysis, Insights and Forecast - by Type
- 6.2.1. Tilapia
- 6.2.2. Tilapia Fillet
- 6.1. Market Analysis, Insights and Forecast - by Application
- 7. South America Tilapia Analysis, Insights and Forecast, 2020-2032
- 7.1. Market Analysis, Insights and Forecast - by Application
- 7.1.1. Fresh
- 7.1.2. Freezing
- 7.1.3. Food Processing
- 7.2. Market Analysis, Insights and Forecast - by Type
- 7.2.1. Tilapia
- 7.2.2. Tilapia Fillet
- 7.1. Market Analysis, Insights and Forecast - by Application
- 8. Europe Tilapia Analysis, Insights and Forecast, 2020-2032
- 8.1. Market Analysis, Insights and Forecast - by Application
- 8.1.1. Fresh
- 8.1.2. Freezing
- 8.1.3. Food Processing
- 8.2. Market Analysis, Insights and Forecast - by Type
- 8.2.1. Tilapia
- 8.2.2. Tilapia Fillet
- 8.1. Market Analysis, Insights and Forecast - by Application
- 9. Middle East & Africa Tilapia Analysis, Insights and Forecast, 2020-2032
- 9.1. Market Analysis, Insights and Forecast - by Application
- 9.1.1. Fresh
- 9.1.2. Freezing
- 9.1.3. Food Processing
- 9.2. Market Analysis, Insights and Forecast - by Type
- 9.2.1. Tilapia
- 9.2.2. Tilapia Fillet
- 9.1. Market Analysis, Insights and Forecast - by Application
- 10. Asia Pacific Tilapia Analysis, Insights and Forecast, 2020-2032
- 10.1. Market Analysis, Insights and Forecast - by Application
- 10.1.1. Fresh
- 10.1.2. Freezing
- 10.1.3. Food Processing
- 10.2. Market Analysis, Insights and Forecast - by Type
- 10.2.1. Tilapia
- 10.2.2. Tilapia Fillet
- 10.1. Market Analysis, Insights and Forecast - by Application
- 11. Competitive Analysis
- 11.1. Global Market Share Analysis 2025
- 11.2. Company Profiles
- 11.2.1 China
- 11.2.1.1. Overview
- 11.2.1.2. Products
- 11.2.1.3. SWOT Analysis
- 11.2.1.4. Recent Developments
- 11.2.1.5. Financials (Based on Availability)
- 11.2.2 Egypt
- 11.2.2.1. Overview
- 11.2.2.2. Products
- 11.2.2.3. SWOT Analysis
- 11.2.2.4. Recent Developments
- 11.2.2.5. Financials (Based on Availability)
- 11.2.3 USA
- 11.2.3.1. Overview
- 11.2.3.2. Products
- 11.2.3.3. SWOT Analysis
- 11.2.3.4. Recent Developments
- 11.2.3.5. Financials (Based on Availability)
- 11.2.4 Indonesia
- 11.2.4.1. Overview
- 11.2.4.2. Products
- 11.2.4.3. SWOT Analysis
- 11.2.4.4. Recent Developments
- 11.2.4.5. Financials (Based on Availability)
- 11.2.5 Philippines
- 11.2.5.1. Overview
- 11.2.5.2. Products
- 11.2.5.3. SWOT Analysis
- 11.2.5.4. Recent Developments
- 11.2.5.5. Financials (Based on Availability)
- 11.2.6 Thailand
- 11.2.6.1. Overview
- 11.2.6.2. Products
- 11.2.6.3. SWOT Analysis
- 11.2.6.4. Recent Developments
- 11.2.6.5. Financials (Based on Availability)
- 11.2.7 Brazil
- 11.2.7.1. Overview
- 11.2.7.2. Products
- 11.2.7.3. SWOT Analysis
- 11.2.7.4. Recent Developments
- 11.2.7.5. Financials (Based on Availability)
- 11.2.8 Viet Nam
- 11.2.8.1. Overview
- 11.2.8.2. Products
- 11.2.8.3. SWOT Analysis
- 11.2.8.4. Recent Developments
- 11.2.8.5. Financials (Based on Availability)
- 11.2.9 Colombia
- 11.2.9.1. Overview
- 11.2.9.2. Products
- 11.2.9.3. SWOT Analysis
- 11.2.9.4. Recent Developments
- 11.2.9.5. Financials (Based on Availability)
- 11.2.10 Ecuador
- 11.2.10.1. Overview
- 11.2.10.2. Products
- 11.2.10.3. SWOT Analysis
- 11.2.10.4. Recent Developments
- 11.2.10.5. Financials (Based on Availability)
- 11.2.11 Myanmar
- 11.2.11.1. Overview
- 11.2.11.2. Products
- 11.2.11.3. SWOT Analysis
- 11.2.11.4. Recent Developments
- 11.2.11.5. Financials (Based on Availability)
- 11.2.12 Malaysia
- 11.2.12.1. Overview
- 11.2.12.2. Products
- 11.2.12.3. SWOT Analysis
- 11.2.12.4. Recent Developments
- 11.2.12.5. Financials (Based on Availability)
- 11.2.13 Uganda
- 11.2.13.1. Overview
- 11.2.13.2. Products
- 11.2.13.3. SWOT Analysis
- 11.2.13.4. Recent Developments
- 11.2.13.5. Financials (Based on Availability)
- 11.2.14 Bangladesh
- 11.2.14.1. Overview
- 11.2.14.2. Products
- 11.2.14.3. SWOT Analysis
- 11.2.14.4. Recent Developments
- 11.2.14.5. Financials (Based on Availability)
- 11.2.1 China
List of Figures
- Figure 1: Global Tilapia Revenue Breakdown (billion, %) by Region 2025 & 2033
- Figure 2: North America Tilapia Revenue (billion), by Application 2025 & 2033
- Figure 3: North America Tilapia Revenue Share (%), by Application 2025 & 2033
- Figure 4: North America Tilapia Revenue (billion), by Type 2025 & 2033
- Figure 5: North America Tilapia Revenue Share (%), by Type 2025 & 2033
- Figure 6: North America Tilapia Revenue (billion), by Country 2025 & 2033
- Figure 7: North America Tilapia Revenue Share (%), by Country 2025 & 2033
- Figure 8: South America Tilapia Revenue (billion), by Application 2025 & 2033
- Figure 9: South America Tilapia Revenue Share (%), by Application 2025 & 2033
- Figure 10: South America Tilapia Revenue (billion), by Type 2025 & 2033
- Figure 11: South America Tilapia Revenue Share (%), by Type 2025 & 2033
- Figure 12: South America Tilapia Revenue (billion), by Country 2025 & 2033
- Figure 13: South America Tilapia Revenue Share (%), by Country 2025 & 2033
- Figure 14: Europe Tilapia Revenue (billion), by Application 2025 & 2033
- Figure 15: Europe Tilapia Revenue Share (%), by Application 2025 & 2033
- Figure 16: Europe Tilapia Revenue (billion), by Type 2025 & 2033
- Figure 17: Europe Tilapia Revenue Share (%), by Type 2025 & 2033
- Figure 18: Europe Tilapia Revenue (billion), by Country 2025 & 2033
- Figure 19: Europe Tilapia Revenue Share (%), by Country 2025 & 2033
- Figure 20: Middle East & Africa Tilapia Revenue (billion), by Application 2025 & 2033
- Figure 21: Middle East & Africa Tilapia Revenue Share (%), by Application 2025 & 2033
- Figure 22: Middle East & Africa Tilapia Revenue (billion), by Type 2025 & 2033
- Figure 23: Middle East & Africa Tilapia Revenue Share (%), by Type 2025 & 2033
- Figure 24: Middle East & Africa Tilapia Revenue (billion), by Country 2025 & 2033
- Figure 25: Middle East & Africa Tilapia Revenue Share (%), by Country 2025 & 2033
- Figure 26: Asia Pacific Tilapia Revenue (billion), by Application 2025 & 2033
- Figure 27: Asia Pacific Tilapia Revenue Share (%), by Application 2025 & 2033
- Figure 28: Asia Pacific Tilapia Revenue (billion), by Type 2025 & 2033
- Figure 29: Asia Pacific Tilapia Revenue Share (%), by Type 2025 & 2033
- Figure 30: Asia Pacific Tilapia Revenue (billion), by Country 2025 & 2033
- Figure 31: Asia Pacific Tilapia Revenue Share (%), by Country 2025 & 2033
List of Tables
- Table 1: Global Tilapia Revenue billion Forecast, by Application 2020 & 2033
- Table 2: Global Tilapia Revenue billion Forecast, by Type 2020 & 2033
- Table 3: Global Tilapia Revenue billion Forecast, by Region 2020 & 2033
- Table 4: Global Tilapia Revenue billion Forecast, by Application 2020 & 2033
- Table 5: Global Tilapia Revenue billion Forecast, by Type 2020 & 2033
- Table 6: Global Tilapia Revenue billion Forecast, by Country 2020 & 2033
- Table 7: United States Tilapia Revenue (billion) Forecast, by Application 2020 & 2033
- Table 8: Canada Tilapia Revenue (billion) Forecast, by Application 2020 & 2033
- Table 9: Mexico Tilapia Revenue (billion) Forecast, by Application 2020 & 2033
- Table 10: Global Tilapia Revenue billion Forecast, by Application 2020 & 2033
- Table 11: Global Tilapia Revenue billion Forecast, by Type 2020 & 2033
- Table 12: Global Tilapia Revenue billion Forecast, by Country 2020 & 2033
- Table 13: Brazil Tilapia Revenue (billion) Forecast, by Application 2020 & 2033
- Table 14: Argentina Tilapia Revenue (billion) Forecast, by Application 2020 & 2033
- Table 15: Rest of South America Tilapia Revenue (billion) Forecast, by Application 2020 & 2033
- Table 16: Global Tilapia Revenue billion Forecast, by Application 2020 & 2033
- Table 17: Global Tilapia Revenue billion Forecast, by Type 2020 & 2033
- Table 18: Global Tilapia Revenue billion Forecast, by Country 2020 & 2033
- Table 19: United Kingdom Tilapia Revenue (billion) Forecast, by Application 2020 & 2033
- Table 20: Germany Tilapia Revenue (billion) Forecast, by Application 2020 & 2033
- Table 21: France Tilapia Revenue (billion) Forecast, by Application 2020 & 2033
- Table 22: Italy Tilapia Revenue (billion) Forecast, by Application 2020 & 2033
- Table 23: Spain Tilapia Revenue (billion) Forecast, by Application 2020 & 2033
- Table 24: Russia Tilapia Revenue (billion) Forecast, by Application 2020 & 2033
- Table 25: Benelux Tilapia Revenue (billion) Forecast, by Application 2020 & 2033
- Table 26: Nordics Tilapia Revenue (billion) Forecast, by Application 2020 & 2033
- Table 27: Rest of Europe Tilapia Revenue (billion) Forecast, by Application 2020 & 2033
- Table 28: Global Tilapia Revenue billion Forecast, by Application 2020 & 2033
- Table 29: Global Tilapia Revenue billion Forecast, by Type 2020 & 2033
- Table 30: Global Tilapia Revenue billion Forecast, by Country 2020 & 2033
- Table 31: Turkey Tilapia Revenue (billion) Forecast, by Application 2020 & 2033
- Table 32: Israel Tilapia Revenue (billion) Forecast, by Application 2020 & 2033
- Table 33: GCC Tilapia Revenue (billion) Forecast, by Application 2020 & 2033
- Table 34: North Africa Tilapia Revenue (billion) Forecast, by Application 2020 & 2033
- Table 35: South Africa Tilapia Revenue (billion) Forecast, by Application 2020 & 2033
- Table 36: Rest of Middle East & Africa Tilapia Revenue (billion) Forecast, by Application 2020 & 2033
- Table 37: Global Tilapia Revenue billion Forecast, by Application 2020 & 2033
- Table 38: Global Tilapia Revenue billion Forecast, by Type 2020 & 2033
- Table 39: Global Tilapia Revenue billion Forecast, by Country 2020 & 2033
- Table 40: China Tilapia Revenue (billion) Forecast, by Application 2020 & 2033
- Table 41: India Tilapia Revenue (billion) Forecast, by Application 2020 & 2033
- Table 42: Japan Tilapia Revenue (billion) Forecast, by Application 2020 & 2033
- Table 43: South Korea Tilapia Revenue (billion) Forecast, by Application 2020 & 2033
- Table 44: ASEAN Tilapia Revenue (billion) Forecast, by Application 2020 & 2033
- Table 45: Oceania Tilapia Revenue (billion) Forecast, by Application 2020 & 2033
- Table 46: Rest of Asia Pacific Tilapia Revenue (billion) Forecast, by Application 2020 & 2033
Frequently Asked Questions
1. What is the projected Compound Annual Growth Rate (CAGR) of the Tilapia?
The projected CAGR is approximately 4.8%.
2. Which companies are prominent players in the Tilapia?
Key companies in the market include China, Egypt, USA, Indonesia, Philippines, Thailand, Brazil, Viet Nam, Colombia, Ecuador, Myanmar, Malaysia, Uganda, Bangladesh.
3. What are the main segments of the Tilapia?
The market segments include Application, Type.
4. Can you provide details about the market size?
The market size is estimated to be USD 15.14 billion as of 2022.
5. What are some drivers contributing to market growth?
N/A
6. What are the notable trends driving market growth?
N/A
7. Are there any restraints impacting market growth?
N/A
8. Can you provide examples of recent developments in the market?
N/A
9. What pricing options are available for accessing the report?
Pricing options include single-user, multi-user, and enterprise licenses priced at USD 4250.00, USD 6375.00, and USD 8500.00 respectively.
10. Is the market size provided in terms of value or volume?
The market size is provided in terms of value, measured in billion.
11. Are there any specific market keywords associated with the report?
Yes, the market keyword associated with the report is "Tilapia," which aids in identifying and referencing the specific market segment covered.
12. How do I determine which pricing option suits my needs best?
The pricing options vary based on user requirements and access needs. Individual users may opt for single-user licenses, while businesses requiring broader access may choose multi-user or enterprise licenses for cost-effective access to the report.
13. Are there any additional resources or data provided in the Tilapia report?
While the report offers comprehensive insights, it's advisable to review the specific contents or supplementary materials provided to ascertain if additional resources or data are available.
14. How can I stay updated on further developments or reports in the Tilapia?
To stay informed about further developments, trends, and reports in the Tilapia, consider subscribing to industry newsletters, following relevant companies and organizations, or regularly checking reputable industry news sources and publications.
Methodology
Step 1 - Identification of Relevant Samples Size from Population Database


Step 2 - Approaches for Defining Global Market Size (Value, Volume* & Price*)

Note*: In applicable scenarios
Step 3 - Data Sources
Primary Research
- Web Analytics
- Survey Reports
- Research Institute
- Latest Research Reports
- Opinion Leaders
Secondary Research
- Annual Reports
- White Paper
- Latest Press Release
- Industry Association
- Paid Database
- Investor Presentations

Step 4 - Data Triangulation
Involves using different sources of information in order to increase the validity of a study
These sources are likely to be stakeholders in a program - participants, other researchers, program staff, other community members, and so on.
Then we put all data in single framework & apply various statistical tools to find out the dynamic on the market.
During the analysis stage, feedback from the stakeholder groups would be compared to determine areas of agreement as well as areas of divergence