

Key Insights for Transfer Pricing Tax Service Market
The Global Transfer Pricing Tax Service Market demonstrated a robust valuation of $36.17 billion in 2023, and is projected to expand significantly at a Compound Annual Growth Rate (CAGR) of 6.52% through the forecast period. This trajectory is anticipated to elevate the market size to approximately $56.59 billion by 2030, reflecting a sustained demand for specialized tax advisory and compliance services across multinational enterprises (MNEs). Key demand drivers include the escalating complexity of international tax regulations, such as the OECD's Base Erosion and Profit Shifting (BEPS) framework and the impending Pillar One and Pillar Two initiatives, which necessitate intricate transfer pricing adjustments and documentation. The increasing volume and sophistication of cross-border intercompany transactions further fuel this demand, as companies strive for tax efficiency while mitigating audit risks.
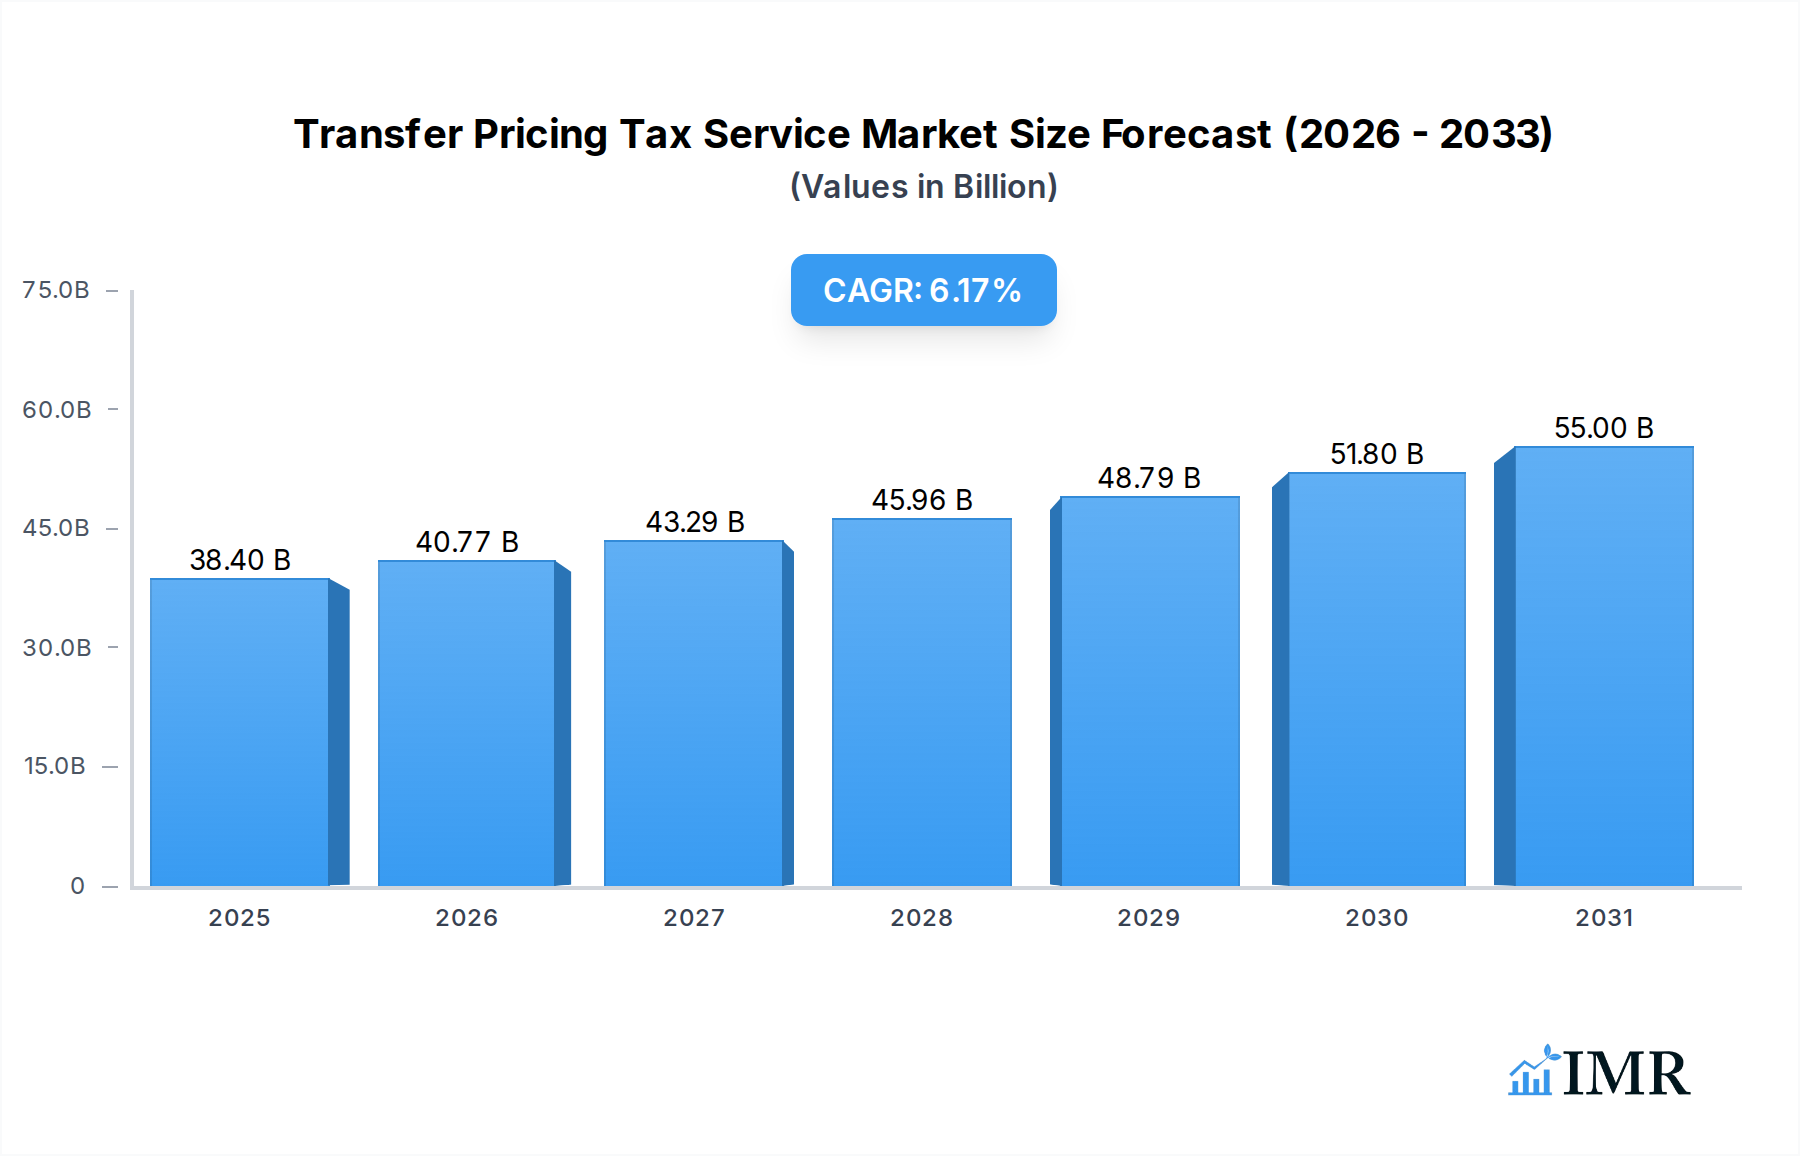
Transfer Pricing Tax Service Market Size (In Billion)
Macro tailwinds supporting this market expansion are deeply rooted in the ongoing globalization of business operations and the rapid pace of digital transformation across industries. Companies are increasingly investing in technologies that integrate with their tax functions, leading to a synergistic growth for the Tax Compliance Software Market and related Financial Advisory Services Market. The shift towards digital economies, coupled with stricter enforcement by tax authorities worldwide, underscores the critical need for robust transfer pricing strategies. Furthermore, the imperative for MNEs to optimize their value chains and ensure arm's length principles in their intra-group dealings drives continuous engagement with transfer pricing experts. The inherent risks associated with non-compliance, including substantial penalties and reputational damage, ensure that businesses prioritize investments in these services. The overarching trend of the Digital Transformation Services Market also plays a pivotal role, as it influences how tax data is managed, analyzed, and reported, creating new avenues for service providers to offer technology-enabled solutions and strategic insights to navigate the evolving tax landscape effectively.

Transfer Pricing Tax Service Company Market Share
Compliance & Documentation Segment in Transfer Pricing Tax Service Market
Within the comprehensive Transfer Pricing Tax Service Market, the Compliance & Documentation segment stands out as the single largest by revenue share, playing a pivotal role in the market's overall growth and stability. This segment's dominance is primarily attributable to the mandatory nature of regulatory requirements imposed on multinational enterprises (MNEs) globally. Tax authorities universally mandate detailed documentation demonstrating that intercompany transactions are conducted at arm's length, consistent with OECD guidelines and local tax laws. Non-compliance often results in significant financial penalties, prolonged audits, and reputational damage, thereby making robust documentation an inescapable priority for businesses operating across borders.
Key activities within this segment include the preparation of master files, local files, and country-by-country (CbC) reports, which provide a comprehensive overview of an MNE's global business operations, transfer pricing policies, and financial allocations across jurisdictions. The increasing complexity of these reporting requirements, particularly with the rollout of BEPS Action 13 and subsequent updates, has intensified the demand for specialized expertise. Furthermore, the adoption of advanced analytics and automated solutions, often integrated with the broader Regulatory Technology Market, is becoming crucial for efficient data gathering, analysis, and report generation, ensuring accuracy and consistency across diverse entities and geographies.
Major players such as PwC, EY, Deloitte, and KPMG are dominant in this segment, leveraging their global networks and deep technical expertise to assist clients with intricate documentation needs. Beyond the Big Four, specialized tax consulting firms and technology providers like Thomson Reuters also play a significant role, offering platform-based solutions that streamline compliance processes. The segment's share is expected to grow steadily, driven by the continuous evolution of international tax frameworks and the proactive stance of tax authorities in enforcing compliance. Consolidation in this space is likely to occur through strategic partnerships and acquisitions focused on integrating cutting-edge Enterprise Software Market solutions that enhance automation and data transparency. As MNEs seek to manage their tax obligations more effectively and minimize exposure to transfer pricing controversies, the demand for comprehensive compliance and documentation services will remain robust, making it a critical driver for the entire Transfer Pricing Tax Service Market. Additionally, the increasing reliance on external partners for these complex tasks contributes significantly to the growth of the Business Process Outsourcing Market as businesses look to external specialists for efficiency and expertise.
Key Market Drivers & Constraints in Transfer Pricing Tax Service Market
Market Drivers:
Increased Regulatory Scrutiny and Complexity: The global tax landscape is undergoing an unprecedented transformation, primarily driven by the OECD's BEPS project and its subsequent initiatives like Pillar One and Pillar Two. These frameworks impose rigorous obligations on multinational enterprises (MNEs) to ensure that profits are taxed where economic activities generating them occur, leading to a substantial increase in documentation requirements and audit intensity. For instance, the implementation of Country-by-Country (CbC) reporting under BEPS Action 13 has mandated MNEs with revenues exceeding certain thresholds (e.g., €750 million) to provide granular data on their global income, taxes paid, and business activities, directly fueling demand for specialized Tax Compliance Software Market solutions and expert Financial Advisory Services Market to navigate these intricate rules. The evolving nature of these regulations necessitates continuous advisory and compliance support.
Globalization and Digitalization of Business Operations: The expansion of MNEs into new international markets and the increasing reliance on digital business models have dramatically amplified the volume and complexity of cross-border intercompany transactions. These transactions, often involving intangible assets, digital services, and complex supply chains, present unique challenges for accurate transfer pricing. As of 2023, a significant portion of global trade involves intra-company transfers, making robust transfer pricing policies essential. The proliferation of digital services and the associated tax challenges for the Digital Transformation Services Market further complicate traditional transfer pricing methods, pushing companies to seek advanced advisory services to develop defensible strategies and avoid disputes with tax authorities.
Market Constraints:
High Cost of Specialized Services: The highly specialized nature of transfer pricing requires significant expertise, often involving economists, tax lawyers, and industry specialists. This specialization translates into premium service fees, which can be a substantial burden, especially for Small & Medium Enterprises (SMEs) with limited budgets. The cost of advanced software solutions and ongoing advisory engagements can deter smaller players from fully investing in proactive transfer pricing strategies, potentially exposing them to higher compliance risks in the long run. The need for continuous monitoring and updating of policies in line with evolving regulations also adds to the sustained cost pressure for businesses.
Shortage of Skilled Professionals: The intricate and constantly evolving nature of transfer pricing creates a persistent demand for highly skilled professionals. There is a global talent gap for individuals with the combined expertise in international tax law, economics, accounting, and industry-specific knowledge required to handle complex transfer pricing cases. This shortage can lead to increased competition for talent, driving up labor costs for service providers and potentially limiting their capacity to serve a growing client base, thereby acting as a constraint on market growth and accessibility.
Competitive Ecosystem of Transfer Pricing Tax Service Market
The Transfer Pricing Tax Service Market is characterized by a dynamic competitive landscape, dominated by global accounting and advisory giants, alongside specialized tax consultancies and technology providers. The market's competitive intensity is high, driven by the complexity of regulatory environments and the critical need for specialized expertise.
- PwC: A global leader in assurance, tax, and advisory services, PwC offers extensive transfer pricing services, including strategic planning, compliance, risk management, and dispute resolution, leveraging its vast international network and deep industry knowledge.
- EY: Recognized for its comprehensive tax services, EY provides robust transfer pricing advice, focusing on value chain transformation, operational transfer pricing, and digital tools to help clients manage complex intercompany transactions and navigate global regulations.
- Deloitte: As one of the 'Big Four' professional services networks, Deloitte offers integrated transfer pricing solutions covering planning, documentation, implementation, and controversy management, supported by its strong analytical capabilities and global footprint.
- KPMG: KPMG's transfer pricing practice delivers tailored solutions for multinational corporations, emphasizing tax authority relations, dispute resolution, and economic analysis to establish and defend arm's length prices across various jurisdictions.
- RSM International: A leading global network of independent audit, tax, and consulting firms, RSM provides mid-market focused transfer pricing services, helping clients develop practical and defensible strategies for their cross-border operations.
- Crowe: Crowe offers comprehensive international tax services, including transfer pricing planning, documentation, and controversy support, aiming to minimize tax risks and optimize the global tax position for businesses.
- Grant Thornton: Grant Thornton provides practical transfer pricing advice to a diverse client base, focusing on aligning intercompany transactions with business substance and ensuring compliance with evolving international tax standards.
- Cherry Bekaert: This firm offers specialized transfer pricing expertise, assisting companies with strategic planning, compliance documentation, and risk mitigation, particularly for those with complex global supply chains.
- BDO: BDO's transfer pricing team delivers strategic and practical advice, helping MNEs design and implement transfer pricing policies that are robust, defensible, and aligned with their business objectives.
- CohnReznick: A national advisory, assurance, and tax firm, CohnReznick provides transfer pricing services that assist clients in navigating international tax complexities and ensuring compliance with global regulations.
- CBIZ: CBIZ offers a range of tax and advisory services, including transfer pricing consulting, focused on helping businesses optimize their international tax structures and mitigate compliance risks.
- CliftonLarsonAllen (CLA): CLA provides integrated wealth advisory, outsourcing, audit, tax, and consulting services, with a focus on assisting clients with complex transfer pricing matters and international tax planning.
- EisnerAmper: EisnerAmper delivers comprehensive transfer pricing services, helping businesses develop and implement effective strategies, prepare robust documentation, and address controversy issues.
- Moss Adams: As one of the largest accounting and consulting firms in the nation, Moss Adams offers specialized transfer pricing services to help companies manage their international tax exposure and comply with global regulations.
- Kroll: Kroll provides independent valuations and financial advisory services crucial for transfer pricing, assisting clients in determining arm's length values for intercompany transactions involving complex assets and businesses.
- Tax Consultants International: This firm specializes in international tax advisory, including comprehensive transfer pricing services tailored to the specific needs of multinational businesses across various sectors.
- Thomson Reuters: A global provider of business information and solutions, Thomson Reuters offers technology-driven transfer pricing tools and software, enabling companies to manage their documentation and compliance efficiently.
- HLS Global: HLS Global specializes in providing international tax and transfer pricing services, assisting businesses with strategic planning, compliance, and controversy resolution across multiple jurisdictions.
Recent Developments & Milestones in Transfer Pricing Tax Service Market
Recent developments in the Transfer Pricing Tax Service Market underscore a period of heightened regulatory activity, technological integration, and strategic realignments by service providers.
- January 2024: The OECD advanced its work on the implementation of Pillar One and Pillar Two initiatives, particularly focusing on administrative and technical aspects. This global movement is driving MNEs to proactively re-evaluate and adjust their transfer pricing policies to align with potential new taxing rights and global minimum tax rules, spurring demand for forward-looking advisory services.
- September 2023: Several leading tax advisory firms announced strategic partnerships with Regulatory Technology Market (RegTech) providers. These collaborations aim to enhance automated compliance solutions for transfer pricing documentation, enabling faster data processing, improved accuracy, and real-time risk assessment, thereby streamlining complex reporting requirements.
- June 2023: Emerging economies, including several in Southeast Asia and Africa, introduced or significantly updated their country-specific transfer pricing documentation requirements. These changes have increased the compliance burden for MNEs operating in these regions, necessitating more localized expertise and customized advisory services to navigate the new regulations effectively.
- April 2023: Major Enterprise Software Market vendors began integrating advanced AI-driven analytics and machine learning capabilities into their tax modules. These enhancements offer MNEs sophisticated tools for intercompany transaction analysis, risk identification, and scenario planning, promising greater efficiency and defensibility in transfer pricing strategies.
- February 2023: A prominent tax authority published revised guidance on transfer pricing for digital services, specifically addressing issues related to the allocation of profits from highly digitalized businesses. This development prompted MNEs in the technology and media sectors to review and adjust their existing transfer pricing models for digital transactions, influencing methodologies for intangible asset valuation and profit attribution.
Regional Market Breakdown for Transfer Pricing Tax Service Market
The Global Transfer Pricing Tax Service Market exhibits significant regional variations in terms of maturity, growth drivers, and market share, reflecting diverse regulatory environments and economic dynamics. Analyzing key regions provides insight into distinct opportunities and challenges.
North America holds the largest revenue share in the Transfer Pricing Tax Service Market. This dominance is attributed to the presence of a vast number of large multinational corporations, highly sophisticated and stringent tax regulatory frameworks (e.g., U.S. Section 482 regulations), and a proactive approach to tax risk management. The market here is mature, experiencing steady growth driven by ongoing regulatory updates, increased audit activity by tax authorities like the IRS, and the continuous demand for strategic tax planning and dispute resolution services. The region consistently adopts advanced analytical tools and technology-driven solutions for transfer pricing compliance.
Europe represents another substantial segment of the market, driven by the complex interplay of national tax laws within the European Union and the widespread implementation of OECD's BEPS recommendations across member states. The diverse regulatory landscape necessitates extensive cross-border transfer pricing expertise, particularly for companies managing intricate intra-EU supply chains. The region shows robust demand for services related to value chain optimization and controversy management, with a strong emphasis on achieving consistency across multiple jurisdictions. The demand for BFSI IT Services Market and Manufacturing IT Services Market is particularly high in European economic hubs, as these sectors navigate complex intercompany financial and production flows.
Asia Pacific is recognized as the fastest-growing region in the Transfer Pricing Tax Service Market, exhibiting the highest CAGR during the forecast period. This rapid expansion is fueled by the robust economic growth, increasing foreign direct investment, and the growing number of local companies expanding their operations internationally. Countries like China, India, Japan, and South Korea are actively developing and enforcing their transfer pricing regulations, aligning with global standards. The region's evolving tax regimes and the increasing sophistication of local tax authorities are driving a surge in demand for both compliance and advisory services, as MNEs seek to establish defensible transfer pricing policies in a dynamic environment. The surge in digitalization and cross-border e-commerce activities also contributes to the growth, particularly in sectors requiring intricate international tax planning.
Middle East & Africa currently holds a smaller market share but demonstrates significant growth potential. This region is witnessing economic diversification efforts, the introduction of corporate tax regimes in countries historically reliant on oil revenues (e.g., GCC nations), and the development of nascent yet increasingly stringent tax regulatory frameworks. As local and international businesses expand their operations and integrate into global supply chains, the demand for foundational transfer pricing advice, documentation, and implementation support is rapidly accelerating. This emerging market is characterized by a strong need for capacity building and education on transfer pricing principles, representing a substantial long-term opportunity for service providers.

Transfer Pricing Tax Service Regional Market Share
Pricing Dynamics & Margin Pressure in Transfer Pricing Tax Service Market
The pricing dynamics in the Transfer Pricing Tax Service Market are largely influenced by the highly specialized nature of the services, the complexity of regulatory environments, and the brand reputation of service providers. Average selling prices (ASPs) for transfer pricing services tend to be at a premium, reflecting the deep expertise required in international tax law, economics, and industry-specific nuances. Pricing models typically vary from project-based fees for specific documentation or advisory assignments to retainer-based arrangements for ongoing compliance and strategic support. Tiered pricing is common, with basic compliance and documentation services being more standardized, while complex strategic advisory, value chain optimization, or dispute resolution services command significantly higher rates.
Margin structures across the value chain are generally healthy for top-tier advisory firms, who benefit from their established brand, extensive global networks, and ability to handle high-stakes cases. However, the market is experiencing increasing margin pressure from several directions. Clients, particularly large enterprises, are seeking greater cost efficiency and transparency in billing, driving service providers to optimize their delivery models. The proliferation of automated Business Process Outsourcing Market solutions and Tax Compliance Software Market tools is also exerting downward pressure on the pricing of routine compliance tasks, as technology can handle these more efficiently and at a lower cost. This forces firms to differentiate by focusing on higher-value strategic advice and complex problem-solving.
Key cost levers for service providers include talent acquisition and retention, as skilled transfer pricing professionals are in high demand and command competitive salaries. Investments in technology, such as AI-driven analytics and specialized software, are also significant cost factors but are crucial for improving efficiency and delivering innovative solutions. Competitive intensity, especially among the "Big Four" accounting firms and other major consultancies, further contributes to margin pressure, as firms compete for lucrative engagements. Niche players, while potentially offering more tailored services at competitive rates, also face challenges in scaling their operations and maintaining broad market visibility.
Regulatory & Policy Landscape Shaping Transfer Pricing Tax Service Market
The Transfer Pricing Tax Service Market is profoundly shaped by an intricate and ever-evolving regulatory and policy landscape. The primary international framework is the OECD Transfer Pricing Guidelines for Multinational Enterprises and Tax Administrations, which provides detailed guidance on the application of the arm's length principle. This guideline forms the bedrock for most national transfer pricing regulations worldwide.
A pivotal development over the past decade has been the OECD/G20 Base Erosion and Profit Shifting (BEPS) Project. Key BEPS Actions, particularly Actions 8-10 (Aligning Transfer Pricing Outcomes with Value Creation) and Action 13 (Guidance on Transfer Pricing Documentation and Country-by-Country Reporting), have fundamentally reshaped global transfer pricing practices. Action 13 mandates a three-tiered documentation structure—Master File, Local File, and Country-by-Country (CbC) Report—significantly increasing transparency and compliance burdens for multinational enterprises (MNEs).
More recently, the ongoing work on Pillar One (addressing the taxation of the digital economy) and Pillar Two (introducing a global minimum corporate tax rate, often referred to as GloBE Rules) under the OECD's Inclusive Framework on BEPS is poised to introduce the most significant changes to international corporate taxation in a century. Pillar Two, in particular, will introduce new rules that could impact the effective tax rates of MNEs, necessitating a re-evaluation of existing transfer pricing policies to avoid top-up taxes. These impending changes will have a monumental impact on the Financial Advisory Services Market as companies seek guidance to restructure their operations and pricing models.
Major regulatory bodies like the OECD and the United Nations (through its Practical Manual on Transfer Pricing for Developing Countries) continue to influence the global policy narrative. At the national level, countries are continuously updating their domestic tax laws and regulations to align with international standards and address local specificities. Examples include the U.S. Treasury Regulations Section 482, various EU directives, and specific tax acts in emerging economies. Recent policy changes, such as the gradual implementation of Pillar Two, the increased focus on substance over form in intercompany transactions, and the rising prominence of Advanced Pricing Agreements (APAs) for certainty, are driving demand for sophisticated advisory and compliance services. The impact of these policies is manifold: they increase the complexity of tax planning, heighten the risk of disputes, and necessitate proactive engagement with tax authorities, thereby ensuring sustained growth for the Transfer Pricing Tax Service Market.
Transfer Pricing Tax Service Segmentation
-
1. Service Type
- 1.1. Advisory & Value Chain Optimisation
- 1.2. Compliance & Documentation
- 1.3. Implementation & Compliance Management
- 1.4. Controversy & Dispute Resolution
- 1.5. Others
-
2. Enterprise Size
- 2.1. Large Enterprises
- 2.2. Small & Medium Enterprises (SMEs)
-
3. Geographical Scope
- 3.1. Domestic
- 3.2. Cross-Border
-
4. End User Industry
- 4.1. BFSI
- 4.2. Information Technology & Telecom
- 4.3. Manufacturing
- 4.4. Healthcare & Pharmaceuticals
- 4.5. Retail & E-commerce
- 4.6. Energy & Utilities
- 4.7. Automotive
- 4.8. Consumer Goods
- 4.9. Others
Transfer Pricing Tax Service Segmentation By Geography
-
1. North America
- 1.1. United States
- 1.2. Canada
- 1.3. Mexico
-
2. South America
- 2.1. Brazil
- 2.2. Argentina
- 2.3. Rest of South America
-
3. Europe
- 3.1. United Kingdom
- 3.2. Germany
- 3.3. France
- 3.4. Italy
- 3.5. Spain
- 3.6. Russia
- 3.7. Benelux
- 3.8. Nordics
- 3.9. Rest of Europe
-
4. Middle East & Africa
- 4.1. Turkey
- 4.2. Israel
- 4.3. GCC
- 4.4. North Africa
- 4.5. South Africa
- 4.6. Rest of Middle East & Africa
-
5. Asia Pacific
- 5.1. China
- 5.2. India
- 5.3. Japan
- 5.4. South Korea
- 5.5. ASEAN
- 5.6. Oceania
- 5.7. Rest of Asia Pacific
Transfer Pricing Tax Service Regional Market Share
Geographic Coverage of Transfer Pricing Tax Service
Transfer Pricing Tax Service REPORT HIGHLIGHTS
| Aspects | Details |
|---|---|
| Study Period | 2020-2034 |
| Base Year | 2025 |
| Estimated Year | 2026 |
| Forecast Period | 2026-2034 |
| Historical Period | 2020-2025 |
| Growth Rate | CAGR of 6.52% from 2020-2034 |
| Segmentation |
|
Table of Contents
- 1. Introduction
- 1.1. Research Scope
- 1.2. Market Segmentation
- 1.3. Research Objective
- 1.4. Definitions and Assumptions
- 2. Executive Summary
- 2.1. Market Snapshot
- 3. Market Dynamics
- 3.1. Market Drivers
- 3.2. Market Restrains
- 3.3. Market Trends
- 3.4. Market Opportunities
- 4. Market Factor Analysis
- 4.1. Porters Five Forces
- 4.1.1. Bargaining Power of Suppliers
- 4.1.2. Bargaining Power of Buyers
- 4.1.3. Threat of New Entrants
- 4.1.4. Threat of Substitutes
- 4.1.5. Competitive Rivalry
- 4.2. PESTEL analysis
- 4.3. BCG Analysis
- 4.3.1. Stars (High Growth, High Market Share)
- 4.3.2. Cash Cows (Low Growth, High Market Share)
- 4.3.3. Question Mark (High Growth, Low Market Share)
- 4.3.4. Dogs (Low Growth, Low Market Share)
- 4.4. Ansoff Matrix Analysis
- 4.5. Supply Chain Analysis
- 4.6. Regulatory Landscape
- 4.7. Current Market Potential and Opportunity Assessment (TAM–SAM–SOM Framework)
- 4.8. IMR Analyst Note
- 4.1. Porters Five Forces
- 5. Market Analysis, Insights and Forecast 2021-2033
- 5.1. Market Analysis, Insights and Forecast - by Service Type
- 5.1.1. Advisory & Value Chain Optimisation
- 5.1.2. Compliance & Documentation
- 5.1.3. Implementation & Compliance Management
- 5.1.4. Controversy & Dispute Resolution
- 5.1.5. Others
- 5.2. Market Analysis, Insights and Forecast - by Enterprise Size
- 5.2.1. Large Enterprises
- 5.2.2. Small & Medium Enterprises (SMEs)
- 5.3. Market Analysis, Insights and Forecast - by Geographical Scope
- 5.3.1. Domestic
- 5.3.2. Cross-Border
- 5.4. Market Analysis, Insights and Forecast - by End User Industry
- 5.4.1. BFSI
- 5.4.2. Information Technology & Telecom
- 5.4.3. Manufacturing
- 5.4.4. Healthcare & Pharmaceuticals
- 5.4.5. Retail & E-commerce
- 5.4.6. Energy & Utilities
- 5.4.7. Automotive
- 5.4.8. Consumer Goods
- 5.4.9. Others
- 5.5. Market Analysis, Insights and Forecast - by Region
- 5.5.1. North America
- 5.5.2. South America
- 5.5.3. Europe
- 5.5.4. Middle East & Africa
- 5.5.5. Asia Pacific
- 5.1. Market Analysis, Insights and Forecast - by Service Type
- 6. Global Transfer Pricing Tax Service Analysis, Insights and Forecast, 2021-2033
- 6.1. Market Analysis, Insights and Forecast - by Service Type
- 6.1.1. Advisory & Value Chain Optimisation
- 6.1.2. Compliance & Documentation
- 6.1.3. Implementation & Compliance Management
- 6.1.4. Controversy & Dispute Resolution
- 6.1.5. Others
- 6.2. Market Analysis, Insights and Forecast - by Enterprise Size
- 6.2.1. Large Enterprises
- 6.2.2. Small & Medium Enterprises (SMEs)
- 6.3. Market Analysis, Insights and Forecast - by Geographical Scope
- 6.3.1. Domestic
- 6.3.2. Cross-Border
- 6.4. Market Analysis, Insights and Forecast - by End User Industry
- 6.4.1. BFSI
- 6.4.2. Information Technology & Telecom
- 6.4.3. Manufacturing
- 6.4.4. Healthcare & Pharmaceuticals
- 6.4.5. Retail & E-commerce
- 6.4.6. Energy & Utilities
- 6.4.7. Automotive
- 6.4.8. Consumer Goods
- 6.4.9. Others
- 6.1. Market Analysis, Insights and Forecast - by Service Type
- 7. North America Transfer Pricing Tax Service Analysis, Insights and Forecast, 2020-2032
- 7.1. Market Analysis, Insights and Forecast - by Service Type
- 7.1.1. Advisory & Value Chain Optimisation
- 7.1.2. Compliance & Documentation
- 7.1.3. Implementation & Compliance Management
- 7.1.4. Controversy & Dispute Resolution
- 7.1.5. Others
- 7.2. Market Analysis, Insights and Forecast - by Enterprise Size
- 7.2.1. Large Enterprises
- 7.2.2. Small & Medium Enterprises (SMEs)
- 7.3. Market Analysis, Insights and Forecast - by Geographical Scope
- 7.3.1. Domestic
- 7.3.2. Cross-Border
- 7.4. Market Analysis, Insights and Forecast - by End User Industry
- 7.4.1. BFSI
- 7.4.2. Information Technology & Telecom
- 7.4.3. Manufacturing
- 7.4.4. Healthcare & Pharmaceuticals
- 7.4.5. Retail & E-commerce
- 7.4.6. Energy & Utilities
- 7.4.7. Automotive
- 7.4.8. Consumer Goods
- 7.4.9. Others
- 7.1. Market Analysis, Insights and Forecast - by Service Type
- 8. South America Transfer Pricing Tax Service Analysis, Insights and Forecast, 2020-2032
- 8.1. Market Analysis, Insights and Forecast - by Service Type
- 8.1.1. Advisory & Value Chain Optimisation
- 8.1.2. Compliance & Documentation
- 8.1.3. Implementation & Compliance Management
- 8.1.4. Controversy & Dispute Resolution
- 8.1.5. Others
- 8.2. Market Analysis, Insights and Forecast - by Enterprise Size
- 8.2.1. Large Enterprises
- 8.2.2. Small & Medium Enterprises (SMEs)
- 8.3. Market Analysis, Insights and Forecast - by Geographical Scope
- 8.3.1. Domestic
- 8.3.2. Cross-Border
- 8.4. Market Analysis, Insights and Forecast - by End User Industry
- 8.4.1. BFSI
- 8.4.2. Information Technology & Telecom
- 8.4.3. Manufacturing
- 8.4.4. Healthcare & Pharmaceuticals
- 8.4.5. Retail & E-commerce
- 8.4.6. Energy & Utilities
- 8.4.7. Automotive
- 8.4.8. Consumer Goods
- 8.4.9. Others
- 8.1. Market Analysis, Insights and Forecast - by Service Type
- 9. Europe Transfer Pricing Tax Service Analysis, Insights and Forecast, 2020-2032
- 9.1. Market Analysis, Insights and Forecast - by Service Type
- 9.1.1. Advisory & Value Chain Optimisation
- 9.1.2. Compliance & Documentation
- 9.1.3. Implementation & Compliance Management
- 9.1.4. Controversy & Dispute Resolution
- 9.1.5. Others
- 9.2. Market Analysis, Insights and Forecast - by Enterprise Size
- 9.2.1. Large Enterprises
- 9.2.2. Small & Medium Enterprises (SMEs)
- 9.3. Market Analysis, Insights and Forecast - by Geographical Scope
- 9.3.1. Domestic
- 9.3.2. Cross-Border
- 9.4. Market Analysis, Insights and Forecast - by End User Industry
- 9.4.1. BFSI
- 9.4.2. Information Technology & Telecom
- 9.4.3. Manufacturing
- 9.4.4. Healthcare & Pharmaceuticals
- 9.4.5. Retail & E-commerce
- 9.4.6. Energy & Utilities
- 9.4.7. Automotive
- 9.4.8. Consumer Goods
- 9.4.9. Others
- 9.1. Market Analysis, Insights and Forecast - by Service Type
- 10. Middle East & Africa Transfer Pricing Tax Service Analysis, Insights and Forecast, 2020-2032
- 10.1. Market Analysis, Insights and Forecast - by Service Type
- 10.1.1. Advisory & Value Chain Optimisation
- 10.1.2. Compliance & Documentation
- 10.1.3. Implementation & Compliance Management
- 10.1.4. Controversy & Dispute Resolution
- 10.1.5. Others
- 10.2. Market Analysis, Insights and Forecast - by Enterprise Size
- 10.2.1. Large Enterprises
- 10.2.2. Small & Medium Enterprises (SMEs)
- 10.3. Market Analysis, Insights and Forecast - by Geographical Scope
- 10.3.1. Domestic
- 10.3.2. Cross-Border
- 10.4. Market Analysis, Insights and Forecast - by End User Industry
- 10.4.1. BFSI
- 10.4.2. Information Technology & Telecom
- 10.4.3. Manufacturing
- 10.4.4. Healthcare & Pharmaceuticals
- 10.4.5. Retail & E-commerce
- 10.4.6. Energy & Utilities
- 10.4.7. Automotive
- 10.4.8. Consumer Goods
- 10.4.9. Others
- 10.1. Market Analysis, Insights and Forecast - by Service Type
- 11. Asia Pacific Transfer Pricing Tax Service Analysis, Insights and Forecast, 2020-2032
- 11.1. Market Analysis, Insights and Forecast - by Service Type
- 11.1.1. Advisory & Value Chain Optimisation
- 11.1.2. Compliance & Documentation
- 11.1.3. Implementation & Compliance Management
- 11.1.4. Controversy & Dispute Resolution
- 11.1.5. Others
- 11.2. Market Analysis, Insights and Forecast - by Enterprise Size
- 11.2.1. Large Enterprises
- 11.2.2. Small & Medium Enterprises (SMEs)
- 11.3. Market Analysis, Insights and Forecast - by Geographical Scope
- 11.3.1. Domestic
- 11.3.2. Cross-Border
- 11.4. Market Analysis, Insights and Forecast - by End User Industry
- 11.4.1. BFSI
- 11.4.2. Information Technology & Telecom
- 11.4.3. Manufacturing
- 11.4.4. Healthcare & Pharmaceuticals
- 11.4.5. Retail & E-commerce
- 11.4.6. Energy & Utilities
- 11.4.7. Automotive
- 11.4.8. Consumer Goods
- 11.4.9. Others
- 11.1. Market Analysis, Insights and Forecast - by Service Type
- 12. Competitive Analysis
- 12.1. Company Profiles
- 12.1.1 PwC
- 12.1.1.1. Company Overview
- 12.1.1.2. Products
- 12.1.1.3. Company Financials
- 12.1.1.4. SWOT Analysis
- 12.1.2 EY
- 12.1.2.1. Company Overview
- 12.1.2.2. Products
- 12.1.2.3. Company Financials
- 12.1.2.4. SWOT Analysis
- 12.1.3 Deloitte
- 12.1.3.1. Company Overview
- 12.1.3.2. Products
- 12.1.3.3. Company Financials
- 12.1.3.4. SWOT Analysis
- 12.1.4 KPMG
- 12.1.4.1. Company Overview
- 12.1.4.2. Products
- 12.1.4.3. Company Financials
- 12.1.4.4. SWOT Analysis
- 12.1.5 RSM International
- 12.1.5.1. Company Overview
- 12.1.5.2. Products
- 12.1.5.3. Company Financials
- 12.1.5.4. SWOT Analysis
- 12.1.6 Crowe
- 12.1.6.1. Company Overview
- 12.1.6.2. Products
- 12.1.6.3. Company Financials
- 12.1.6.4. SWOT Analysis
- 12.1.7 Grant Thornton
- 12.1.7.1. Company Overview
- 12.1.7.2. Products
- 12.1.7.3. Company Financials
- 12.1.7.4. SWOT Analysis
- 12.1.8 Cherry Bekaert
- 12.1.8.1. Company Overview
- 12.1.8.2. Products
- 12.1.8.3. Company Financials
- 12.1.8.4. SWOT Analysis
- 12.1.9 BDO
- 12.1.9.1. Company Overview
- 12.1.9.2. Products
- 12.1.9.3. Company Financials
- 12.1.9.4. SWOT Analysis
- 12.1.10 CohnReznick
- 12.1.10.1. Company Overview
- 12.1.10.2. Products
- 12.1.10.3. Company Financials
- 12.1.10.4. SWOT Analysis
- 12.1.11 CBIZ
- 12.1.11.1. Company Overview
- 12.1.11.2. Products
- 12.1.11.3. Company Financials
- 12.1.11.4. SWOT Analysis
- 12.1.12 CliftonLarsonAllen (CLA)
- 12.1.12.1. Company Overview
- 12.1.12.2. Products
- 12.1.12.3. Company Financials
- 12.1.12.4. SWOT Analysis
- 12.1.13 EisnerAmper
- 12.1.13.1. Company Overview
- 12.1.13.2. Products
- 12.1.13.3. Company Financials
- 12.1.13.4. SWOT Analysis
- 12.1.14 Moss Adams
- 12.1.14.1. Company Overview
- 12.1.14.2. Products
- 12.1.14.3. Company Financials
- 12.1.14.4. SWOT Analysis
- 12.1.15 Kroll
- 12.1.15.1. Company Overview
- 12.1.15.2. Products
- 12.1.15.3. Company Financials
- 12.1.15.4. SWOT Analysis
- 12.1.16 Tax Consultants International
- 12.1.16.1. Company Overview
- 12.1.16.2. Products
- 12.1.16.3. Company Financials
- 12.1.16.4. SWOT Analysis
- 12.1.17 Thomson Reuters
- 12.1.17.1. Company Overview
- 12.1.17.2. Products
- 12.1.17.3. Company Financials
- 12.1.17.4. SWOT Analysis
- 12.1.18 HLS Global
- 12.1.18.1. Company Overview
- 12.1.18.2. Products
- 12.1.18.3. Company Financials
- 12.1.18.4. SWOT Analysis
- 12.1.1 PwC
- 12.2. Market Entropy
- 12.2.1 Company's Key Areas Served
- 12.2.2 Recent Developments
- 12.3. Company Market Share Analysis 2025
- 12.3.1 Top 5 Companies Market Share Analysis
- 12.3.2 Top 3 Companies Market Share Analysis
- 12.4. List of Potential Customers
- 13. Research Methodology
List of Figures
- Figure 1: Global Transfer Pricing Tax Service Revenue Breakdown (billion, %) by Region 2025 & 2033
- Figure 2: North America Transfer Pricing Tax Service Revenue (billion), by Service Type 2025 & 2033
- Figure 3: North America Transfer Pricing Tax Service Revenue Share (%), by Service Type 2025 & 2033
- Figure 4: North America Transfer Pricing Tax Service Revenue (billion), by Enterprise Size 2025 & 2033
- Figure 5: North America Transfer Pricing Tax Service Revenue Share (%), by Enterprise Size 2025 & 2033
- Figure 6: North America Transfer Pricing Tax Service Revenue (billion), by Geographical Scope 2025 & 2033
- Figure 7: North America Transfer Pricing Tax Service Revenue Share (%), by Geographical Scope 2025 & 2033
- Figure 8: North America Transfer Pricing Tax Service Revenue (billion), by End User Industry 2025 & 2033
- Figure 9: North America Transfer Pricing Tax Service Revenue Share (%), by End User Industry 2025 & 2033
- Figure 10: North America Transfer Pricing Tax Service Revenue (billion), by Country 2025 & 2033
- Figure 11: North America Transfer Pricing Tax Service Revenue Share (%), by Country 2025 & 2033
- Figure 12: South America Transfer Pricing Tax Service Revenue (billion), by Service Type 2025 & 2033
- Figure 13: South America Transfer Pricing Tax Service Revenue Share (%), by Service Type 2025 & 2033
- Figure 14: South America Transfer Pricing Tax Service Revenue (billion), by Enterprise Size 2025 & 2033
- Figure 15: South America Transfer Pricing Tax Service Revenue Share (%), by Enterprise Size 2025 & 2033
- Figure 16: South America Transfer Pricing Tax Service Revenue (billion), by Geographical Scope 2025 & 2033
- Figure 17: South America Transfer Pricing Tax Service Revenue Share (%), by Geographical Scope 2025 & 2033
- Figure 18: South America Transfer Pricing Tax Service Revenue (billion), by End User Industry 2025 & 2033
- Figure 19: South America Transfer Pricing Tax Service Revenue Share (%), by End User Industry 2025 & 2033
- Figure 20: South America Transfer Pricing Tax Service Revenue (billion), by Country 2025 & 2033
- Figure 21: South America Transfer Pricing Tax Service Revenue Share (%), by Country 2025 & 2033
- Figure 22: Europe Transfer Pricing Tax Service Revenue (billion), by Service Type 2025 & 2033
- Figure 23: Europe Transfer Pricing Tax Service Revenue Share (%), by Service Type 2025 & 2033
- Figure 24: Europe Transfer Pricing Tax Service Revenue (billion), by Enterprise Size 2025 & 2033
- Figure 25: Europe Transfer Pricing Tax Service Revenue Share (%), by Enterprise Size 2025 & 2033
- Figure 26: Europe Transfer Pricing Tax Service Revenue (billion), by Geographical Scope 2025 & 2033
- Figure 27: Europe Transfer Pricing Tax Service Revenue Share (%), by Geographical Scope 2025 & 2033
- Figure 28: Europe Transfer Pricing Tax Service Revenue (billion), by End User Industry 2025 & 2033
- Figure 29: Europe Transfer Pricing Tax Service Revenue Share (%), by End User Industry 2025 & 2033
- Figure 30: Europe Transfer Pricing Tax Service Revenue (billion), by Country 2025 & 2033
- Figure 31: Europe Transfer Pricing Tax Service Revenue Share (%), by Country 2025 & 2033
- Figure 32: Middle East & Africa Transfer Pricing Tax Service Revenue (billion), by Service Type 2025 & 2033
- Figure 33: Middle East & Africa Transfer Pricing Tax Service Revenue Share (%), by Service Type 2025 & 2033
- Figure 34: Middle East & Africa Transfer Pricing Tax Service Revenue (billion), by Enterprise Size 2025 & 2033
- Figure 35: Middle East & Africa Transfer Pricing Tax Service Revenue Share (%), by Enterprise Size 2025 & 2033
- Figure 36: Middle East & Africa Transfer Pricing Tax Service Revenue (billion), by Geographical Scope 2025 & 2033
- Figure 37: Middle East & Africa Transfer Pricing Tax Service Revenue Share (%), by Geographical Scope 2025 & 2033
- Figure 38: Middle East & Africa Transfer Pricing Tax Service Revenue (billion), by End User Industry 2025 & 2033
- Figure 39: Middle East & Africa Transfer Pricing Tax Service Revenue Share (%), by End User Industry 2025 & 2033
- Figure 40: Middle East & Africa Transfer Pricing Tax Service Revenue (billion), by Country 2025 & 2033
- Figure 41: Middle East & Africa Transfer Pricing Tax Service Revenue Share (%), by Country 2025 & 2033
- Figure 42: Asia Pacific Transfer Pricing Tax Service Revenue (billion), by Service Type 2025 & 2033
- Figure 43: Asia Pacific Transfer Pricing Tax Service Revenue Share (%), by Service Type 2025 & 2033
- Figure 44: Asia Pacific Transfer Pricing Tax Service Revenue (billion), by Enterprise Size 2025 & 2033
- Figure 45: Asia Pacific Transfer Pricing Tax Service Revenue Share (%), by Enterprise Size 2025 & 2033
- Figure 46: Asia Pacific Transfer Pricing Tax Service Revenue (billion), by Geographical Scope 2025 & 2033
- Figure 47: Asia Pacific Transfer Pricing Tax Service Revenue Share (%), by Geographical Scope 2025 & 2033
- Figure 48: Asia Pacific Transfer Pricing Tax Service Revenue (billion), by End User Industry 2025 & 2033
- Figure 49: Asia Pacific Transfer Pricing Tax Service Revenue Share (%), by End User Industry 2025 & 2033
- Figure 50: Asia Pacific Transfer Pricing Tax Service Revenue (billion), by Country 2025 & 2033
- Figure 51: Asia Pacific Transfer Pricing Tax Service Revenue Share (%), by Country 2025 & 2033
List of Tables
- Table 1: Global Transfer Pricing Tax Service Revenue billion Forecast, by Service Type 2020 & 2033
- Table 2: Global Transfer Pricing Tax Service Revenue billion Forecast, by Enterprise Size 2020 & 2033
- Table 3: Global Transfer Pricing Tax Service Revenue billion Forecast, by Geographical Scope 2020 & 2033
- Table 4: Global Transfer Pricing Tax Service Revenue billion Forecast, by End User Industry 2020 & 2033
- Table 5: Global Transfer Pricing Tax Service Revenue billion Forecast, by Region 2020 & 2033
- Table 6: Global Transfer Pricing Tax Service Revenue billion Forecast, by Service Type 2020 & 2033
- Table 7: Global Transfer Pricing Tax Service Revenue billion Forecast, by Enterprise Size 2020 & 2033
- Table 8: Global Transfer Pricing Tax Service Revenue billion Forecast, by Geographical Scope 2020 & 2033
- Table 9: Global Transfer Pricing Tax Service Revenue billion Forecast, by End User Industry 2020 & 2033
- Table 10: Global Transfer Pricing Tax Service Revenue billion Forecast, by Country 2020 & 2033
- Table 11: United States Transfer Pricing Tax Service Revenue (billion) Forecast, by Application 2020 & 2033
- Table 12: Canada Transfer Pricing Tax Service Revenue (billion) Forecast, by Application 2020 & 2033
- Table 13: Mexico Transfer Pricing Tax Service Revenue (billion) Forecast, by Application 2020 & 2033
- Table 14: Global Transfer Pricing Tax Service Revenue billion Forecast, by Service Type 2020 & 2033
- Table 15: Global Transfer Pricing Tax Service Revenue billion Forecast, by Enterprise Size 2020 & 2033
- Table 16: Global Transfer Pricing Tax Service Revenue billion Forecast, by Geographical Scope 2020 & 2033
- Table 17: Global Transfer Pricing Tax Service Revenue billion Forecast, by End User Industry 2020 & 2033
- Table 18: Global Transfer Pricing Tax Service Revenue billion Forecast, by Country 2020 & 2033
- Table 19: Brazil Transfer Pricing Tax Service Revenue (billion) Forecast, by Application 2020 & 2033
- Table 20: Argentina Transfer Pricing Tax Service Revenue (billion) Forecast, by Application 2020 & 2033
- Table 21: Rest of South America Transfer Pricing Tax Service Revenue (billion) Forecast, by Application 2020 & 2033
- Table 22: Global Transfer Pricing Tax Service Revenue billion Forecast, by Service Type 2020 & 2033
- Table 23: Global Transfer Pricing Tax Service Revenue billion Forecast, by Enterprise Size 2020 & 2033
- Table 24: Global Transfer Pricing Tax Service Revenue billion Forecast, by Geographical Scope 2020 & 2033
- Table 25: Global Transfer Pricing Tax Service Revenue billion Forecast, by End User Industry 2020 & 2033
- Table 26: Global Transfer Pricing Tax Service Revenue billion Forecast, by Country 2020 & 2033
- Table 27: United Kingdom Transfer Pricing Tax Service Revenue (billion) Forecast, by Application 2020 & 2033
- Table 28: Germany Transfer Pricing Tax Service Revenue (billion) Forecast, by Application 2020 & 2033
- Table 29: France Transfer Pricing Tax Service Revenue (billion) Forecast, by Application 2020 & 2033
- Table 30: Italy Transfer Pricing Tax Service Revenue (billion) Forecast, by Application 2020 & 2033
- Table 31: Spain Transfer Pricing Tax Service Revenue (billion) Forecast, by Application 2020 & 2033
- Table 32: Russia Transfer Pricing Tax Service Revenue (billion) Forecast, by Application 2020 & 2033
- Table 33: Benelux Transfer Pricing Tax Service Revenue (billion) Forecast, by Application 2020 & 2033
- Table 34: Nordics Transfer Pricing Tax Service Revenue (billion) Forecast, by Application 2020 & 2033
- Table 35: Rest of Europe Transfer Pricing Tax Service Revenue (billion) Forecast, by Application 2020 & 2033
- Table 36: Global Transfer Pricing Tax Service Revenue billion Forecast, by Service Type 2020 & 2033
- Table 37: Global Transfer Pricing Tax Service Revenue billion Forecast, by Enterprise Size 2020 & 2033
- Table 38: Global Transfer Pricing Tax Service Revenue billion Forecast, by Geographical Scope 2020 & 2033
- Table 39: Global Transfer Pricing Tax Service Revenue billion Forecast, by End User Industry 2020 & 2033
- Table 40: Global Transfer Pricing Tax Service Revenue billion Forecast, by Country 2020 & 2033
- Table 41: Turkey Transfer Pricing Tax Service Revenue (billion) Forecast, by Application 2020 & 2033
- Table 42: Israel Transfer Pricing Tax Service Revenue (billion) Forecast, by Application 2020 & 2033
- Table 43: GCC Transfer Pricing Tax Service Revenue (billion) Forecast, by Application 2020 & 2033
- Table 44: North Africa Transfer Pricing Tax Service Revenue (billion) Forecast, by Application 2020 & 2033
- Table 45: South Africa Transfer Pricing Tax Service Revenue (billion) Forecast, by Application 2020 & 2033
- Table 46: Rest of Middle East & Africa Transfer Pricing Tax Service Revenue (billion) Forecast, by Application 2020 & 2033
- Table 47: Global Transfer Pricing Tax Service Revenue billion Forecast, by Service Type 2020 & 2033
- Table 48: Global Transfer Pricing Tax Service Revenue billion Forecast, by Enterprise Size 2020 & 2033
- Table 49: Global Transfer Pricing Tax Service Revenue billion Forecast, by Geographical Scope 2020 & 2033
- Table 50: Global Transfer Pricing Tax Service Revenue billion Forecast, by End User Industry 2020 & 2033
- Table 51: Global Transfer Pricing Tax Service Revenue billion Forecast, by Country 2020 & 2033
- Table 52: China Transfer Pricing Tax Service Revenue (billion) Forecast, by Application 2020 & 2033
- Table 53: India Transfer Pricing Tax Service Revenue (billion) Forecast, by Application 2020 & 2033
- Table 54: Japan Transfer Pricing Tax Service Revenue (billion) Forecast, by Application 2020 & 2033
- Table 55: South Korea Transfer Pricing Tax Service Revenue (billion) Forecast, by Application 2020 & 2033
- Table 56: ASEAN Transfer Pricing Tax Service Revenue (billion) Forecast, by Application 2020 & 2033
- Table 57: Oceania Transfer Pricing Tax Service Revenue (billion) Forecast, by Application 2020 & 2033
- Table 58: Rest of Asia Pacific Transfer Pricing Tax Service Revenue (billion) Forecast, by Application 2020 & 2033
Frequently Asked Questions
1. What is the projected Compound Annual Growth Rate (CAGR) of the Transfer Pricing Tax Service?
The projected CAGR is approximately 6.52%.
2. Which companies are prominent players in the Transfer Pricing Tax Service?
Key companies in the market include PwC, EY, Deloitte, KPMG, RSM International, Crowe, Grant Thornton, Cherry Bekaert, BDO, CohnReznick, CBIZ, CliftonLarsonAllen (CLA), EisnerAmper, Moss Adams, Kroll, Tax Consultants International, Thomson Reuters, HLS Global.
3. What are the main segments of the Transfer Pricing Tax Service?
The market segments include Service Type, Enterprise Size, Geographical Scope, End User Industry.
4. Can you provide details about the market size?
The market size is estimated to be USD 36.17 billion as of 2022.
5. What are some drivers contributing to market growth?
N/A
6. What are the notable trends driving market growth?
N/A
7. Are there any restraints impacting market growth?
N/A
8. Can you provide examples of recent developments in the market?
N/A
9. What pricing options are available for accessing the report?
Pricing options include single-user, multi-user, and enterprise licenses priced at USD 2900.00, USD 4350.00, and USD 5800.00 respectively.
10. Is the market size provided in terms of value or volume?
The market size is provided in terms of value, measured in billion.
11. Are there any specific market keywords associated with the report?
Yes, the market keyword associated with the report is "Transfer Pricing Tax Service," which aids in identifying and referencing the specific market segment covered.
12. How do I determine which pricing option suits my needs best?
The pricing options vary based on user requirements and access needs. Individual users may opt for single-user licenses, while businesses requiring broader access may choose multi-user or enterprise licenses for cost-effective access to the report.
13. Are there any additional resources or data provided in the Transfer Pricing Tax Service report?
While the report offers comprehensive insights, it's advisable to review the specific contents or supplementary materials provided to ascertain if additional resources or data are available.
14. How can I stay updated on further developments or reports in the Transfer Pricing Tax Service?
To stay informed about further developments, trends, and reports in the Transfer Pricing Tax Service, consider subscribing to industry newsletters, following relevant companies and organizations, or regularly checking reputable industry news sources and publications.
Methodology
Step 1 - Identification of Relevant Samples Size from Population Database


Step 2 - Approaches for Defining Global Market Size (Value, Volume* & Price*)

Note*: In applicable scenarios
Step 3 - Data Sources
Primary Research
- Web Analytics
- Survey Reports
- Research Institute
- Latest Research Reports
- Opinion Leaders
Secondary Research
- Annual Reports
- White Paper
- Latest Press Release
- Industry Association
- Paid Database
- Investor Presentations

Step 4 - Data Triangulation
Involves using different sources of information in order to increase the validity of a study
These sources are likely to be stakeholders in a program - participants, other researchers, program staff, other community members, and so on.
Then we put all data in single framework & apply various statistical tools to find out the dynamic on the market.
During the analysis stage, feedback from the stakeholder groups would be compared to determine areas of agreement as well as areas of divergence