

Key Insights
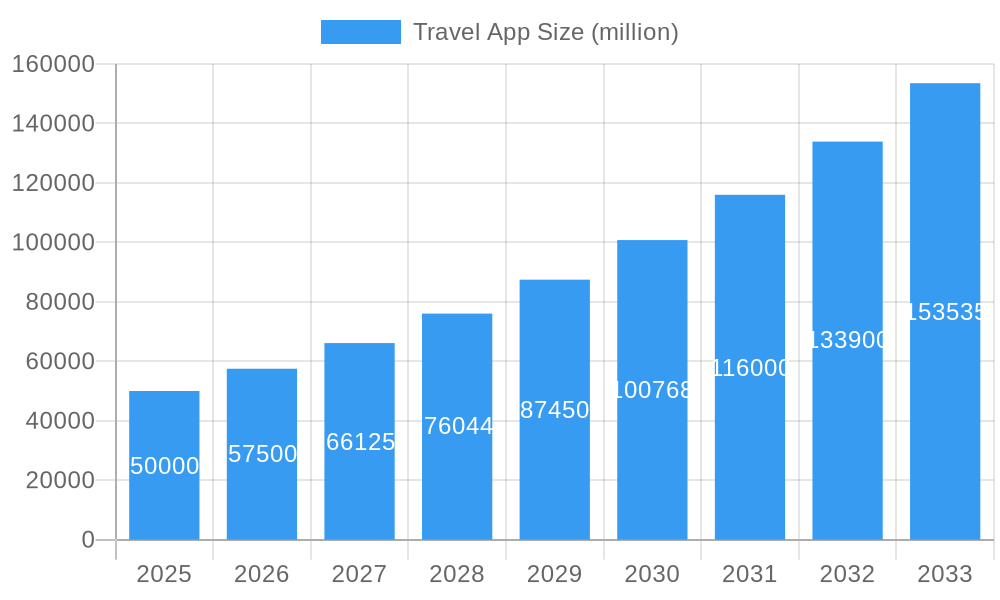
The global travel app market is experiencing robust growth, driven by increasing smartphone penetration, the rising popularity of mobile-first travel planning, and a surge in demand for personalized travel experiences. The market, estimated at $50 billion in 2025, is projected to witness a Compound Annual Growth Rate (CAGR) of 15% from 2025 to 2033, reaching approximately $150 billion by 2033. Key players like Airbnb, Booking Holdings, and Expedia Group are leveraging advanced technologies such as AI-powered recommendations and personalized itineraries to enhance user engagement and market share. Furthermore, the integration of ancillary services like flight and hotel booking within a single app streamlines the travel planning process, contributing to market expansion. Emerging trends like the increasing adoption of subscription models for travel services and the growing demand for sustainable and responsible travel options are further shaping the market landscape. While challenges such as data privacy concerns and the potential for disruptions caused by global events exist, the overall market outlook remains positive, indicating a substantial growth trajectory in the coming years.
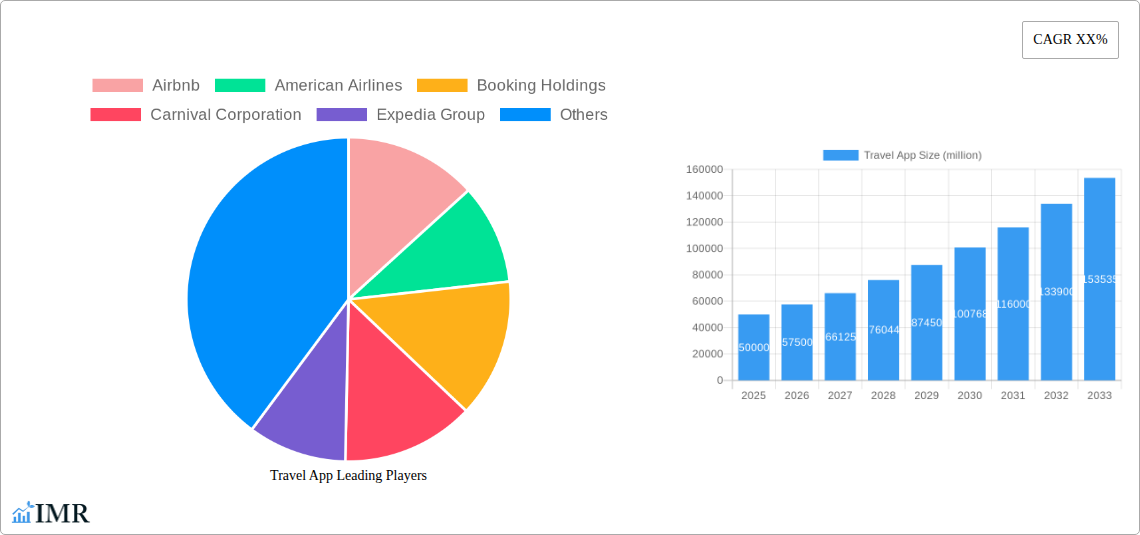
Travel App Market Size (In Billion)
The growth is fueled by several factors. Firstly, the increasing adoption of mobile technology globally is making travel apps indispensable for travelers. Secondly, the convenience offered by these apps, encompassing features such as flight and hotel bookings, car rentals, and activity planning within a single platform, significantly contributes to their appeal. Thirdly, the competitive landscape, with established players continually innovating and introducing new features, fosters market dynamism and growth. However, challenges such as the need for robust cybersecurity measures to protect user data and potential regulatory hurdles in different markets need to be addressed to ensure sustainable growth. The segment focusing on personalized travel recommendations and curated experiences is poised for significant growth, reflecting the increasing preference for tailored travel solutions. Regional variations in market growth are expected, with mature markets in North America and Europe likely to exhibit steady growth, while emerging economies in Asia and Latin America offer considerable untapped potential.
Travel App Company Market Share
Travel App Market Report: 2019-2033 - A Comprehensive Analysis
This comprehensive report provides an in-depth analysis of the global Travel App market, encompassing market dynamics, growth trends, regional dominance, product landscape, key challenges, emerging opportunities, and future outlook. The study period covers 2019-2033, with 2025 as the base and estimated year. This report is essential for industry professionals, investors, and strategic decision-makers seeking to understand and capitalize on the rapidly evolving travel technology landscape. The report includes detailed analysis of key players like Airbnb, American Airlines, Booking Holdings, Carnival Corporation, Expedia Group, Google, Lyft, feizhu, MakeMyTrip, Trainline, and ctrip, across various segments within the parent market of travel and tourism and child markets like airline ticketing and accommodation booking.
Travel App Market Dynamics & Structure
The global travel app market is characterized by intense competition, rapid technological advancements, and evolving regulatory landscapes. Market concentration is high, with a few dominant players commanding significant market share. The report analyzes the market structure, detailing the competitive intensity and the impact of mergers and acquisitions (M&A). Technological innovation, particularly in areas like AI-powered personalization and augmented reality, is a key driver of growth. However, data privacy concerns and regulatory hurdles pose significant challenges.
- Market Concentration: The top 5 players control an estimated xx% of the market in 2025 (Base year).
- M&A Activity: An estimated xx M&A deals occurred between 2019-2024, valued at approximately $xx billion.
- Technological Innovation Drivers: AI, AR/VR, Blockchain, and personalized recommendations.
- Regulatory Frameworks: Data privacy regulations (GDPR, CCPA) and antitrust concerns significantly impact market dynamics.
- Competitive Product Substitutes: Traditional travel agencies and booking websites pose a competitive threat.
- End-User Demographics: Millennials and Gen Z are the most active users of travel apps, driving growth in mobile-first travel booking.
Travel App Growth Trends & Insights
The global travel app market exhibited robust growth during the historical period (2019-2024), and this trend is projected to continue throughout the forecast period (2025-2033). Market size increased from $xx billion in 2019 to $xx billion in 2024. Adoption rates have significantly increased, driven by rising smartphone penetration and increasing consumer preference for convenience and cost-effectiveness. Technological disruptions, such as the rise of mobile payments and personalized travel recommendations, are transforming the consumer experience. A shift towards experiential travel and sustainable tourism is also influencing consumer behavior and app functionalities. The report presents a detailed analysis of the market size evolution, supported by historical and projected CAGR and market penetration metrics.
Dominant Regions, Countries, or Segments in Travel App
North America and Asia-Pacific currently dominate the travel app market, driven by factors such as high smartphone penetration, robust internet infrastructure, and a large base of tech-savvy travelers. Within these regions, specific countries like the USA, China, and India exhibit exceptionally high growth potential. The report provides a comprehensive regional and segmental analysis, highlighting key drivers for each region and segment.
- North America: High disposable incomes, advanced technological infrastructure, and early adoption of travel apps.
- Asia-Pacific: Rapidly growing middle class, increasing smartphone penetration, and the rise of mobile-first travel booking.
- Europe: Strong tourism sector, but growth is influenced by economic and political factors.
- Key Segments: Airline Ticketing, Hotel Booking, Car Rental, Tour & Activity Booking, and Package Deals are major segments driving the market.
Travel App Product Landscape
Travel apps are increasingly incorporating advanced features like AI-powered personalized recommendations, augmented reality experiences for destination exploration, and seamless integration with other travel services. Unique selling propositions revolve around user experience, personalization, and competitive pricing. Technological advancements like biometric authentication and blockchain-based security are improving user safety and trust. The market also witnesses a trend towards hyper-personalization, offering customized itineraries and travel suggestions based on user preferences.
Key Drivers, Barriers & Challenges in Travel App
Key Drivers:
- Increasing smartphone penetration and internet access globally.
- Growing preference for convenient and cost-effective travel booking.
- Technological advancements (AI, AR/VR, Blockchain).
- Rising disposable incomes in emerging economies.
Key Challenges:
- Intense competition and pressure to differentiate.
- Data privacy and security concerns.
- Regulatory hurdles and compliance costs.
- Dependence on third-party services (e.g., payment gateways, airlines).
- Fluctuations in the global economy impacting travel demand.
Emerging Opportunities in Travel App
- Sustainable and eco-friendly travel options: Apps promoting sustainable tourism practices are gaining traction.
- Hyper-personalization: Utilizing AI and big data to deliver highly customized travel experiences.
- Integration with other services: Seamless integration with transportation, accommodation, and activity booking services.
- Expansion into niche markets: Focusing on specific traveler segments, like adventure tourism or luxury travel.
Growth Accelerators in the Travel App Industry
Strategic partnerships between travel app providers and airlines, hotels, and other travel-related businesses are key growth accelerators. Technological innovation, such as the implementation of AI-powered chatbots for customer support, contributes to enhancing customer experience and driving user engagement. Market expansion into untapped regions and the development of innovative features tailored to specific traveler needs and preferences further fuel market growth.
Key Players Shaping the Travel App Market
Notable Milestones in Travel App Sector
- 2020: Increased adoption of contactless travel solutions due to the pandemic.
- 2021: Significant investment in AI-powered personalization features by major players.
- 2022: Launch of several sustainable travel apps focusing on eco-friendly options.
- 2023: Increased focus on data privacy and security features.
- 2024: Several strategic partnerships announced between travel apps and other service providers.
In-Depth Travel App Market Outlook
The travel app market is poised for continued robust growth over the forecast period, fueled by technological advancements, changing consumer preferences, and the increasing penetration of smartphones and internet access globally. Strategic partnerships and expansion into new markets will be crucial for success. The report highlights significant opportunities for companies to capitalize on the growing demand for personalized, sustainable, and convenient travel experiences. The market is expected to reach $xx billion by 2033, presenting substantial growth opportunities for industry players.
Travel App Segmentation
-
1. Application
- 1.1. Private Use
- 1.2. Commercial Use
-
2. Types
- 2.1. Intermediaries
- 2.2. Transportation
- 2.3. Lodging
- 2.4. Travel Services
Travel App Segmentation By Geography
-
1. North America
- 1.1. United States
- 1.2. Canada
- 1.3. Mexico
-
2. South America
- 2.1. Brazil
- 2.2. Argentina
- 2.3. Rest of South America
-
3. Europe
- 3.1. United Kingdom
- 3.2. Germany
- 3.3. France
- 3.4. Italy
- 3.5. Spain
- 3.6. Russia
- 3.7. Benelux
- 3.8. Nordics
- 3.9. Rest of Europe
-
4. Middle East & Africa
- 4.1. Turkey
- 4.2. Israel
- 4.3. GCC
- 4.4. North Africa
- 4.5. South Africa
- 4.6. Rest of Middle East & Africa
-
5. Asia Pacific
- 5.1. China
- 5.2. India
- 5.3. Japan
- 5.4. South Korea
- 5.5. ASEAN
- 5.6. Oceania
- 5.7. Rest of Asia Pacific
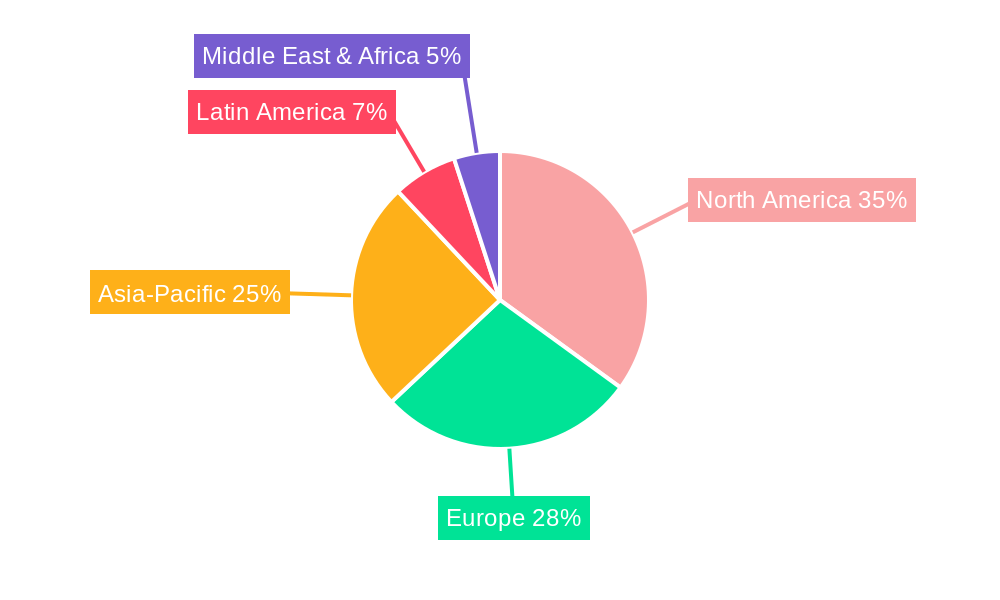
Travel App Regional Market Share
Geographic Coverage of Travel App
Travel App REPORT HIGHLIGHTS
| Aspects | Details |
|---|---|
| Study Period | 2020-2034 |
| Base Year | 2025 |
| Estimated Year | 2026 |
| Forecast Period | 2026-2034 |
| Historical Period | 2020-2025 |
| Growth Rate | CAGR of 18.4% from 2020-2034 |
| Segmentation |
|
Table of Contents
- 1. Introduction
- 1.1. Research Scope
- 1.2. Market Segmentation
- 1.3. Research Objective
- 1.4. Definitions and Assumptions
- 2. Executive Summary
- 2.1. Market Snapshot
- 3. Market Dynamics
- 3.1. Market Drivers
- 3.2. Market Restrains
- 3.3. Market Trends
- 3.4. Market Opportunities
- 4. Market Factor Analysis
- 4.1. Porters Five Forces
- 4.1.1. Bargaining Power of Suppliers
- 4.1.2. Bargaining Power of Buyers
- 4.1.3. Threat of New Entrants
- 4.1.4. Threat of Substitutes
- 4.1.5. Competitive Rivalry
- 4.2. PESTEL analysis
- 4.3. BCG Analysis
- 4.3.1. Stars (High Growth, High Market Share)
- 4.3.2. Cash Cows (Low Growth, High Market Share)
- 4.3.3. Question Mark (High Growth, Low Market Share)
- 4.3.4. Dogs (Low Growth, Low Market Share)
- 4.4. Ansoff Matrix Analysis
- 4.5. Supply Chain Analysis
- 4.6. Regulatory Landscape
- 4.7. Current Market Potential and Opportunity Assessment (TAM–SAM–SOM Framework)
- 4.8. IMR Analyst Note
- 4.1. Porters Five Forces
- 5. Market Analysis, Insights and Forecast 2021-2033
- 5.1. Market Analysis, Insights and Forecast - by Application
- 5.1.1. Private Use
- 5.1.2. Commercial Use
- 5.2. Market Analysis, Insights and Forecast - by Types
- 5.2.1. Intermediaries
- 5.2.2. Transportation
- 5.2.3. Lodging
- 5.2.4. Travel Services
- 5.3. Market Analysis, Insights and Forecast - by Region
- 5.3.1. North America
- 5.3.2. South America
- 5.3.3. Europe
- 5.3.4. Middle East & Africa
- 5.3.5. Asia Pacific
- 5.1. Market Analysis, Insights and Forecast - by Application
- 6. Global Travel App Analysis, Insights and Forecast, 2021-2033
- 6.1. Market Analysis, Insights and Forecast - by Application
- 6.1.1. Private Use
- 6.1.2. Commercial Use
- 6.2. Market Analysis, Insights and Forecast - by Types
- 6.2.1. Intermediaries
- 6.2.2. Transportation
- 6.2.3. Lodging
- 6.2.4. Travel Services
- 6.1. Market Analysis, Insights and Forecast - by Application
- 7. North America Travel App Analysis, Insights and Forecast, 2020-2032
- 7.1. Market Analysis, Insights and Forecast - by Application
- 7.1.1. Private Use
- 7.1.2. Commercial Use
- 7.2. Market Analysis, Insights and Forecast - by Types
- 7.2.1. Intermediaries
- 7.2.2. Transportation
- 7.2.3. Lodging
- 7.2.4. Travel Services
- 7.1. Market Analysis, Insights and Forecast - by Application
- 8. South America Travel App Analysis, Insights and Forecast, 2020-2032
- 8.1. Market Analysis, Insights and Forecast - by Application
- 8.1.1. Private Use
- 8.1.2. Commercial Use
- 8.2. Market Analysis, Insights and Forecast - by Types
- 8.2.1. Intermediaries
- 8.2.2. Transportation
- 8.2.3. Lodging
- 8.2.4. Travel Services
- 8.1. Market Analysis, Insights and Forecast - by Application
- 9. Europe Travel App Analysis, Insights and Forecast, 2020-2032
- 9.1. Market Analysis, Insights and Forecast - by Application
- 9.1.1. Private Use
- 9.1.2. Commercial Use
- 9.2. Market Analysis, Insights and Forecast - by Types
- 9.2.1. Intermediaries
- 9.2.2. Transportation
- 9.2.3. Lodging
- 9.2.4. Travel Services
- 9.1. Market Analysis, Insights and Forecast - by Application
- 10. Middle East & Africa Travel App Analysis, Insights and Forecast, 2020-2032
- 10.1. Market Analysis, Insights and Forecast - by Application
- 10.1.1. Private Use
- 10.1.2. Commercial Use
- 10.2. Market Analysis, Insights and Forecast - by Types
- 10.2.1. Intermediaries
- 10.2.2. Transportation
- 10.2.3. Lodging
- 10.2.4. Travel Services
- 10.1. Market Analysis, Insights and Forecast - by Application
- 11. Asia Pacific Travel App Analysis, Insights and Forecast, 2020-2032
- 11.1. Market Analysis, Insights and Forecast - by Application
- 11.1.1. Private Use
- 11.1.2. Commercial Use
- 11.2. Market Analysis, Insights and Forecast - by Types
- 11.2.1. Intermediaries
- 11.2.2. Transportation
- 11.2.3. Lodging
- 11.2.4. Travel Services
- 11.1. Market Analysis, Insights and Forecast - by Application
- 12. Competitive Analysis
- 12.1. Company Profiles
- 12.1.1 Airbnb
- 12.1.1.1. Company Overview
- 12.1.1.2. Products
- 12.1.1.3. Company Financials
- 12.1.1.4. SWOT Analysis
- 12.1.2 American Airlines
- 12.1.2.1. Company Overview
- 12.1.2.2. Products
- 12.1.2.3. Company Financials
- 12.1.2.4. SWOT Analysis
- 12.1.3 Booking Holdings
- 12.1.3.1. Company Overview
- 12.1.3.2. Products
- 12.1.3.3. Company Financials
- 12.1.3.4. SWOT Analysis
- 12.1.4 Carnival Corporation
- 12.1.4.1. Company Overview
- 12.1.4.2. Products
- 12.1.4.3. Company Financials
- 12.1.4.4. SWOT Analysis
- 12.1.5 Expedia Group
- 12.1.5.1. Company Overview
- 12.1.5.2. Products
- 12.1.5.3. Company Financials
- 12.1.5.4. SWOT Analysis
- 12.1.6 Google
- 12.1.6.1. Company Overview
- 12.1.6.2. Products
- 12.1.6.3. Company Financials
- 12.1.6.4. SWOT Analysis
- 12.1.7 Lyft
- 12.1.7.1. Company Overview
- 12.1.7.2. Products
- 12.1.7.3. Company Financials
- 12.1.7.4. SWOT Analysis
- 12.1.8 feizhu
- 12.1.8.1. Company Overview
- 12.1.8.2. Products
- 12.1.8.3. Company Financials
- 12.1.8.4. SWOT Analysis
- 12.1.9 MakeMyTrip
- 12.1.9.1. Company Overview
- 12.1.9.2. Products
- 12.1.9.3. Company Financials
- 12.1.9.4. SWOT Analysis
- 12.1.10 Trainline
- 12.1.10.1. Company Overview
- 12.1.10.2. Products
- 12.1.10.3. Company Financials
- 12.1.10.4. SWOT Analysis
- 12.1.11 ctrip
- 12.1.11.1. Company Overview
- 12.1.11.2. Products
- 12.1.11.3. Company Financials
- 12.1.11.4. SWOT Analysis
- 12.1.1 Airbnb
- 12.2. Market Entropy
- 12.2.1 Company's Key Areas Served
- 12.2.2 Recent Developments
- 12.3. Company Market Share Analysis 2025
- 12.3.1 Top 5 Companies Market Share Analysis
- 12.3.2 Top 3 Companies Market Share Analysis
- 12.4. List of Potential Customers
- 13. Research Methodology
List of Figures
- Figure 1: Global Travel App Revenue Breakdown (undefined, %) by Region 2025 & 2033
- Figure 2: North America Travel App Revenue (undefined), by Application 2025 & 2033
- Figure 3: North America Travel App Revenue Share (%), by Application 2025 & 2033
- Figure 4: North America Travel App Revenue (undefined), by Types 2025 & 2033
- Figure 5: North America Travel App Revenue Share (%), by Types 2025 & 2033
- Figure 6: North America Travel App Revenue (undefined), by Country 2025 & 2033
- Figure 7: North America Travel App Revenue Share (%), by Country 2025 & 2033
- Figure 8: South America Travel App Revenue (undefined), by Application 2025 & 2033
- Figure 9: South America Travel App Revenue Share (%), by Application 2025 & 2033
- Figure 10: South America Travel App Revenue (undefined), by Types 2025 & 2033
- Figure 11: South America Travel App Revenue Share (%), by Types 2025 & 2033
- Figure 12: South America Travel App Revenue (undefined), by Country 2025 & 2033
- Figure 13: South America Travel App Revenue Share (%), by Country 2025 & 2033
- Figure 14: Europe Travel App Revenue (undefined), by Application 2025 & 2033
- Figure 15: Europe Travel App Revenue Share (%), by Application 2025 & 2033
- Figure 16: Europe Travel App Revenue (undefined), by Types 2025 & 2033
- Figure 17: Europe Travel App Revenue Share (%), by Types 2025 & 2033
- Figure 18: Europe Travel App Revenue (undefined), by Country 2025 & 2033
- Figure 19: Europe Travel App Revenue Share (%), by Country 2025 & 2033
- Figure 20: Middle East & Africa Travel App Revenue (undefined), by Application 2025 & 2033
- Figure 21: Middle East & Africa Travel App Revenue Share (%), by Application 2025 & 2033
- Figure 22: Middle East & Africa Travel App Revenue (undefined), by Types 2025 & 2033
- Figure 23: Middle East & Africa Travel App Revenue Share (%), by Types 2025 & 2033
- Figure 24: Middle East & Africa Travel App Revenue (undefined), by Country 2025 & 2033
- Figure 25: Middle East & Africa Travel App Revenue Share (%), by Country 2025 & 2033
- Figure 26: Asia Pacific Travel App Revenue (undefined), by Application 2025 & 2033
- Figure 27: Asia Pacific Travel App Revenue Share (%), by Application 2025 & 2033
- Figure 28: Asia Pacific Travel App Revenue (undefined), by Types 2025 & 2033
- Figure 29: Asia Pacific Travel App Revenue Share (%), by Types 2025 & 2033
- Figure 30: Asia Pacific Travel App Revenue (undefined), by Country 2025 & 2033
- Figure 31: Asia Pacific Travel App Revenue Share (%), by Country 2025 & 2033
List of Tables
- Table 1: Global Travel App Revenue undefined Forecast, by Application 2020 & 2033
- Table 2: Global Travel App Revenue undefined Forecast, by Types 2020 & 2033
- Table 3: Global Travel App Revenue undefined Forecast, by Region 2020 & 2033
- Table 4: Global Travel App Revenue undefined Forecast, by Application 2020 & 2033
- Table 5: Global Travel App Revenue undefined Forecast, by Types 2020 & 2033
- Table 6: Global Travel App Revenue undefined Forecast, by Country 2020 & 2033
- Table 7: United States Travel App Revenue (undefined) Forecast, by Application 2020 & 2033
- Table 8: Canada Travel App Revenue (undefined) Forecast, by Application 2020 & 2033
- Table 9: Mexico Travel App Revenue (undefined) Forecast, by Application 2020 & 2033
- Table 10: Global Travel App Revenue undefined Forecast, by Application 2020 & 2033
- Table 11: Global Travel App Revenue undefined Forecast, by Types 2020 & 2033
- Table 12: Global Travel App Revenue undefined Forecast, by Country 2020 & 2033
- Table 13: Brazil Travel App Revenue (undefined) Forecast, by Application 2020 & 2033
- Table 14: Argentina Travel App Revenue (undefined) Forecast, by Application 2020 & 2033
- Table 15: Rest of South America Travel App Revenue (undefined) Forecast, by Application 2020 & 2033
- Table 16: Global Travel App Revenue undefined Forecast, by Application 2020 & 2033
- Table 17: Global Travel App Revenue undefined Forecast, by Types 2020 & 2033
- Table 18: Global Travel App Revenue undefined Forecast, by Country 2020 & 2033
- Table 19: United Kingdom Travel App Revenue (undefined) Forecast, by Application 2020 & 2033
- Table 20: Germany Travel App Revenue (undefined) Forecast, by Application 2020 & 2033
- Table 21: France Travel App Revenue (undefined) Forecast, by Application 2020 & 2033
- Table 22: Italy Travel App Revenue (undefined) Forecast, by Application 2020 & 2033
- Table 23: Spain Travel App Revenue (undefined) Forecast, by Application 2020 & 2033
- Table 24: Russia Travel App Revenue (undefined) Forecast, by Application 2020 & 2033
- Table 25: Benelux Travel App Revenue (undefined) Forecast, by Application 2020 & 2033
- Table 26: Nordics Travel App Revenue (undefined) Forecast, by Application 2020 & 2033
- Table 27: Rest of Europe Travel App Revenue (undefined) Forecast, by Application 2020 & 2033
- Table 28: Global Travel App Revenue undefined Forecast, by Application 2020 & 2033
- Table 29: Global Travel App Revenue undefined Forecast, by Types 2020 & 2033
- Table 30: Global Travel App Revenue undefined Forecast, by Country 2020 & 2033
- Table 31: Turkey Travel App Revenue (undefined) Forecast, by Application 2020 & 2033
- Table 32: Israel Travel App Revenue (undefined) Forecast, by Application 2020 & 2033
- Table 33: GCC Travel App Revenue (undefined) Forecast, by Application 2020 & 2033
- Table 34: North Africa Travel App Revenue (undefined) Forecast, by Application 2020 & 2033
- Table 35: South Africa Travel App Revenue (undefined) Forecast, by Application 2020 & 2033
- Table 36: Rest of Middle East & Africa Travel App Revenue (undefined) Forecast, by Application 2020 & 2033
- Table 37: Global Travel App Revenue undefined Forecast, by Application 2020 & 2033
- Table 38: Global Travel App Revenue undefined Forecast, by Types 2020 & 2033
- Table 39: Global Travel App Revenue undefined Forecast, by Country 2020 & 2033
- Table 40: China Travel App Revenue (undefined) Forecast, by Application 2020 & 2033
- Table 41: India Travel App Revenue (undefined) Forecast, by Application 2020 & 2033
- Table 42: Japan Travel App Revenue (undefined) Forecast, by Application 2020 & 2033
- Table 43: South Korea Travel App Revenue (undefined) Forecast, by Application 2020 & 2033
- Table 44: ASEAN Travel App Revenue (undefined) Forecast, by Application 2020 & 2033
- Table 45: Oceania Travel App Revenue (undefined) Forecast, by Application 2020 & 2033
- Table 46: Rest of Asia Pacific Travel App Revenue (undefined) Forecast, by Application 2020 & 2033
Frequently Asked Questions
1. What is the projected Compound Annual Growth Rate (CAGR) of the Travel App?
The projected CAGR is approximately 18.4%.
2. Which companies are prominent players in the Travel App?
Key companies in the market include Airbnb, American Airlines, Booking Holdings, Carnival Corporation, Expedia Group, Google, Lyft, feizhu, MakeMyTrip, Trainline, ctrip.
3. What are the main segments of the Travel App?
The market segments include Application, Types.
4. Can you provide details about the market size?
The market size is estimated to be USD XXX N/A as of 2022.
5. What are some drivers contributing to market growth?
N/A
6. What are the notable trends driving market growth?
N/A
7. Are there any restraints impacting market growth?
N/A
8. Can you provide examples of recent developments in the market?
N/A
9. What pricing options are available for accessing the report?
Pricing options include single-user, multi-user, and enterprise licenses priced at USD 3350.00, USD 5025.00, and USD 6700.00 respectively.
10. Is the market size provided in terms of value or volume?
The market size is provided in terms of value, measured in N/A.
11. Are there any specific market keywords associated with the report?
Yes, the market keyword associated with the report is "Travel App," which aids in identifying and referencing the specific market segment covered.
12. How do I determine which pricing option suits my needs best?
The pricing options vary based on user requirements and access needs. Individual users may opt for single-user licenses, while businesses requiring broader access may choose multi-user or enterprise licenses for cost-effective access to the report.
13. Are there any additional resources or data provided in the Travel App report?
While the report offers comprehensive insights, it's advisable to review the specific contents or supplementary materials provided to ascertain if additional resources or data are available.
14. How can I stay updated on further developments or reports in the Travel App?
To stay informed about further developments, trends, and reports in the Travel App, consider subscribing to industry newsletters, following relevant companies and organizations, or regularly checking reputable industry news sources and publications.
Methodology
Step 1 - Identification of Relevant Samples Size from Population Database


Step 2 - Approaches for Defining Global Market Size (Value, Volume* & Price*)

Note*: In applicable scenarios
Step 3 - Data Sources
Primary Research
- Web Analytics
- Survey Reports
- Research Institute
- Latest Research Reports
- Opinion Leaders
Secondary Research
- Annual Reports
- White Paper
- Latest Press Release
- Industry Association
- Paid Database
- Investor Presentations

Step 4 - Data Triangulation
Involves using different sources of information in order to increase the validity of a study
These sources are likely to be stakeholders in a program - participants, other researchers, program staff, other community members, and so on.
Then we put all data in single framework & apply various statistical tools to find out the dynamic on the market.
During the analysis stage, feedback from the stakeholder groups would be compared to determine areas of agreement as well as areas of divergence