

Key Insights
The UK offshore wind energy market is experiencing significant expansion, propelled by government renewable energy objectives, declining technology expenses, and escalating investor confidence. With a projected Compound Annual Growth Rate (CAGR) of 14.6%, the market, valued at an estimated 55.9 billion in 2024, is poised for substantial growth through 2033. Key growth drivers include supportive government policies such as Contracts for Difference (CfD) auctions, advancements in turbine technology enhancing capacity and efficiency, and increasing demand for clean energy from both the public and corporations. The market is segmented by foundation type (fixed and floating) and turbine capacity (<5 MW and ≥5 MW), reflecting diverse project scales and technological progress. Despite challenges like grid infrastructure constraints and environmental considerations, the UK offshore wind sector presents a highly positive outlook. Leading companies including Scottish Power, BP, Shell, and Ørsted are actively influencing market dynamics through major project developments and innovation.
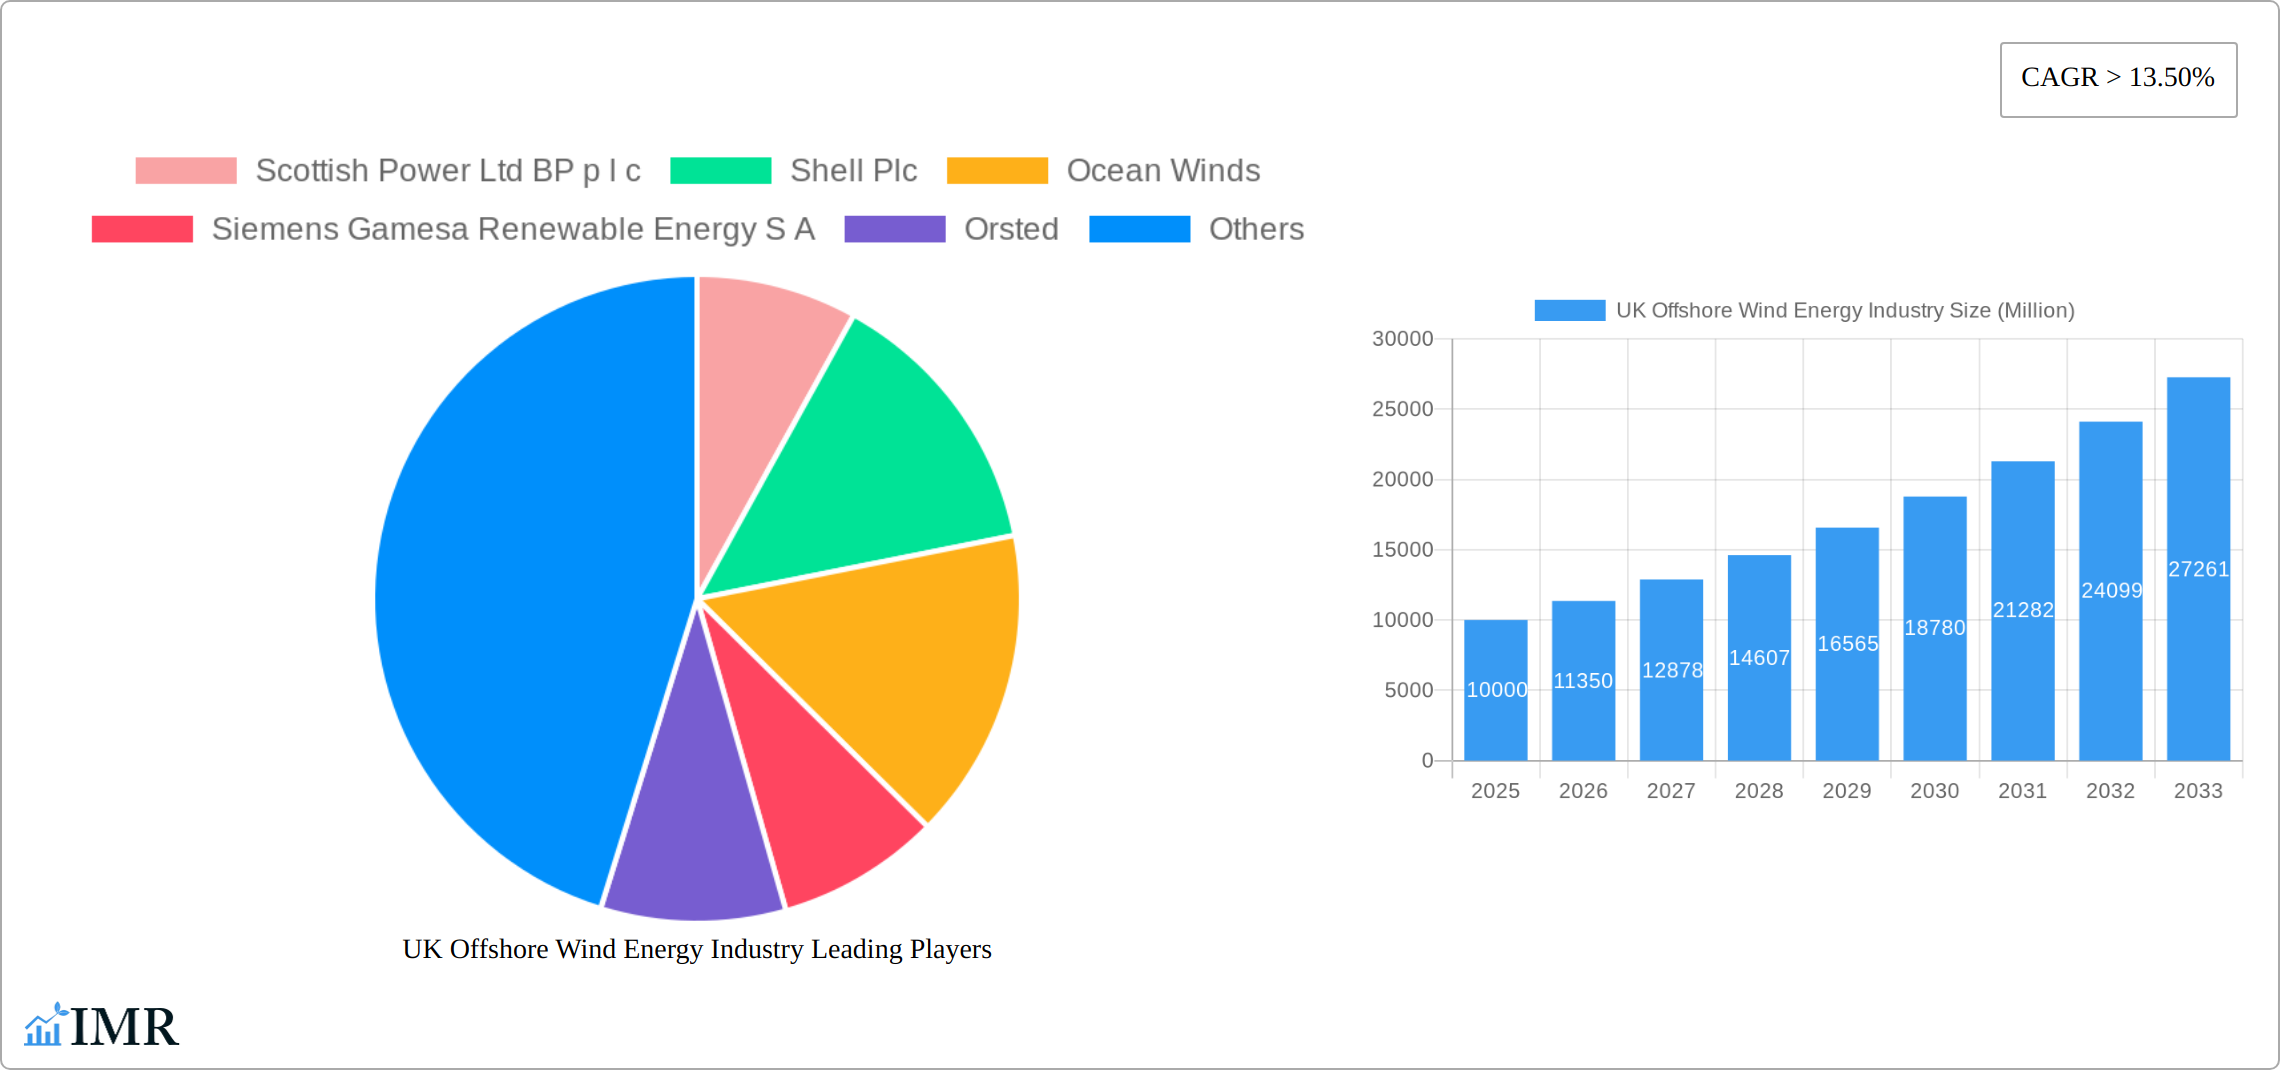
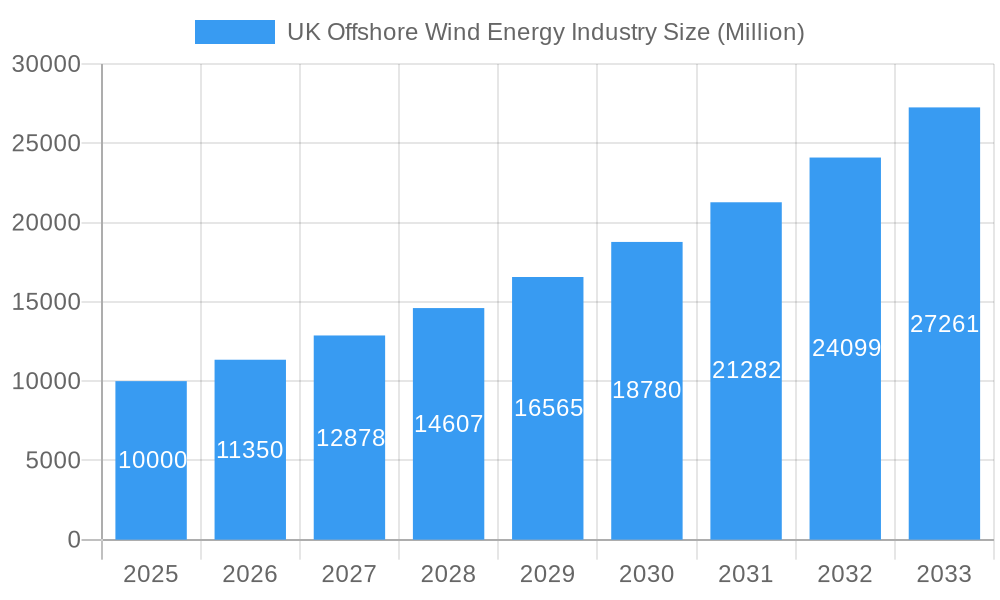
UK Offshore Wind Energy Industry Market Size (In Billion)
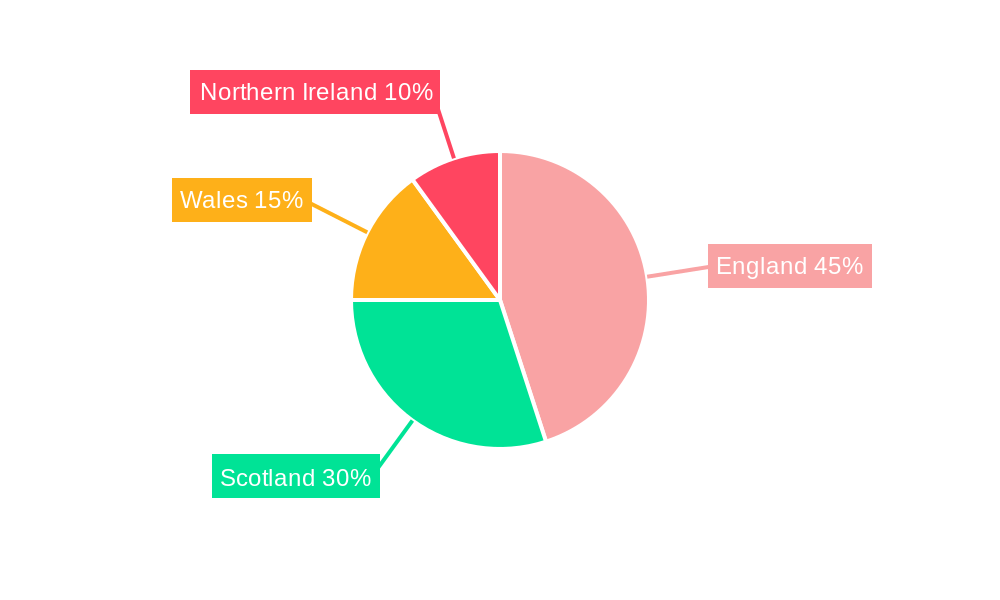
The robust CAGR of 14.6% underscores the significant growth potential, particularly given the UK's strategic offshore wind resources. Continuous technological innovation aimed at cost reduction and efficiency gains in both fixed and floating foundation technologies will further accelerate market expansion. The trend towards larger capacity turbines (>5 MW) is evident in recent project announcements, indicating a move towards more cost-effective, large-scale developments. Regional disparities exist across the UK (England, Wales, Scotland, and Northern Ireland) influenced by wind resource availability and infrastructure. Overcoming logistical hurdles in project development and grid integration, alongside ongoing environmental impact assessments, will be crucial for sustaining the industry's impressive growth trajectory over the next decade.
UK Offshore Wind Energy Industry Company Market Share
UK Offshore Wind Energy Industry: Market Report 2019-2033
This comprehensive report provides a detailed analysis of the UK offshore wind energy industry, covering market dynamics, growth trends, key players, and future outlook. The report utilizes data from the historical period (2019-2024), base year (2025), and forecast period (2025-2033) to provide a robust understanding of this rapidly evolving sector. This report is essential for industry professionals, investors, and policymakers seeking in-depth insights into this dynamic market.
UK Offshore Wind Energy Industry Market Dynamics & Structure
The UK offshore wind energy market is a dynamic landscape shaped by a complex interplay of factors influencing its structure and growth trajectory. While exhibiting moderate market concentration with several key players vying for market share, the sector is characterized by rapid technological advancements. Innovations in turbine design (with a focus on capacities exceeding 5 MW), foundation technologies (encompassing both fixed and increasingly crucial floating solutions), and sophisticated grid integration strategies are pivotal growth drivers. The regulatory environment, encompassing government policies, licensing procedures, and environmental considerations, significantly shapes market development and investment decisions. Competition from alternative renewable energy sources, such as solar and onshore wind, adds another layer of complexity. Furthermore, end-user demand, driven by the energy needs of households and industries, significantly influences market size and future projections. Finally, the considerable mergers and acquisitions (M&A) activity reflects ongoing industry consolidation and strategic partnerships aimed at expanding capacity and technological expertise.
- Market Concentration: Moderate, with the top 5 players holding approximately [Insert Percentage]% market share (2024). [Optional: Add a brief explanation of the market share calculation methodology].
- Technological Innovation: Focus on increasing turbine capacity (above 5 MW), advancements in floating foundations for deeper water deployment, and intelligent grid integration to maximize efficiency and minimize transmission losses.
- Regulatory Framework: Supportive government policies, including [Specific Examples of Policies e.g., Contracts for Difference (CfD) scheme], and investment incentives are key catalysts for continued growth. However, streamlining permitting processes and navigating environmental regulations remain crucial considerations.
- Competitive Substitutes: Solar and onshore wind power present some competition, although the unique advantages of offshore wind, such as higher capacity factors and reduced land-use impact, provide a competitive edge.
- M&A Activity: Significant deal volume in recent years, driven by strategic expansion, technology acquisition, and efforts to secure access to key resources and expertise. [Insert Number] deals recorded between 2019-2024. [Optional: Mention significant deals and their implications].
- Innovation Barriers: High initial capital investment costs, grid connection challenges (including infrastructure upgrades and network limitations), and the complexities of operating and maintaining offshore infrastructure are significant hurdles to overcome.
UK Offshore Wind Energy Industry Growth Trends & Insights
The UK offshore wind energy market has demonstrated remarkable growth between 2019 and 2024. The market, valued at £[Insert Value] million in 2024, is projected to reach £[Insert Value] million by 2033, representing a Compound Annual Growth Rate (CAGR) of [Insert Percentage]% during the forecast period (2025-2033). This robust growth trajectory is primarily attributed to several interconnected factors: a steady increase in energy demand fueled by population growth and industrial needs; supportive government policies and regulatory frameworks; cost reductions driven by technological advancements, making offshore wind increasingly competitive with traditional energy sources; and a heightened public awareness and acceptance of renewable energy as a crucial component of a sustainable energy future. Market penetration is expanding steadily, propelled by the development of large-scale projects and continuous capacity additions. Furthermore, technological disruptions, particularly the adoption of floating foundations for deeper waters, are significantly expanding the geographical potential and unlocking new growth avenues. Finally, evolving consumer behavior, characterized by a strong preference for cleaner energy sources, is a positive driver of market adoption.
Dominant Regions, Countries, or Segments in UK Offshore Wind Energy Industry
The UK's offshore wind energy sector is geographically dispersed, with significant activity across various regions. However, specific segments within the market exhibit faster growth. The "Greater Than or Equal to 5 MW" capacity segment is leading market growth, driven by the economics of scale and technological advancements resulting in larger, more efficient turbines. Similarly, fixed foundation technologies currently dominate but the floating foundation segment is showing accelerated growth, enabled by advancements in technology and government support targeting deeper waters.
- Key Drivers (Greater than or equal to 5 MW Capacity): Economies of scale, technological advancements, and government support for larger projects.
- Key Drivers (Floating Foundation): Access to deeper water resources, enabling larger projects in previously inaccessible areas. Government incentives specifically targeting floating wind farms.
- Dominance Factors: High capacity installations, increasing cost-competitiveness, and conducive government policies.
- Growth Potential: Significant potential for both segments, particularly in areas with suitable offshore wind resources and robust grid infrastructure.
UK Offshore Wind Energy Industry Product Landscape
The UK offshore wind energy market features a diverse product landscape characterized by continuous innovation. Turbine designs are becoming larger and more efficient, incorporating advanced blade technology and improved power conversion systems. Foundation technologies are evolving, with increased focus on floating solutions for deeper waters. These advancements enhance energy capture, reduce costs, and improve reliability. Furthermore, digitalization and smart grid integration are enhancing the efficiency and management of offshore wind farms. Unique selling propositions include increased energy output, reduced operational costs, and improved environmental performance.
Key Drivers, Barriers & Challenges in UK Offshore Wind Energy Industry
Key Drivers:
- Government Support: Subsidies, tax incentives (e.g., specify relevant tax breaks), and clearly defined regulatory frameworks are attracting significant investment and fostering confidence in the sector.
- Technological Advancements: Larger and more efficient turbines, the development of floating foundations for deeper waters, and improvements in grid integration technologies are driving down costs and enhancing the overall efficiency of offshore wind farms.
- Climate Change Concerns: The growing public awareness of climate change and the urgent need for decarbonization is creating a strong impetus for the adoption of renewable energy sources, including offshore wind.
- Energy Security: Reducing reliance on fossil fuel imports and enhancing the nation's energy independence is a key driver for investing in domestic renewable energy generation.
Challenges:
- Supply Chain Constraints: Potential shortages of key components, including turbines, cables, and specialized materials, as well as a shortage of skilled labor, can hinder project timelines, increase costs, and potentially create bottlenecks in development. A [Insert Percentage]% increase in component prices was observed in 2023, highlighting the vulnerability of the supply chain.
- Regulatory Hurdles: Complex permitting processes, environmental impact assessments, and navigating various regulatory bodies can significantly delay project development and increase administrative costs.
- Grid Integration Challenges: Integrating large offshore wind farms into the existing electricity grid requires substantial investments in new transmission infrastructure, posing significant engineering and logistical challenges.
- Environmental Concerns: Minimizing the environmental impact on marine ecosystems and addressing concerns related to visual impact and potential noise pollution are important aspects to address.
Emerging Opportunities in UK Offshore Wind Energy Industry
Emerging opportunities include expanding into deeper waters using floating foundations, integrating offshore wind with other renewable energy sources (e.g., green hydrogen production), and developing innovative solutions for energy storage. Furthermore, exploring opportunities for wind farm tourism and establishing a robust supply chain for component manufacturing within the UK can generate further growth.
Growth Accelerators in the UK Offshore Wind Energy Industry Industry
Technological breakthroughs in turbine design and floating foundation technologies are accelerating market growth, coupled with strategic partnerships between energy companies and technology providers, driving innovation and cost reduction. Government support through investment incentives, streamlined regulatory processes, and focused R&D funding significantly contributes to market expansion.
Key Players Shaping the UK Offshore Wind Energy Industry Market
Notable Milestones in UK Offshore Wind Energy Industry Sector
- August 2021: UK government invests USD 350 million in offshore wind manufacturing in the Humber region, boosting domestic manufacturing capabilities.
- January 17th, 2022: Shell plc and Scottish Power Ltd. win bids for a combined 5 GW of floating wind power capacity, signaling a significant investment in this emerging technology with plans for 3 GW and 2 GW farms respectively.
- March 28th, 2022: Shell plc announces a EUR 30 billion investment in the UK energy system, with a substantial 75% allocation to renewables, underscoring the company's commitment to the sector's growth.
- [Add other relevant milestones and their significance]
In-Depth UK Offshore Wind Energy Industry Market Outlook
The UK offshore wind energy market is poised for continued strong growth, driven by government support, technological advancements, and increasing demand for renewable energy. Strategic opportunities exist for companies to capitalize on the expansion of floating offshore wind farms, the development of a domestic supply chain, and the integration of offshore wind with other renewable energy technologies. The market presents significant potential for both domestic and international players seeking to participate in the global transition towards a low-carbon energy future.
UK Offshore Wind Energy Industry Segmentation
-
1. Foundation Type
- 1.1. Fixed Foundation
- 1.2. Floating Foundation
-
2. Capacity
- 2.1. Less Than 5 MW
- 2.2. Greater Than or Equal to 5 MW
UK Offshore Wind Energy Industry Segmentation By Geography
-
1. North America
- 1.1. United States
- 1.2. Canada
- 1.3. Mexico
-
2. South America
- 2.1. Brazil
- 2.2. Argentina
- 2.3. Rest of South America
-
3. Europe
- 3.1. United Kingdom
- 3.2. Germany
- 3.3. France
- 3.4. Italy
- 3.5. Spain
- 3.6. Russia
- 3.7. Benelux
- 3.8. Nordics
- 3.9. Rest of Europe
-
4. Middle East & Africa
- 4.1. Turkey
- 4.2. Israel
- 4.3. GCC
- 4.4. North Africa
- 4.5. South Africa
- 4.6. Rest of Middle East & Africa
-
5. Asia Pacific
- 5.1. China
- 5.2. India
- 5.3. Japan
- 5.4. South Korea
- 5.5. ASEAN
- 5.6. Oceania
- 5.7. Rest of Asia Pacific
UK Offshore Wind Energy Industry Regional Market Share
Geographic Coverage of UK Offshore Wind Energy Industry
UK Offshore Wind Energy Industry REPORT HIGHLIGHTS
| Aspects | Details |
|---|---|
| Study Period | 2020-2034 |
| Base Year | 2025 |
| Estimated Year | 2026 |
| Forecast Period | 2026-2034 |
| Historical Period | 2020-2025 |
| Growth Rate | CAGR of 14.6% from 2020-2034 |
| Segmentation |
|
Table of Contents
- 1. Introduction
- 1.1. Research Scope
- 1.2. Market Segmentation
- 1.3. Research Objective
- 1.4. Definitions and Assumptions
- 2. Executive Summary
- 2.1. Market Snapshot
- 3. Market Dynamics
- 3.1. Market Drivers
- 3.2. Market Restrains
- 3.3. Market Trends
- 3.4. Market Opportunities
- 4. Market Factor Analysis
- 4.1. Porters Five Forces
- 4.1.1. Bargaining Power of Suppliers
- 4.1.2. Bargaining Power of Buyers
- 4.1.3. Threat of New Entrants
- 4.1.4. Threat of Substitutes
- 4.1.5. Competitive Rivalry
- 4.2. PESTEL analysis
- 4.3. BCG Analysis
- 4.3.1. Stars (High Growth, High Market Share)
- 4.3.2. Cash Cows (Low Growth, High Market Share)
- 4.3.3. Question Mark (High Growth, Low Market Share)
- 4.3.4. Dogs (Low Growth, Low Market Share)
- 4.4. Ansoff Matrix Analysis
- 4.5. Supply Chain Analysis
- 4.6. Regulatory Landscape
- 4.7. Current Market Potential and Opportunity Assessment (TAM–SAM–SOM Framework)
- 4.8. IMR Analyst Note
- 4.1. Porters Five Forces
- 5. Market Analysis, Insights and Forecast 2021-2033
- 5.1. Market Analysis, Insights and Forecast - by Foundation Type
- 5.1.1. Fixed Foundation
- 5.1.2. Floating Foundation
- 5.2. Market Analysis, Insights and Forecast - by Capacity
- 5.2.1. Less Than 5 MW
- 5.2.2. Greater Than or Equal to 5 MW
- 5.3. Market Analysis, Insights and Forecast - by Region
- 5.3.1. North America
- 5.3.2. South America
- 5.3.3. Europe
- 5.3.4. Middle East & Africa
- 5.3.5. Asia Pacific
- 5.1. Market Analysis, Insights and Forecast - by Foundation Type
- 6. Global UK Offshore Wind Energy Industry Analysis, Insights and Forecast, 2021-2033
- 6.1. Market Analysis, Insights and Forecast - by Foundation Type
- 6.1.1. Fixed Foundation
- 6.1.2. Floating Foundation
- 6.2. Market Analysis, Insights and Forecast - by Capacity
- 6.2.1. Less Than 5 MW
- 6.2.2. Greater Than or Equal to 5 MW
- 6.1. Market Analysis, Insights and Forecast - by Foundation Type
- 7. North America UK Offshore Wind Energy Industry Analysis, Insights and Forecast, 2020-2032
- 7.1. Market Analysis, Insights and Forecast - by Foundation Type
- 7.1.1. Fixed Foundation
- 7.1.2. Floating Foundation
- 7.2. Market Analysis, Insights and Forecast - by Capacity
- 7.2.1. Less Than 5 MW
- 7.2.2. Greater Than or Equal to 5 MW
- 7.1. Market Analysis, Insights and Forecast - by Foundation Type
- 8. South America UK Offshore Wind Energy Industry Analysis, Insights and Forecast, 2020-2032
- 8.1. Market Analysis, Insights and Forecast - by Foundation Type
- 8.1.1. Fixed Foundation
- 8.1.2. Floating Foundation
- 8.2. Market Analysis, Insights and Forecast - by Capacity
- 8.2.1. Less Than 5 MW
- 8.2.2. Greater Than or Equal to 5 MW
- 8.1. Market Analysis, Insights and Forecast - by Foundation Type
- 9. Europe UK Offshore Wind Energy Industry Analysis, Insights and Forecast, 2020-2032
- 9.1. Market Analysis, Insights and Forecast - by Foundation Type
- 9.1.1. Fixed Foundation
- 9.1.2. Floating Foundation
- 9.2. Market Analysis, Insights and Forecast - by Capacity
- 9.2.1. Less Than 5 MW
- 9.2.2. Greater Than or Equal to 5 MW
- 9.1. Market Analysis, Insights and Forecast - by Foundation Type
- 10. Middle East & Africa UK Offshore Wind Energy Industry Analysis, Insights and Forecast, 2020-2032
- 10.1. Market Analysis, Insights and Forecast - by Foundation Type
- 10.1.1. Fixed Foundation
- 10.1.2. Floating Foundation
- 10.2. Market Analysis, Insights and Forecast - by Capacity
- 10.2.1. Less Than 5 MW
- 10.2.2. Greater Than or Equal to 5 MW
- 10.1. Market Analysis, Insights and Forecast - by Foundation Type
- 11. Asia Pacific UK Offshore Wind Energy Industry Analysis, Insights and Forecast, 2020-2032
- 11.1. Market Analysis, Insights and Forecast - by Foundation Type
- 11.1.1. Fixed Foundation
- 11.1.2. Floating Foundation
- 11.2. Market Analysis, Insights and Forecast - by Capacity
- 11.2.1. Less Than 5 MW
- 11.2.2. Greater Than or Equal to 5 MW
- 11.1. Market Analysis, Insights and Forecast - by Foundation Type
- 12. Competitive Analysis
- 12.1. Company Profiles
- 12.1.1 Scottish Power Ltd BP p l c
- 12.1.1.1. Company Overview
- 12.1.1.2. Products
- 12.1.1.3. Company Financials
- 12.1.1.4. SWOT Analysis
- 12.1.2 Shell Plc
- 12.1.2.1. Company Overview
- 12.1.2.2. Products
- 12.1.2.3. Company Financials
- 12.1.2.4. SWOT Analysis
- 12.1.3 Ocean Winds
- 12.1.3.1. Company Overview
- 12.1.3.2. Products
- 12.1.3.3. Company Financials
- 12.1.3.4. SWOT Analysis
- 12.1.4 Siemens Gamesa Renewable Energy S A
- 12.1.4.1. Company Overview
- 12.1.4.2. Products
- 12.1.4.3. Company Financials
- 12.1.4.4. SWOT Analysis
- 12.1.5 Orsted
- 12.1.5.1. Company Overview
- 12.1.5.2. Products
- 12.1.5.3. Company Financials
- 12.1.5.4. SWOT Analysis
- 12.1.6 EDF Renewables
- 12.1.6.1. Company Overview
- 12.1.6.2. Products
- 12.1.6.3. Company Financials
- 12.1.6.4. SWOT Analysis
- 12.1.7 Vattenfall AB
- 12.1.7.1. Company Overview
- 12.1.7.2. Products
- 12.1.7.3. Company Financials
- 12.1.7.4. SWOT Analysis
- 12.1.8 Vestas
- 12.1.8.1. Company Overview
- 12.1.8.2. Products
- 12.1.8.3. Company Financials
- 12.1.8.4. SWOT Analysis
- 12.1.9 GE RENEWABLE ENERGY
- 12.1.9.1. Company Overview
- 12.1.9.2. Products
- 12.1.9.3. Company Financials
- 12.1.9.4. SWOT Analysis
- 12.1.1 Scottish Power Ltd BP p l c
- 12.2. Market Entropy
- 12.2.1 Company's Key Areas Served
- 12.2.2 Recent Developments
- 12.3. Company Market Share Analysis 2025
- 12.3.1 Top 5 Companies Market Share Analysis
- 12.3.2 Top 3 Companies Market Share Analysis
- 12.4. List of Potential Customers
- 13. Research Methodology
List of Figures
- Figure 1: Global UK Offshore Wind Energy Industry Revenue Breakdown (billion, %) by Region 2025 & 2033
- Figure 2: Global UK Offshore Wind Energy Industry Volume Breakdown (Gigawatt, %) by Region 2025 & 2033
- Figure 3: North America UK Offshore Wind Energy Industry Revenue (billion), by Foundation Type 2025 & 2033
- Figure 4: North America UK Offshore Wind Energy Industry Volume (Gigawatt), by Foundation Type 2025 & 2033
- Figure 5: North America UK Offshore Wind Energy Industry Revenue Share (%), by Foundation Type 2025 & 2033
- Figure 6: North America UK Offshore Wind Energy Industry Volume Share (%), by Foundation Type 2025 & 2033
- Figure 7: North America UK Offshore Wind Energy Industry Revenue (billion), by Capacity 2025 & 2033
- Figure 8: North America UK Offshore Wind Energy Industry Volume (Gigawatt), by Capacity 2025 & 2033
- Figure 9: North America UK Offshore Wind Energy Industry Revenue Share (%), by Capacity 2025 & 2033
- Figure 10: North America UK Offshore Wind Energy Industry Volume Share (%), by Capacity 2025 & 2033
- Figure 11: North America UK Offshore Wind Energy Industry Revenue (billion), by Country 2025 & 2033
- Figure 12: North America UK Offshore Wind Energy Industry Volume (Gigawatt), by Country 2025 & 2033
- Figure 13: North America UK Offshore Wind Energy Industry Revenue Share (%), by Country 2025 & 2033
- Figure 14: North America UK Offshore Wind Energy Industry Volume Share (%), by Country 2025 & 2033
- Figure 15: South America UK Offshore Wind Energy Industry Revenue (billion), by Foundation Type 2025 & 2033
- Figure 16: South America UK Offshore Wind Energy Industry Volume (Gigawatt), by Foundation Type 2025 & 2033
- Figure 17: South America UK Offshore Wind Energy Industry Revenue Share (%), by Foundation Type 2025 & 2033
- Figure 18: South America UK Offshore Wind Energy Industry Volume Share (%), by Foundation Type 2025 & 2033
- Figure 19: South America UK Offshore Wind Energy Industry Revenue (billion), by Capacity 2025 & 2033
- Figure 20: South America UK Offshore Wind Energy Industry Volume (Gigawatt), by Capacity 2025 & 2033
- Figure 21: South America UK Offshore Wind Energy Industry Revenue Share (%), by Capacity 2025 & 2033
- Figure 22: South America UK Offshore Wind Energy Industry Volume Share (%), by Capacity 2025 & 2033
- Figure 23: South America UK Offshore Wind Energy Industry Revenue (billion), by Country 2025 & 2033
- Figure 24: South America UK Offshore Wind Energy Industry Volume (Gigawatt), by Country 2025 & 2033
- Figure 25: South America UK Offshore Wind Energy Industry Revenue Share (%), by Country 2025 & 2033
- Figure 26: South America UK Offshore Wind Energy Industry Volume Share (%), by Country 2025 & 2033
- Figure 27: Europe UK Offshore Wind Energy Industry Revenue (billion), by Foundation Type 2025 & 2033
- Figure 28: Europe UK Offshore Wind Energy Industry Volume (Gigawatt), by Foundation Type 2025 & 2033
- Figure 29: Europe UK Offshore Wind Energy Industry Revenue Share (%), by Foundation Type 2025 & 2033
- Figure 30: Europe UK Offshore Wind Energy Industry Volume Share (%), by Foundation Type 2025 & 2033
- Figure 31: Europe UK Offshore Wind Energy Industry Revenue (billion), by Capacity 2025 & 2033
- Figure 32: Europe UK Offshore Wind Energy Industry Volume (Gigawatt), by Capacity 2025 & 2033
- Figure 33: Europe UK Offshore Wind Energy Industry Revenue Share (%), by Capacity 2025 & 2033
- Figure 34: Europe UK Offshore Wind Energy Industry Volume Share (%), by Capacity 2025 & 2033
- Figure 35: Europe UK Offshore Wind Energy Industry Revenue (billion), by Country 2025 & 2033
- Figure 36: Europe UK Offshore Wind Energy Industry Volume (Gigawatt), by Country 2025 & 2033
- Figure 37: Europe UK Offshore Wind Energy Industry Revenue Share (%), by Country 2025 & 2033
- Figure 38: Europe UK Offshore Wind Energy Industry Volume Share (%), by Country 2025 & 2033
- Figure 39: Middle East & Africa UK Offshore Wind Energy Industry Revenue (billion), by Foundation Type 2025 & 2033
- Figure 40: Middle East & Africa UK Offshore Wind Energy Industry Volume (Gigawatt), by Foundation Type 2025 & 2033
- Figure 41: Middle East & Africa UK Offshore Wind Energy Industry Revenue Share (%), by Foundation Type 2025 & 2033
- Figure 42: Middle East & Africa UK Offshore Wind Energy Industry Volume Share (%), by Foundation Type 2025 & 2033
- Figure 43: Middle East & Africa UK Offshore Wind Energy Industry Revenue (billion), by Capacity 2025 & 2033
- Figure 44: Middle East & Africa UK Offshore Wind Energy Industry Volume (Gigawatt), by Capacity 2025 & 2033
- Figure 45: Middle East & Africa UK Offshore Wind Energy Industry Revenue Share (%), by Capacity 2025 & 2033
- Figure 46: Middle East & Africa UK Offshore Wind Energy Industry Volume Share (%), by Capacity 2025 & 2033
- Figure 47: Middle East & Africa UK Offshore Wind Energy Industry Revenue (billion), by Country 2025 & 2033
- Figure 48: Middle East & Africa UK Offshore Wind Energy Industry Volume (Gigawatt), by Country 2025 & 2033
- Figure 49: Middle East & Africa UK Offshore Wind Energy Industry Revenue Share (%), by Country 2025 & 2033
- Figure 50: Middle East & Africa UK Offshore Wind Energy Industry Volume Share (%), by Country 2025 & 2033
- Figure 51: Asia Pacific UK Offshore Wind Energy Industry Revenue (billion), by Foundation Type 2025 & 2033
- Figure 52: Asia Pacific UK Offshore Wind Energy Industry Volume (Gigawatt), by Foundation Type 2025 & 2033
- Figure 53: Asia Pacific UK Offshore Wind Energy Industry Revenue Share (%), by Foundation Type 2025 & 2033
- Figure 54: Asia Pacific UK Offshore Wind Energy Industry Volume Share (%), by Foundation Type 2025 & 2033
- Figure 55: Asia Pacific UK Offshore Wind Energy Industry Revenue (billion), by Capacity 2025 & 2033
- Figure 56: Asia Pacific UK Offshore Wind Energy Industry Volume (Gigawatt), by Capacity 2025 & 2033
- Figure 57: Asia Pacific UK Offshore Wind Energy Industry Revenue Share (%), by Capacity 2025 & 2033
- Figure 58: Asia Pacific UK Offshore Wind Energy Industry Volume Share (%), by Capacity 2025 & 2033
- Figure 59: Asia Pacific UK Offshore Wind Energy Industry Revenue (billion), by Country 2025 & 2033
- Figure 60: Asia Pacific UK Offshore Wind Energy Industry Volume (Gigawatt), by Country 2025 & 2033
- Figure 61: Asia Pacific UK Offshore Wind Energy Industry Revenue Share (%), by Country 2025 & 2033
- Figure 62: Asia Pacific UK Offshore Wind Energy Industry Volume Share (%), by Country 2025 & 2033
List of Tables
- Table 1: Global UK Offshore Wind Energy Industry Revenue billion Forecast, by Foundation Type 2020 & 2033
- Table 2: Global UK Offshore Wind Energy Industry Volume Gigawatt Forecast, by Foundation Type 2020 & 2033
- Table 3: Global UK Offshore Wind Energy Industry Revenue billion Forecast, by Capacity 2020 & 2033
- Table 4: Global UK Offshore Wind Energy Industry Volume Gigawatt Forecast, by Capacity 2020 & 2033
- Table 5: Global UK Offshore Wind Energy Industry Revenue billion Forecast, by Region 2020 & 2033
- Table 6: Global UK Offshore Wind Energy Industry Volume Gigawatt Forecast, by Region 2020 & 2033
- Table 7: Global UK Offshore Wind Energy Industry Revenue billion Forecast, by Foundation Type 2020 & 2033
- Table 8: Global UK Offshore Wind Energy Industry Volume Gigawatt Forecast, by Foundation Type 2020 & 2033
- Table 9: Global UK Offshore Wind Energy Industry Revenue billion Forecast, by Capacity 2020 & 2033
- Table 10: Global UK Offshore Wind Energy Industry Volume Gigawatt Forecast, by Capacity 2020 & 2033
- Table 11: Global UK Offshore Wind Energy Industry Revenue billion Forecast, by Country 2020 & 2033
- Table 12: Global UK Offshore Wind Energy Industry Volume Gigawatt Forecast, by Country 2020 & 2033
- Table 13: United States UK Offshore Wind Energy Industry Revenue (billion) Forecast, by Application 2020 & 2033
- Table 14: United States UK Offshore Wind Energy Industry Volume (Gigawatt) Forecast, by Application 2020 & 2033
- Table 15: Canada UK Offshore Wind Energy Industry Revenue (billion) Forecast, by Application 2020 & 2033
- Table 16: Canada UK Offshore Wind Energy Industry Volume (Gigawatt) Forecast, by Application 2020 & 2033
- Table 17: Mexico UK Offshore Wind Energy Industry Revenue (billion) Forecast, by Application 2020 & 2033
- Table 18: Mexico UK Offshore Wind Energy Industry Volume (Gigawatt) Forecast, by Application 2020 & 2033
- Table 19: Global UK Offshore Wind Energy Industry Revenue billion Forecast, by Foundation Type 2020 & 2033
- Table 20: Global UK Offshore Wind Energy Industry Volume Gigawatt Forecast, by Foundation Type 2020 & 2033
- Table 21: Global UK Offshore Wind Energy Industry Revenue billion Forecast, by Capacity 2020 & 2033
- Table 22: Global UK Offshore Wind Energy Industry Volume Gigawatt Forecast, by Capacity 2020 & 2033
- Table 23: Global UK Offshore Wind Energy Industry Revenue billion Forecast, by Country 2020 & 2033
- Table 24: Global UK Offshore Wind Energy Industry Volume Gigawatt Forecast, by Country 2020 & 2033
- Table 25: Brazil UK Offshore Wind Energy Industry Revenue (billion) Forecast, by Application 2020 & 2033
- Table 26: Brazil UK Offshore Wind Energy Industry Volume (Gigawatt) Forecast, by Application 2020 & 2033
- Table 27: Argentina UK Offshore Wind Energy Industry Revenue (billion) Forecast, by Application 2020 & 2033
- Table 28: Argentina UK Offshore Wind Energy Industry Volume (Gigawatt) Forecast, by Application 2020 & 2033
- Table 29: Rest of South America UK Offshore Wind Energy Industry Revenue (billion) Forecast, by Application 2020 & 2033
- Table 30: Rest of South America UK Offshore Wind Energy Industry Volume (Gigawatt) Forecast, by Application 2020 & 2033
- Table 31: Global UK Offshore Wind Energy Industry Revenue billion Forecast, by Foundation Type 2020 & 2033
- Table 32: Global UK Offshore Wind Energy Industry Volume Gigawatt Forecast, by Foundation Type 2020 & 2033
- Table 33: Global UK Offshore Wind Energy Industry Revenue billion Forecast, by Capacity 2020 & 2033
- Table 34: Global UK Offshore Wind Energy Industry Volume Gigawatt Forecast, by Capacity 2020 & 2033
- Table 35: Global UK Offshore Wind Energy Industry Revenue billion Forecast, by Country 2020 & 2033
- Table 36: Global UK Offshore Wind Energy Industry Volume Gigawatt Forecast, by Country 2020 & 2033
- Table 37: United Kingdom UK Offshore Wind Energy Industry Revenue (billion) Forecast, by Application 2020 & 2033
- Table 38: United Kingdom UK Offshore Wind Energy Industry Volume (Gigawatt) Forecast, by Application 2020 & 2033
- Table 39: Germany UK Offshore Wind Energy Industry Revenue (billion) Forecast, by Application 2020 & 2033
- Table 40: Germany UK Offshore Wind Energy Industry Volume (Gigawatt) Forecast, by Application 2020 & 2033
- Table 41: France UK Offshore Wind Energy Industry Revenue (billion) Forecast, by Application 2020 & 2033
- Table 42: France UK Offshore Wind Energy Industry Volume (Gigawatt) Forecast, by Application 2020 & 2033
- Table 43: Italy UK Offshore Wind Energy Industry Revenue (billion) Forecast, by Application 2020 & 2033
- Table 44: Italy UK Offshore Wind Energy Industry Volume (Gigawatt) Forecast, by Application 2020 & 2033
- Table 45: Spain UK Offshore Wind Energy Industry Revenue (billion) Forecast, by Application 2020 & 2033
- Table 46: Spain UK Offshore Wind Energy Industry Volume (Gigawatt) Forecast, by Application 2020 & 2033
- Table 47: Russia UK Offshore Wind Energy Industry Revenue (billion) Forecast, by Application 2020 & 2033
- Table 48: Russia UK Offshore Wind Energy Industry Volume (Gigawatt) Forecast, by Application 2020 & 2033
- Table 49: Benelux UK Offshore Wind Energy Industry Revenue (billion) Forecast, by Application 2020 & 2033
- Table 50: Benelux UK Offshore Wind Energy Industry Volume (Gigawatt) Forecast, by Application 2020 & 2033
- Table 51: Nordics UK Offshore Wind Energy Industry Revenue (billion) Forecast, by Application 2020 & 2033
- Table 52: Nordics UK Offshore Wind Energy Industry Volume (Gigawatt) Forecast, by Application 2020 & 2033
- Table 53: Rest of Europe UK Offshore Wind Energy Industry Revenue (billion) Forecast, by Application 2020 & 2033
- Table 54: Rest of Europe UK Offshore Wind Energy Industry Volume (Gigawatt) Forecast, by Application 2020 & 2033
- Table 55: Global UK Offshore Wind Energy Industry Revenue billion Forecast, by Foundation Type 2020 & 2033
- Table 56: Global UK Offshore Wind Energy Industry Volume Gigawatt Forecast, by Foundation Type 2020 & 2033
- Table 57: Global UK Offshore Wind Energy Industry Revenue billion Forecast, by Capacity 2020 & 2033
- Table 58: Global UK Offshore Wind Energy Industry Volume Gigawatt Forecast, by Capacity 2020 & 2033
- Table 59: Global UK Offshore Wind Energy Industry Revenue billion Forecast, by Country 2020 & 2033
- Table 60: Global UK Offshore Wind Energy Industry Volume Gigawatt Forecast, by Country 2020 & 2033
- Table 61: Turkey UK Offshore Wind Energy Industry Revenue (billion) Forecast, by Application 2020 & 2033
- Table 62: Turkey UK Offshore Wind Energy Industry Volume (Gigawatt) Forecast, by Application 2020 & 2033
- Table 63: Israel UK Offshore Wind Energy Industry Revenue (billion) Forecast, by Application 2020 & 2033
- Table 64: Israel UK Offshore Wind Energy Industry Volume (Gigawatt) Forecast, by Application 2020 & 2033
- Table 65: GCC UK Offshore Wind Energy Industry Revenue (billion) Forecast, by Application 2020 & 2033
- Table 66: GCC UK Offshore Wind Energy Industry Volume (Gigawatt) Forecast, by Application 2020 & 2033
- Table 67: North Africa UK Offshore Wind Energy Industry Revenue (billion) Forecast, by Application 2020 & 2033
- Table 68: North Africa UK Offshore Wind Energy Industry Volume (Gigawatt) Forecast, by Application 2020 & 2033
- Table 69: South Africa UK Offshore Wind Energy Industry Revenue (billion) Forecast, by Application 2020 & 2033
- Table 70: South Africa UK Offshore Wind Energy Industry Volume (Gigawatt) Forecast, by Application 2020 & 2033
- Table 71: Rest of Middle East & Africa UK Offshore Wind Energy Industry Revenue (billion) Forecast, by Application 2020 & 2033
- Table 72: Rest of Middle East & Africa UK Offshore Wind Energy Industry Volume (Gigawatt) Forecast, by Application 2020 & 2033
- Table 73: Global UK Offshore Wind Energy Industry Revenue billion Forecast, by Foundation Type 2020 & 2033
- Table 74: Global UK Offshore Wind Energy Industry Volume Gigawatt Forecast, by Foundation Type 2020 & 2033
- Table 75: Global UK Offshore Wind Energy Industry Revenue billion Forecast, by Capacity 2020 & 2033
- Table 76: Global UK Offshore Wind Energy Industry Volume Gigawatt Forecast, by Capacity 2020 & 2033
- Table 77: Global UK Offshore Wind Energy Industry Revenue billion Forecast, by Country 2020 & 2033
- Table 78: Global UK Offshore Wind Energy Industry Volume Gigawatt Forecast, by Country 2020 & 2033
- Table 79: China UK Offshore Wind Energy Industry Revenue (billion) Forecast, by Application 2020 & 2033
- Table 80: China UK Offshore Wind Energy Industry Volume (Gigawatt) Forecast, by Application 2020 & 2033
- Table 81: India UK Offshore Wind Energy Industry Revenue (billion) Forecast, by Application 2020 & 2033
- Table 82: India UK Offshore Wind Energy Industry Volume (Gigawatt) Forecast, by Application 2020 & 2033
- Table 83: Japan UK Offshore Wind Energy Industry Revenue (billion) Forecast, by Application 2020 & 2033
- Table 84: Japan UK Offshore Wind Energy Industry Volume (Gigawatt) Forecast, by Application 2020 & 2033
- Table 85: South Korea UK Offshore Wind Energy Industry Revenue (billion) Forecast, by Application 2020 & 2033
- Table 86: South Korea UK Offshore Wind Energy Industry Volume (Gigawatt) Forecast, by Application 2020 & 2033
- Table 87: ASEAN UK Offshore Wind Energy Industry Revenue (billion) Forecast, by Application 2020 & 2033
- Table 88: ASEAN UK Offshore Wind Energy Industry Volume (Gigawatt) Forecast, by Application 2020 & 2033
- Table 89: Oceania UK Offshore Wind Energy Industry Revenue (billion) Forecast, by Application 2020 & 2033
- Table 90: Oceania UK Offshore Wind Energy Industry Volume (Gigawatt) Forecast, by Application 2020 & 2033
- Table 91: Rest of Asia Pacific UK Offshore Wind Energy Industry Revenue (billion) Forecast, by Application 2020 & 2033
- Table 92: Rest of Asia Pacific UK Offshore Wind Energy Industry Volume (Gigawatt) Forecast, by Application 2020 & 2033
Frequently Asked Questions
1. What is the projected Compound Annual Growth Rate (CAGR) of the UK Offshore Wind Energy Industry?
The projected CAGR is approximately 14.6%.
2. Which companies are prominent players in the UK Offshore Wind Energy Industry?
Key companies in the market include Scottish Power Ltd BP p l c, Shell Plc, Ocean Winds, Siemens Gamesa Renewable Energy S A, Orsted, EDF Renewables, Vattenfall AB, Vestas, GE RENEWABLE ENERGY.
3. What are the main segments of the UK Offshore Wind Energy Industry?
The market segments include Foundation Type, Capacity.
4. Can you provide details about the market size?
The market size is estimated to be USD 55.9 billion as of 2022.
5. What are some drivers contributing to market growth?
4.; Reduction in Energy Bills Due to Self-Power Consumption4.; Increasing Installation of Solar PV Modules in Residential Segment.
6. What are the notable trends driving market growth?
Floating Foundation Segment to Dominate the Market.
7. Are there any restraints impacting market growth?
4.; High Installation Cost as Compared to Rooftop PV Systems.
8. Can you provide examples of recent developments in the market?
On 17th January 2022, Shell plc and Scottish Power Ltd. Joint ventures won bids to develop 5 GW of floating wind power in the United Kingdom. Both the companies plan to build and operate two of the world's first large-scale floating offshore wind farms in the United Kingdom with a power generation capacity of 3 GW and 2 GW.
9. What pricing options are available for accessing the report?
Pricing options include single-user, multi-user, and enterprise licenses priced at USD 3800, USD 4500, and USD 5800 respectively.
10. Is the market size provided in terms of value or volume?
The market size is provided in terms of value, measured in billion and volume, measured in Gigawatt.
11. Are there any specific market keywords associated with the report?
Yes, the market keyword associated with the report is "UK Offshore Wind Energy Industry," which aids in identifying and referencing the specific market segment covered.
12. How do I determine which pricing option suits my needs best?
The pricing options vary based on user requirements and access needs. Individual users may opt for single-user licenses, while businesses requiring broader access may choose multi-user or enterprise licenses for cost-effective access to the report.
13. Are there any additional resources or data provided in the UK Offshore Wind Energy Industry report?
While the report offers comprehensive insights, it's advisable to review the specific contents or supplementary materials provided to ascertain if additional resources or data are available.
14. How can I stay updated on further developments or reports in the UK Offshore Wind Energy Industry?
To stay informed about further developments, trends, and reports in the UK Offshore Wind Energy Industry, consider subscribing to industry newsletters, following relevant companies and organizations, or regularly checking reputable industry news sources and publications.
Methodology
Step 1 - Identification of Relevant Samples Size from Population Database


Step 2 - Approaches for Defining Global Market Size (Value, Volume* & Price*)

Note*: In applicable scenarios
Step 3 - Data Sources
Primary Research
- Web Analytics
- Survey Reports
- Research Institute
- Latest Research Reports
- Opinion Leaders
Secondary Research
- Annual Reports
- White Paper
- Latest Press Release
- Industry Association
- Paid Database
- Investor Presentations

Step 4 - Data Triangulation
Involves using different sources of information in order to increase the validity of a study
These sources are likely to be stakeholders in a program - participants, other researchers, program staff, other community members, and so on.
Then we put all data in single framework & apply various statistical tools to find out the dynamic on the market.
During the analysis stage, feedback from the stakeholder groups would be compared to determine areas of agreement as well as areas of divergence