

Key Insights
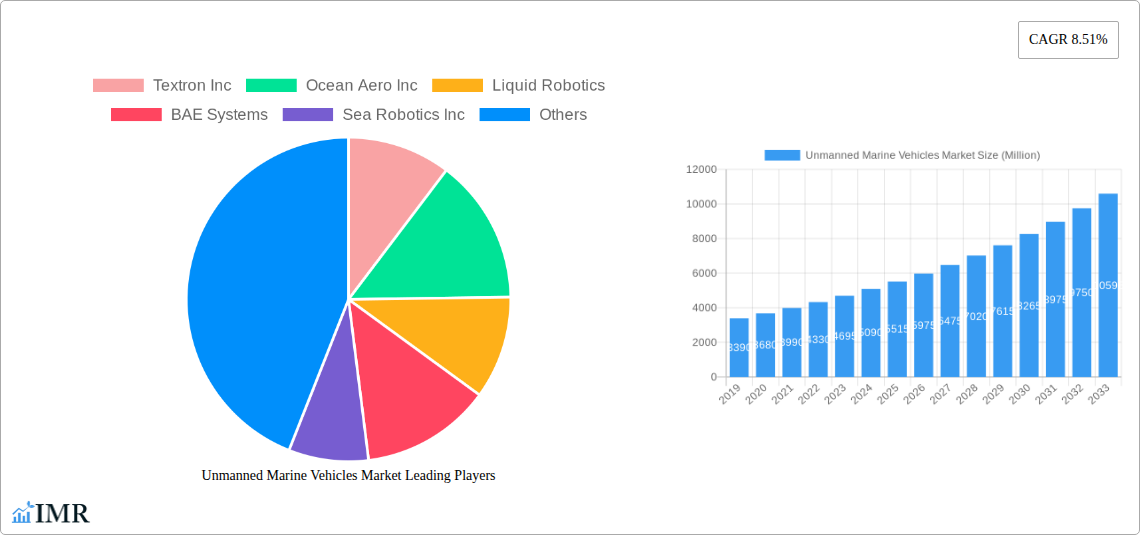
The Unmanned Marine Vehicles (UMV) market is experiencing robust growth, projected to reach a substantial USD 4.93 billion by 2025. This expansion is driven by a compelling Compound Annual Growth Rate (CAGR) of 8.51% throughout the forecast period of 2025-2033. A significant catalyst for this surge is the increasing adoption of UMVs across defense, research, and commercial sectors. In defense, these vehicles offer enhanced surveillance, mine countermeasures, and force protection capabilities, minimizing human risk in hazardous environments. The research sector leverages UMVs for oceanographic studies, environmental monitoring, and data collection in remote and challenging marine settings. Commercially, the demand is escalating for applications such as offshore infrastructure inspection, underwater surveying, and autonomous cargo transport, promising greater efficiency and cost savings. The market is characterized by a dynamic interplay between technological advancements and evolving operational needs, pushing the boundaries of what is possible in marine exploration and operations.
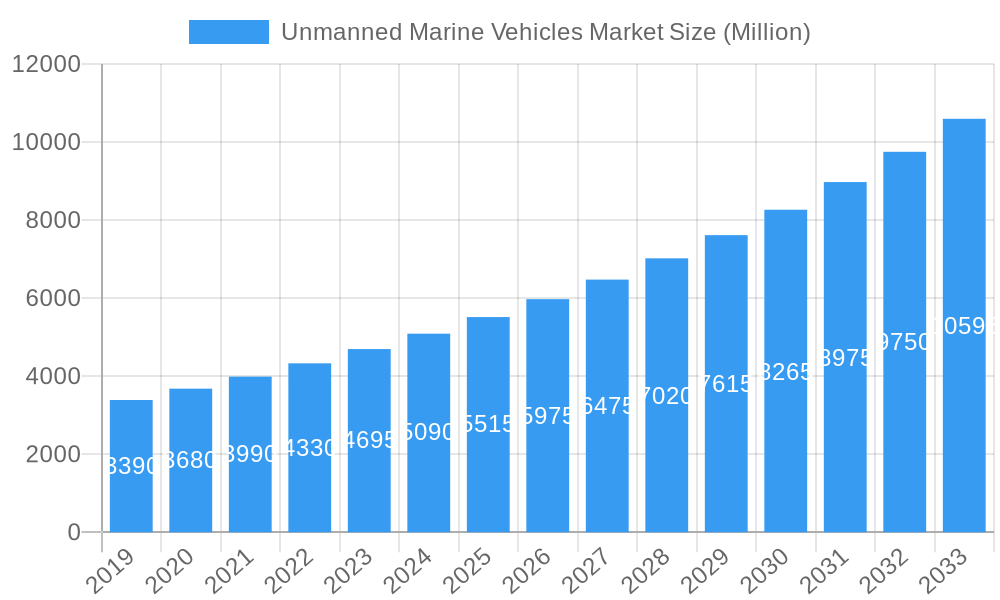
Unmanned Marine Vehicles Market Market Size (In Billion)
Further intensifying this growth trajectory are key market trends, including the relentless pursuit of greater autonomy in UMV operations, enabling them to perform complex missions with minimal human intervention. Advancements in artificial intelligence, sensor technology, and communication systems are central to this evolution. The increasing integration of artificial intelligence is enabling vehicles to make real-time decisions and adapt to unpredictable marine conditions. Furthermore, the development of sophisticated sensor payloads is enhancing data acquisition capabilities for a wide array of applications. Emerging trends also point towards the growing utilization of swarming technologies, where multiple UMVs coordinate their efforts to achieve objectives more effectively. Despite these positive drivers, certain restraints, such as high initial investment costs for advanced UMV systems and stringent regulatory frameworks in some regions, could moderate the pace of adoption. However, the continuous innovation in materials science and manufacturing processes is expected to gradually mitigate these cost-related challenges, paving the way for broader market penetration.
Unmanned Marine Vehicles Market Company Market Share
Unmanned Marine Vehicles Market Report: Navigating the Future of Maritime Autonomy
Explore the dynamic and rapidly expanding Unmanned Marine Vehicles (UMVs) market, a critical sector revolutionizing defense, research, and commercial maritime operations. This comprehensive report delves into market dynamics, growth trends, regional dominance, product innovations, key drivers, challenges, emerging opportunities, and strategic partnerships shaping the future of naval autonomy. Covering a study period from 2019 to 2033, with a base year of 2025, this analysis provides actionable insights for industry stakeholders. The global Unmanned Marine Vehicles market is projected to witness significant expansion, driven by increasing demand for advanced surveillance, reconnaissance, and data collection capabilities.
Unmanned Marine Vehicles Market Market Dynamics & Structure
The Unmanned Marine Vehicles (UMVs) market is characterized by a dynamic interplay of technological innovation, evolving regulatory frameworks, and shifting end-user demands. Market concentration varies across segments, with defense applications currently dominating, yet commercial and research sectors showing robust growth. Key drivers include advancements in artificial intelligence, sensor technology, and battery life, enabling more complex and persistent missions. Conversely, high development costs, stringent cybersecurity requirements, and the need for standardized operational protocols act as barriers to entry and innovation. Competition is intensifying, with established defense contractors vying alongside agile startups. Mergers and acquisitions (M&A) are becoming increasingly prevalent as companies seek to consolidate expertise, expand product portfolios, and gain market share. For instance, the partnership between Austal USA and Saildrone signifies a move towards larger-scale, persistent autonomous surface vehicle (ASV) development. End-user demographics are broadening, encompassing naval forces, scientific institutions, offshore energy companies, and even emerging applications in environmental monitoring and cargo transport. The pursuit of cost-effective, high-performance UMVs capable of operating in challenging environments fuels continuous product development and strategic alliances.
Unmanned Marine Vehicles Market Growth Trends & Insights
The Unmanned Marine Vehicles market is experiencing an unprecedented surge, driven by a confluence of technological advancements and a growing imperative for efficient and persistent maritime operations. Market size is projected to expand from an estimated xx Million units in 2025 to xx Million units by 2033, exhibiting a Compound Annual Growth Rate (CAGR) of approximately xx% during the forecast period. This growth is underpinned by escalating adoption rates across diverse sectors, particularly in defense for enhanced surveillance, mine countermeasures, and anti-submarine warfare, where the need for extended operational reach and reduced human risk is paramount. Technologically, the miniaturization of sensors, improvements in power efficiency, and breakthroughs in autonomous navigation and data processing are disrupting traditional maritime practices. Consumer behavior shifts are evident as commercial entities increasingly recognize the cost-saving and operational benefits of UMVs for tasks such as offshore infrastructure inspection, subsea surveying, and even nascent autonomous shipping routes. The integration of sophisticated AI algorithms allows UMVs to perform complex decision-making, reducing reliance on continuous human intervention and enabling swarm operations. This evolution is fostering a more data-centric approach to maritime management, where insights derived from UMV deployments inform strategic planning and operational efficiency. The market penetration of UMVs, while still in its growth phase, is rapidly accelerating as reliability increases and deployment costs become more accessible.
Dominant Regions, Countries, or Segments in Unmanned Marine Vehicles Market
The Unmanned Marine Vehicles (UMVs) market's dominance is currently most pronounced in the Defense application segment, driven by significant government investments and the strategic importance of maritime security. Within this segment, Autonomous control types are rapidly gaining traction over Remotely Operated systems, reflecting a global push towards enhanced operational independence and reduced manning requirements. Geographically, North America and Europe are leading the charge, largely due to their advanced naval capabilities, substantial defense budgets, and robust research and development infrastructure.
Defense Application Dominance:
- Rationale: National security concerns, territorial waters protection, counter-terrorism, and power projection are primary drivers.
- Key Factors: Government procurement programs, military modernization initiatives, and the perceived strategic advantage of unmanned systems.
- Market Share: Defense applications are estimated to command over xx% of the total UMV market share in 2025.
- Growth Potential: Continued innovation in combat-ready UMVs and persistent surveillance capabilities ensure sustained growth.
Autonomous Control Type Ascendancy:
- Rationale: Enhanced operational efficiency, reduced communication latency issues, and the ability to conduct complex missions without constant human oversight.
- Key Factors: Advancements in AI, machine learning, and sophisticated navigation systems.
- Market Share: Autonomous UMVs are projected to capture over xx% of the market by 2033.
- Growth Potential: Development of "swarming" capabilities and AI-driven decision-making will further accelerate adoption.
Regional Leadership (North America & Europe):
- Rationale: Strong established defense industries, significant R&D funding, and proactive adoption of emerging technologies.
- Key Factors: Active naval exercises, strategic alliances, and government-supported innovation programs.
- Market Share: These regions collectively account for an estimated xx% of the global UMV market.
- Growth Potential: Continued government support and private sector investment in UMV research and manufacturing.
Surface Vehicle Growth: While Underwater Vehicles have traditionally seen significant investment due to their stealth and deep-sea capabilities, Surface Vehicles are witnessing accelerated growth. This is driven by their cost-effectiveness, ease of deployment, and versatility for roles like persistent monitoring, maritime domain awareness, and even logistics. Their market share is expected to grow from xx% in 2025 to xx% by 2033, challenging the historical dominance of underwater platforms in certain applications.
Unmanned Marine Vehicles Market Product Landscape
The Unmanned Marine Vehicles (UMVs) market is characterized by a continuous stream of product innovations aimed at enhancing performance, versatility, and operational endurance. Key advancements include the development of modular payloads for adaptable mission profiles, improved energy-efficient propulsion systems leading to extended endurance (e.g., Riptide UUV-12 by BAE Systems), and sophisticated sensor integration for high-resolution data acquisition. The emergence of purpose-built vehicles like Textron Systems' CottonmouthTM for advanced reconnaissance highlights a trend towards application-specific designs. Furthermore, the integration of artificial intelligence is enabling greater autonomy, allowing UMVs to navigate complex environments, identify targets, and make real-time decisions, thereby expanding their application scope beyond traditional roles into areas like subsea asset inspection and environmental monitoring.
Key Drivers, Barriers & Challenges in Unmanned Marine Vehicles Market
Key Drivers:
- Technological Advancements: Innovations in AI, robotics, sensor technology, and power systems are enhancing UMV capabilities and reducing costs.
- Defense Modernization: Nations are increasingly investing in UMVs for enhanced surveillance, reconnaissance, and asymmetric warfare capabilities.
- Cost-Effectiveness: UMVs offer a more economical alternative to manned vessels for many maritime tasks, reducing operational and personnel expenses.
- Persistent Operations: UMVs can operate for extended periods in remote or hazardous environments, providing continuous data and presence.
Barriers & Challenges:
- High Development Costs: The initial investment in research, development, and manufacturing of advanced UMVs remains significant.
- Regulatory Hurdles: Evolving international and national regulations for UMV operations and data sharing create uncertainty.
- Cybersecurity Threats: Protecting UMV systems and their data from cyberattacks is a critical concern.
- Infrastructure and Support: Establishing adequate shore-based infrastructure for deployment, maintenance, and data management is challenging.
- Public Perception and Acceptance: Gaining public trust and acceptance for autonomous maritime systems, especially in civilian applications, is crucial.
- Interoperability Standards: The lack of universal interoperability standards can hinder the integration of different UMV systems and their seamless operation with existing naval platforms.
Emerging Opportunities in Unmanned Marine Vehicles Market
Emerging opportunities in the Unmanned Marine Vehicles (UMVs) market lie in the expansion of commercial applications, such as subsea pipeline inspection, offshore wind farm monitoring, and autonomous cargo delivery. The growing demand for detailed oceanographic data for climate research and resource management presents a significant avenue for growth. Furthermore, the development of UMV "swarms" for coordinated surveillance and intervention operations, as well as the integration of UMVs with other autonomous platforms (e.g., aerial drones), opens up new frontiers for complex mission execution. The increasing focus on sustainable shipping and the need for environmental monitoring also presents a substantial market for specialized UMVs.
Growth Accelerators in the Unmanned Marine Vehicles Market Industry
Several catalysts are accelerating the growth of the Unmanned Marine Vehicles (UMVs) market. Technological breakthroughs in areas such as long-endurance power sources (e.g., solar-powered ASVs like Saildrone Surveyor), advanced artificial intelligence for decision-making and navigation, and miniaturized, high-fidelity sensors are making UMVs more capable and cost-effective. Strategic partnerships between established defense contractors and innovative startups, like the Austal USA and Saildrone collaboration, are fostering rapid product development and market penetration. Moreover, increasing government initiatives and funding for autonomous systems, particularly in naval defense and maritime research, are providing substantial impetus. The growing adoption of UMVs by commercial sectors for efficiency gains and risk reduction further amplifies this growth trajectory.
Key Players Shaping the Unmanned Marine Vehicles Market Market
- Textron Inc
- Ocean Aero Inc
- Liquid Robotics
- BAE Systems
- Sea Robotics Inc
- ECA Group
- Rafael Advanced Defense Systems
- Atlas Elektronik
- Thales Group
- General Dynamics
- Northrop Grumman
- Pelorus Naval Systems
- ASV Globa
- Teledyne Technologies Inc
Notable Milestones in Unmanned Marine Vehicles Market Sector
- August 2022: Austal USA announced a partnership with California-based Saildrone to build Saildrone Surveyor autonomous 'uncrewed' surface vehicles in Alabama. This collaboration aims to enhance maritime domain awareness and hydrographic survey capabilities for government agencies.
- November 2021: Teledyne Marine partnered with Seatronics to expand the distribution of Bowtech underwater cameras, lights, and strobes across Europe, the Americas, and the Asia-Pacific, strengthening global after-sale care.
- July 2021: Textron Systems announced a pre-award agreement with the United States Marine Corps for its CottonmouthTM Advanced Reconnaissance Vehicle prototype, indicating significant potential for future production.
- March 2021: BAE Systems unveiled its Riptide UUV-12, an adaptable unmanned undersea vehicle designed to accommodate a variety of mission requirements and power-hungry payloads.
In-Depth Unmanned Marine Vehicles Market Market Outlook
The future outlook for the Unmanned Marine Vehicles (UMVs) market is exceptionally promising, fueled by continued advancements in autonomy, power efficiency, and sensor integration. Strategic partnerships are expected to play a pivotal role in accelerating innovation and market expansion, as seen in collaborations between established players and agile tech firms. The increasing recognition of UMVs as essential tools for national security, scientific exploration, and commercial efficiency will drive sustained demand. Investments in AI-powered decision-making and swarm capabilities will unlock new operational paradigms, while a growing focus on environmental monitoring and sustainable maritime practices will create significant untapped market potential. The UMV market is poised to redefine maritime operations, offering enhanced capabilities and economic advantages across a broad spectrum of industries.
Unmanned Marine Vehicles Market Segmentation
-
1. Type
- 1.1. Surface Vehicle
- 1.2. Underwater Vehicle
-
2. Control Type
- 2.1. Remotely Operated
- 2.2. Autonomous
-
3. Application
- 3.1. Defense
- 3.2. Research
- 3.3. Commercial
- 3.4. Other Applications
Unmanned Marine Vehicles Market Segmentation By Geography
-
1. North America
- 1.1. United States
- 1.2. Canada
-
2. Europe
- 2.1. Germany
- 2.2. Italy
- 2.3. France
- 2.4. Rest of Europe
-
3. Asia Pacific
- 3.1. China
- 3.2. Japan
- 3.3. India
- 3.4. Australia
- 3.5. Rest of Asia Pacific
-
4. Latin America
- 4.1. Brazil
- 4.2. Rest of Latin America
-
5. Middle East and Africa
- 5.1. South Africa
- 5.2. Rest of Middle East and Africa
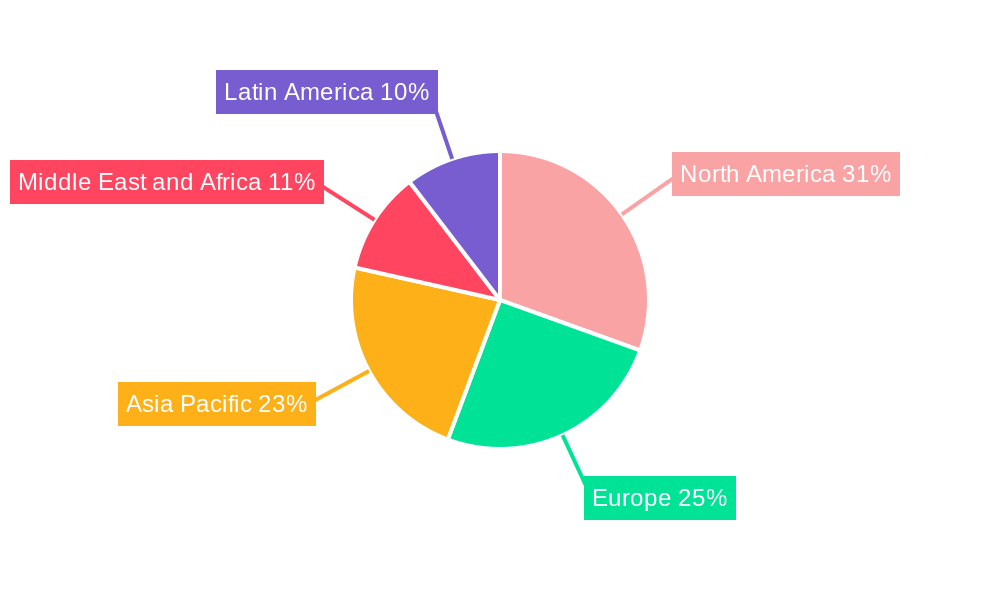
Unmanned Marine Vehicles Market Regional Market Share
Geographic Coverage of Unmanned Marine Vehicles Market
Unmanned Marine Vehicles Market REPORT HIGHLIGHTS
| Aspects | Details |
|---|---|
| Study Period | 2020-2034 |
| Base Year | 2025 |
| Estimated Year | 2026 |
| Forecast Period | 2026-2034 |
| Historical Period | 2020-2025 |
| Growth Rate | CAGR of 8.51% from 2020-2034 |
| Segmentation |
|
Table of Contents
- 1. Introduction
- 1.1. Research Scope
- 1.2. Market Segmentation
- 1.3. Research Objective
- 1.4. Definitions and Assumptions
- 2. Executive Summary
- 2.1. Market Snapshot
- 3. Market Dynamics
- 3.1. Market Drivers
- 3.2. Market Restrains
- 3.3. Market Trends
- 3.4. Market Opportunities
- 4. Market Factor Analysis
- 4.1. Porters Five Forces
- 4.1.1. Bargaining Power of Suppliers
- 4.1.2. Bargaining Power of Buyers
- 4.1.3. Threat of New Entrants
- 4.1.4. Threat of Substitutes
- 4.1.5. Competitive Rivalry
- 4.2. PESTEL analysis
- 4.3. BCG Analysis
- 4.3.1. Stars (High Growth, High Market Share)
- 4.3.2. Cash Cows (Low Growth, High Market Share)
- 4.3.3. Question Mark (High Growth, Low Market Share)
- 4.3.4. Dogs (Low Growth, Low Market Share)
- 4.4. Ansoff Matrix Analysis
- 4.5. Supply Chain Analysis
- 4.6. Regulatory Landscape
- 4.7. Current Market Potential and Opportunity Assessment (TAM–SAM–SOM Framework)
- 4.8. IMR Analyst Note
- 4.1. Porters Five Forces
- 5. Market Analysis, Insights and Forecast 2021-2033
- 5.1. Market Analysis, Insights and Forecast - by Type
- 5.1.1. Surface Vehicle
- 5.1.2. Underwater Vehicle
- 5.2. Market Analysis, Insights and Forecast - by Control Type
- 5.2.1. Remotely Operated
- 5.2.2. Autonomous
- 5.3. Market Analysis, Insights and Forecast - by Application
- 5.3.1. Defense
- 5.3.2. Research
- 5.3.3. Commercial
- 5.3.4. Other Applications
- 5.4. Market Analysis, Insights and Forecast - by Region
- 5.4.1. North America
- 5.4.2. Europe
- 5.4.3. Asia Pacific
- 5.4.4. Latin America
- 5.4.5. Middle East and Africa
- 5.1. Market Analysis, Insights and Forecast - by Type
- 6. Global Unmanned Marine Vehicles Market Analysis, Insights and Forecast, 2021-2033
- 6.1. Market Analysis, Insights and Forecast - by Type
- 6.1.1. Surface Vehicle
- 6.1.2. Underwater Vehicle
- 6.2. Market Analysis, Insights and Forecast - by Control Type
- 6.2.1. Remotely Operated
- 6.2.2. Autonomous
- 6.3. Market Analysis, Insights and Forecast - by Application
- 6.3.1. Defense
- 6.3.2. Research
- 6.3.3. Commercial
- 6.3.4. Other Applications
- 6.1. Market Analysis, Insights and Forecast - by Type
- 7. North America Unmanned Marine Vehicles Market Analysis, Insights and Forecast, 2020-2032
- 7.1. Market Analysis, Insights and Forecast - by Type
- 7.1.1. Surface Vehicle
- 7.1.2. Underwater Vehicle
- 7.2. Market Analysis, Insights and Forecast - by Control Type
- 7.2.1. Remotely Operated
- 7.2.2. Autonomous
- 7.3. Market Analysis, Insights and Forecast - by Application
- 7.3.1. Defense
- 7.3.2. Research
- 7.3.3. Commercial
- 7.3.4. Other Applications
- 7.1. Market Analysis, Insights and Forecast - by Type
- 8. Europe Unmanned Marine Vehicles Market Analysis, Insights and Forecast, 2020-2032
- 8.1. Market Analysis, Insights and Forecast - by Type
- 8.1.1. Surface Vehicle
- 8.1.2. Underwater Vehicle
- 8.2. Market Analysis, Insights and Forecast - by Control Type
- 8.2.1. Remotely Operated
- 8.2.2. Autonomous
- 8.3. Market Analysis, Insights and Forecast - by Application
- 8.3.1. Defense
- 8.3.2. Research
- 8.3.3. Commercial
- 8.3.4. Other Applications
- 8.1. Market Analysis, Insights and Forecast - by Type
- 9. Asia Pacific Unmanned Marine Vehicles Market Analysis, Insights and Forecast, 2020-2032
- 9.1. Market Analysis, Insights and Forecast - by Type
- 9.1.1. Surface Vehicle
- 9.1.2. Underwater Vehicle
- 9.2. Market Analysis, Insights and Forecast - by Control Type
- 9.2.1. Remotely Operated
- 9.2.2. Autonomous
- 9.3. Market Analysis, Insights and Forecast - by Application
- 9.3.1. Defense
- 9.3.2. Research
- 9.3.3. Commercial
- 9.3.4. Other Applications
- 9.1. Market Analysis, Insights and Forecast - by Type
- 10. Latin America Unmanned Marine Vehicles Market Analysis, Insights and Forecast, 2020-2032
- 10.1. Market Analysis, Insights and Forecast - by Type
- 10.1.1. Surface Vehicle
- 10.1.2. Underwater Vehicle
- 10.2. Market Analysis, Insights and Forecast - by Control Type
- 10.2.1. Remotely Operated
- 10.2.2. Autonomous
- 10.3. Market Analysis, Insights and Forecast - by Application
- 10.3.1. Defense
- 10.3.2. Research
- 10.3.3. Commercial
- 10.3.4. Other Applications
- 10.1. Market Analysis, Insights and Forecast - by Type
- 11. Middle East and Africa Unmanned Marine Vehicles Market Analysis, Insights and Forecast, 2020-2032
- 11.1. Market Analysis, Insights and Forecast - by Type
- 11.1.1. Surface Vehicle
- 11.1.2. Underwater Vehicle
- 11.2. Market Analysis, Insights and Forecast - by Control Type
- 11.2.1. Remotely Operated
- 11.2.2. Autonomous
- 11.3. Market Analysis, Insights and Forecast - by Application
- 11.3.1. Defense
- 11.3.2. Research
- 11.3.3. Commercial
- 11.3.4. Other Applications
- 11.1. Market Analysis, Insights and Forecast - by Type
- 12. Competitive Analysis
- 12.1. Company Profiles
- 12.1.1 Textron Inc
- 12.1.1.1. Company Overview
- 12.1.1.2. Products
- 12.1.1.3. Company Financials
- 12.1.1.4. SWOT Analysis
- 12.1.2 Ocean Aero Inc
- 12.1.2.1. Company Overview
- 12.1.2.2. Products
- 12.1.2.3. Company Financials
- 12.1.2.4. SWOT Analysis
- 12.1.3 Liquid Robotics
- 12.1.3.1. Company Overview
- 12.1.3.2. Products
- 12.1.3.3. Company Financials
- 12.1.3.4. SWOT Analysis
- 12.1.4 BAE Systems
- 12.1.4.1. Company Overview
- 12.1.4.2. Products
- 12.1.4.3. Company Financials
- 12.1.4.4. SWOT Analysis
- 12.1.5 Sea Robotics Inc
- 12.1.5.1. Company Overview
- 12.1.5.2. Products
- 12.1.5.3. Company Financials
- 12.1.5.4. SWOT Analysis
- 12.1.6 ECA Group
- 12.1.6.1. Company Overview
- 12.1.6.2. Products
- 12.1.6.3. Company Financials
- 12.1.6.4. SWOT Analysis
- 12.1.7 Rafael Advanced Defense Systems
- 12.1.7.1. Company Overview
- 12.1.7.2. Products
- 12.1.7.3. Company Financials
- 12.1.7.4. SWOT Analysis
- 12.1.8 Atlas Elektronik
- 12.1.8.1. Company Overview
- 12.1.8.2. Products
- 12.1.8.3. Company Financials
- 12.1.8.4. SWOT Analysis
- 12.1.9 Thales Group
- 12.1.9.1. Company Overview
- 12.1.9.2. Products
- 12.1.9.3. Company Financials
- 12.1.9.4. SWOT Analysis
- 12.1.10 General Dynamics
- 12.1.10.1. Company Overview
- 12.1.10.2. Products
- 12.1.10.3. Company Financials
- 12.1.10.4. SWOT Analysis
- 12.1.11 Northrop Grumman
- 12.1.11.1. Company Overview
- 12.1.11.2. Products
- 12.1.11.3. Company Financials
- 12.1.11.4. SWOT Analysis
- 12.1.12 Pelorus Naval Systems
- 12.1.12.1. Company Overview
- 12.1.12.2. Products
- 12.1.12.3. Company Financials
- 12.1.12.4. SWOT Analysis
- 12.1.13 ASV Globa
- 12.1.13.1. Company Overview
- 12.1.13.2. Products
- 12.1.13.3. Company Financials
- 12.1.13.4. SWOT Analysis
- 12.1.14 Teledyne Technologies Inc
- 12.1.14.1. Company Overview
- 12.1.14.2. Products
- 12.1.14.3. Company Financials
- 12.1.14.4. SWOT Analysis
- 12.1.1 Textron Inc
- 12.2. Market Entropy
- 12.2.1 Company's Key Areas Served
- 12.2.2 Recent Developments
- 12.3. Company Market Share Analysis 2025
- 12.3.1 Top 5 Companies Market Share Analysis
- 12.3.2 Top 3 Companies Market Share Analysis
- 12.4. List of Potential Customers
- 13. Research Methodology
List of Figures
- Figure 1: Global Unmanned Marine Vehicles Market Revenue Breakdown (Million, %) by Region 2025 & 2033
- Figure 2: Global Unmanned Marine Vehicles Market Volume Breakdown (K Unit, %) by Region 2025 & 2033
- Figure 3: North America Unmanned Marine Vehicles Market Revenue (Million), by Type 2025 & 2033
- Figure 4: North America Unmanned Marine Vehicles Market Volume (K Unit), by Type 2025 & 2033
- Figure 5: North America Unmanned Marine Vehicles Market Revenue Share (%), by Type 2025 & 2033
- Figure 6: North America Unmanned Marine Vehicles Market Volume Share (%), by Type 2025 & 2033
- Figure 7: North America Unmanned Marine Vehicles Market Revenue (Million), by Control Type 2025 & 2033
- Figure 8: North America Unmanned Marine Vehicles Market Volume (K Unit), by Control Type 2025 & 2033
- Figure 9: North America Unmanned Marine Vehicles Market Revenue Share (%), by Control Type 2025 & 2033
- Figure 10: North America Unmanned Marine Vehicles Market Volume Share (%), by Control Type 2025 & 2033
- Figure 11: North America Unmanned Marine Vehicles Market Revenue (Million), by Application 2025 & 2033
- Figure 12: North America Unmanned Marine Vehicles Market Volume (K Unit), by Application 2025 & 2033
- Figure 13: North America Unmanned Marine Vehicles Market Revenue Share (%), by Application 2025 & 2033
- Figure 14: North America Unmanned Marine Vehicles Market Volume Share (%), by Application 2025 & 2033
- Figure 15: North America Unmanned Marine Vehicles Market Revenue (Million), by Country 2025 & 2033
- Figure 16: North America Unmanned Marine Vehicles Market Volume (K Unit), by Country 2025 & 2033
- Figure 17: North America Unmanned Marine Vehicles Market Revenue Share (%), by Country 2025 & 2033
- Figure 18: North America Unmanned Marine Vehicles Market Volume Share (%), by Country 2025 & 2033
- Figure 19: Europe Unmanned Marine Vehicles Market Revenue (Million), by Type 2025 & 2033
- Figure 20: Europe Unmanned Marine Vehicles Market Volume (K Unit), by Type 2025 & 2033
- Figure 21: Europe Unmanned Marine Vehicles Market Revenue Share (%), by Type 2025 & 2033
- Figure 22: Europe Unmanned Marine Vehicles Market Volume Share (%), by Type 2025 & 2033
- Figure 23: Europe Unmanned Marine Vehicles Market Revenue (Million), by Control Type 2025 & 2033
- Figure 24: Europe Unmanned Marine Vehicles Market Volume (K Unit), by Control Type 2025 & 2033
- Figure 25: Europe Unmanned Marine Vehicles Market Revenue Share (%), by Control Type 2025 & 2033
- Figure 26: Europe Unmanned Marine Vehicles Market Volume Share (%), by Control Type 2025 & 2033
- Figure 27: Europe Unmanned Marine Vehicles Market Revenue (Million), by Application 2025 & 2033
- Figure 28: Europe Unmanned Marine Vehicles Market Volume (K Unit), by Application 2025 & 2033
- Figure 29: Europe Unmanned Marine Vehicles Market Revenue Share (%), by Application 2025 & 2033
- Figure 30: Europe Unmanned Marine Vehicles Market Volume Share (%), by Application 2025 & 2033
- Figure 31: Europe Unmanned Marine Vehicles Market Revenue (Million), by Country 2025 & 2033
- Figure 32: Europe Unmanned Marine Vehicles Market Volume (K Unit), by Country 2025 & 2033
- Figure 33: Europe Unmanned Marine Vehicles Market Revenue Share (%), by Country 2025 & 2033
- Figure 34: Europe Unmanned Marine Vehicles Market Volume Share (%), by Country 2025 & 2033
- Figure 35: Asia Pacific Unmanned Marine Vehicles Market Revenue (Million), by Type 2025 & 2033
- Figure 36: Asia Pacific Unmanned Marine Vehicles Market Volume (K Unit), by Type 2025 & 2033
- Figure 37: Asia Pacific Unmanned Marine Vehicles Market Revenue Share (%), by Type 2025 & 2033
- Figure 38: Asia Pacific Unmanned Marine Vehicles Market Volume Share (%), by Type 2025 & 2033
- Figure 39: Asia Pacific Unmanned Marine Vehicles Market Revenue (Million), by Control Type 2025 & 2033
- Figure 40: Asia Pacific Unmanned Marine Vehicles Market Volume (K Unit), by Control Type 2025 & 2033
- Figure 41: Asia Pacific Unmanned Marine Vehicles Market Revenue Share (%), by Control Type 2025 & 2033
- Figure 42: Asia Pacific Unmanned Marine Vehicles Market Volume Share (%), by Control Type 2025 & 2033
- Figure 43: Asia Pacific Unmanned Marine Vehicles Market Revenue (Million), by Application 2025 & 2033
- Figure 44: Asia Pacific Unmanned Marine Vehicles Market Volume (K Unit), by Application 2025 & 2033
- Figure 45: Asia Pacific Unmanned Marine Vehicles Market Revenue Share (%), by Application 2025 & 2033
- Figure 46: Asia Pacific Unmanned Marine Vehicles Market Volume Share (%), by Application 2025 & 2033
- Figure 47: Asia Pacific Unmanned Marine Vehicles Market Revenue (Million), by Country 2025 & 2033
- Figure 48: Asia Pacific Unmanned Marine Vehicles Market Volume (K Unit), by Country 2025 & 2033
- Figure 49: Asia Pacific Unmanned Marine Vehicles Market Revenue Share (%), by Country 2025 & 2033
- Figure 50: Asia Pacific Unmanned Marine Vehicles Market Volume Share (%), by Country 2025 & 2033
- Figure 51: Latin America Unmanned Marine Vehicles Market Revenue (Million), by Type 2025 & 2033
- Figure 52: Latin America Unmanned Marine Vehicles Market Volume (K Unit), by Type 2025 & 2033
- Figure 53: Latin America Unmanned Marine Vehicles Market Revenue Share (%), by Type 2025 & 2033
- Figure 54: Latin America Unmanned Marine Vehicles Market Volume Share (%), by Type 2025 & 2033
- Figure 55: Latin America Unmanned Marine Vehicles Market Revenue (Million), by Control Type 2025 & 2033
- Figure 56: Latin America Unmanned Marine Vehicles Market Volume (K Unit), by Control Type 2025 & 2033
- Figure 57: Latin America Unmanned Marine Vehicles Market Revenue Share (%), by Control Type 2025 & 2033
- Figure 58: Latin America Unmanned Marine Vehicles Market Volume Share (%), by Control Type 2025 & 2033
- Figure 59: Latin America Unmanned Marine Vehicles Market Revenue (Million), by Application 2025 & 2033
- Figure 60: Latin America Unmanned Marine Vehicles Market Volume (K Unit), by Application 2025 & 2033
- Figure 61: Latin America Unmanned Marine Vehicles Market Revenue Share (%), by Application 2025 & 2033
- Figure 62: Latin America Unmanned Marine Vehicles Market Volume Share (%), by Application 2025 & 2033
- Figure 63: Latin America Unmanned Marine Vehicles Market Revenue (Million), by Country 2025 & 2033
- Figure 64: Latin America Unmanned Marine Vehicles Market Volume (K Unit), by Country 2025 & 2033
- Figure 65: Latin America Unmanned Marine Vehicles Market Revenue Share (%), by Country 2025 & 2033
- Figure 66: Latin America Unmanned Marine Vehicles Market Volume Share (%), by Country 2025 & 2033
- Figure 67: Middle East and Africa Unmanned Marine Vehicles Market Revenue (Million), by Type 2025 & 2033
- Figure 68: Middle East and Africa Unmanned Marine Vehicles Market Volume (K Unit), by Type 2025 & 2033
- Figure 69: Middle East and Africa Unmanned Marine Vehicles Market Revenue Share (%), by Type 2025 & 2033
- Figure 70: Middle East and Africa Unmanned Marine Vehicles Market Volume Share (%), by Type 2025 & 2033
- Figure 71: Middle East and Africa Unmanned Marine Vehicles Market Revenue (Million), by Control Type 2025 & 2033
- Figure 72: Middle East and Africa Unmanned Marine Vehicles Market Volume (K Unit), by Control Type 2025 & 2033
- Figure 73: Middle East and Africa Unmanned Marine Vehicles Market Revenue Share (%), by Control Type 2025 & 2033
- Figure 74: Middle East and Africa Unmanned Marine Vehicles Market Volume Share (%), by Control Type 2025 & 2033
- Figure 75: Middle East and Africa Unmanned Marine Vehicles Market Revenue (Million), by Application 2025 & 2033
- Figure 76: Middle East and Africa Unmanned Marine Vehicles Market Volume (K Unit), by Application 2025 & 2033
- Figure 77: Middle East and Africa Unmanned Marine Vehicles Market Revenue Share (%), by Application 2025 & 2033
- Figure 78: Middle East and Africa Unmanned Marine Vehicles Market Volume Share (%), by Application 2025 & 2033
- Figure 79: Middle East and Africa Unmanned Marine Vehicles Market Revenue (Million), by Country 2025 & 2033
- Figure 80: Middle East and Africa Unmanned Marine Vehicles Market Volume (K Unit), by Country 2025 & 2033
- Figure 81: Middle East and Africa Unmanned Marine Vehicles Market Revenue Share (%), by Country 2025 & 2033
- Figure 82: Middle East and Africa Unmanned Marine Vehicles Market Volume Share (%), by Country 2025 & 2033
List of Tables
- Table 1: Global Unmanned Marine Vehicles Market Revenue Million Forecast, by Type 2020 & 2033
- Table 2: Global Unmanned Marine Vehicles Market Volume K Unit Forecast, by Type 2020 & 2033
- Table 3: Global Unmanned Marine Vehicles Market Revenue Million Forecast, by Control Type 2020 & 2033
- Table 4: Global Unmanned Marine Vehicles Market Volume K Unit Forecast, by Control Type 2020 & 2033
- Table 5: Global Unmanned Marine Vehicles Market Revenue Million Forecast, by Application 2020 & 2033
- Table 6: Global Unmanned Marine Vehicles Market Volume K Unit Forecast, by Application 2020 & 2033
- Table 7: Global Unmanned Marine Vehicles Market Revenue Million Forecast, by Region 2020 & 2033
- Table 8: Global Unmanned Marine Vehicles Market Volume K Unit Forecast, by Region 2020 & 2033
- Table 9: Global Unmanned Marine Vehicles Market Revenue Million Forecast, by Type 2020 & 2033
- Table 10: Global Unmanned Marine Vehicles Market Volume K Unit Forecast, by Type 2020 & 2033
- Table 11: Global Unmanned Marine Vehicles Market Revenue Million Forecast, by Control Type 2020 & 2033
- Table 12: Global Unmanned Marine Vehicles Market Volume K Unit Forecast, by Control Type 2020 & 2033
- Table 13: Global Unmanned Marine Vehicles Market Revenue Million Forecast, by Application 2020 & 2033
- Table 14: Global Unmanned Marine Vehicles Market Volume K Unit Forecast, by Application 2020 & 2033
- Table 15: Global Unmanned Marine Vehicles Market Revenue Million Forecast, by Country 2020 & 2033
- Table 16: Global Unmanned Marine Vehicles Market Volume K Unit Forecast, by Country 2020 & 2033
- Table 17: United States Unmanned Marine Vehicles Market Revenue (Million) Forecast, by Application 2020 & 2033
- Table 18: United States Unmanned Marine Vehicles Market Volume (K Unit) Forecast, by Application 2020 & 2033
- Table 19: Canada Unmanned Marine Vehicles Market Revenue (Million) Forecast, by Application 2020 & 2033
- Table 20: Canada Unmanned Marine Vehicles Market Volume (K Unit) Forecast, by Application 2020 & 2033
- Table 21: Global Unmanned Marine Vehicles Market Revenue Million Forecast, by Type 2020 & 2033
- Table 22: Global Unmanned Marine Vehicles Market Volume K Unit Forecast, by Type 2020 & 2033
- Table 23: Global Unmanned Marine Vehicles Market Revenue Million Forecast, by Control Type 2020 & 2033
- Table 24: Global Unmanned Marine Vehicles Market Volume K Unit Forecast, by Control Type 2020 & 2033
- Table 25: Global Unmanned Marine Vehicles Market Revenue Million Forecast, by Application 2020 & 2033
- Table 26: Global Unmanned Marine Vehicles Market Volume K Unit Forecast, by Application 2020 & 2033
- Table 27: Global Unmanned Marine Vehicles Market Revenue Million Forecast, by Country 2020 & 2033
- Table 28: Global Unmanned Marine Vehicles Market Volume K Unit Forecast, by Country 2020 & 2033
- Table 29: Germany Unmanned Marine Vehicles Market Revenue (Million) Forecast, by Application 2020 & 2033
- Table 30: Germany Unmanned Marine Vehicles Market Volume (K Unit) Forecast, by Application 2020 & 2033
- Table 31: Italy Unmanned Marine Vehicles Market Revenue (Million) Forecast, by Application 2020 & 2033
- Table 32: Italy Unmanned Marine Vehicles Market Volume (K Unit) Forecast, by Application 2020 & 2033
- Table 33: France Unmanned Marine Vehicles Market Revenue (Million) Forecast, by Application 2020 & 2033
- Table 34: France Unmanned Marine Vehicles Market Volume (K Unit) Forecast, by Application 2020 & 2033
- Table 35: Rest of Europe Unmanned Marine Vehicles Market Revenue (Million) Forecast, by Application 2020 & 2033
- Table 36: Rest of Europe Unmanned Marine Vehicles Market Volume (K Unit) Forecast, by Application 2020 & 2033
- Table 37: Global Unmanned Marine Vehicles Market Revenue Million Forecast, by Type 2020 & 2033
- Table 38: Global Unmanned Marine Vehicles Market Volume K Unit Forecast, by Type 2020 & 2033
- Table 39: Global Unmanned Marine Vehicles Market Revenue Million Forecast, by Control Type 2020 & 2033
- Table 40: Global Unmanned Marine Vehicles Market Volume K Unit Forecast, by Control Type 2020 & 2033
- Table 41: Global Unmanned Marine Vehicles Market Revenue Million Forecast, by Application 2020 & 2033
- Table 42: Global Unmanned Marine Vehicles Market Volume K Unit Forecast, by Application 2020 & 2033
- Table 43: Global Unmanned Marine Vehicles Market Revenue Million Forecast, by Country 2020 & 2033
- Table 44: Global Unmanned Marine Vehicles Market Volume K Unit Forecast, by Country 2020 & 2033
- Table 45: China Unmanned Marine Vehicles Market Revenue (Million) Forecast, by Application 2020 & 2033
- Table 46: China Unmanned Marine Vehicles Market Volume (K Unit) Forecast, by Application 2020 & 2033
- Table 47: Japan Unmanned Marine Vehicles Market Revenue (Million) Forecast, by Application 2020 & 2033
- Table 48: Japan Unmanned Marine Vehicles Market Volume (K Unit) Forecast, by Application 2020 & 2033
- Table 49: India Unmanned Marine Vehicles Market Revenue (Million) Forecast, by Application 2020 & 2033
- Table 50: India Unmanned Marine Vehicles Market Volume (K Unit) Forecast, by Application 2020 & 2033
- Table 51: Australia Unmanned Marine Vehicles Market Revenue (Million) Forecast, by Application 2020 & 2033
- Table 52: Australia Unmanned Marine Vehicles Market Volume (K Unit) Forecast, by Application 2020 & 2033
- Table 53: Rest of Asia Pacific Unmanned Marine Vehicles Market Revenue (Million) Forecast, by Application 2020 & 2033
- Table 54: Rest of Asia Pacific Unmanned Marine Vehicles Market Volume (K Unit) Forecast, by Application 2020 & 2033
- Table 55: Global Unmanned Marine Vehicles Market Revenue Million Forecast, by Type 2020 & 2033
- Table 56: Global Unmanned Marine Vehicles Market Volume K Unit Forecast, by Type 2020 & 2033
- Table 57: Global Unmanned Marine Vehicles Market Revenue Million Forecast, by Control Type 2020 & 2033
- Table 58: Global Unmanned Marine Vehicles Market Volume K Unit Forecast, by Control Type 2020 & 2033
- Table 59: Global Unmanned Marine Vehicles Market Revenue Million Forecast, by Application 2020 & 2033
- Table 60: Global Unmanned Marine Vehicles Market Volume K Unit Forecast, by Application 2020 & 2033
- Table 61: Global Unmanned Marine Vehicles Market Revenue Million Forecast, by Country 2020 & 2033
- Table 62: Global Unmanned Marine Vehicles Market Volume K Unit Forecast, by Country 2020 & 2033
- Table 63: Brazil Unmanned Marine Vehicles Market Revenue (Million) Forecast, by Application 2020 & 2033
- Table 64: Brazil Unmanned Marine Vehicles Market Volume (K Unit) Forecast, by Application 2020 & 2033
- Table 65: Rest of Latin America Unmanned Marine Vehicles Market Revenue (Million) Forecast, by Application 2020 & 2033
- Table 66: Rest of Latin America Unmanned Marine Vehicles Market Volume (K Unit) Forecast, by Application 2020 & 2033
- Table 67: Global Unmanned Marine Vehicles Market Revenue Million Forecast, by Type 2020 & 2033
- Table 68: Global Unmanned Marine Vehicles Market Volume K Unit Forecast, by Type 2020 & 2033
- Table 69: Global Unmanned Marine Vehicles Market Revenue Million Forecast, by Control Type 2020 & 2033
- Table 70: Global Unmanned Marine Vehicles Market Volume K Unit Forecast, by Control Type 2020 & 2033
- Table 71: Global Unmanned Marine Vehicles Market Revenue Million Forecast, by Application 2020 & 2033
- Table 72: Global Unmanned Marine Vehicles Market Volume K Unit Forecast, by Application 2020 & 2033
- Table 73: Global Unmanned Marine Vehicles Market Revenue Million Forecast, by Country 2020 & 2033
- Table 74: Global Unmanned Marine Vehicles Market Volume K Unit Forecast, by Country 2020 & 2033
- Table 75: South Africa Unmanned Marine Vehicles Market Revenue (Million) Forecast, by Application 2020 & 2033
- Table 76: South Africa Unmanned Marine Vehicles Market Volume (K Unit) Forecast, by Application 2020 & 2033
- Table 77: Rest of Middle East and Africa Unmanned Marine Vehicles Market Revenue (Million) Forecast, by Application 2020 & 2033
- Table 78: Rest of Middle East and Africa Unmanned Marine Vehicles Market Volume (K Unit) Forecast, by Application 2020 & 2033
Frequently Asked Questions
1. What is the projected Compound Annual Growth Rate (CAGR) of the Unmanned Marine Vehicles Market?
The projected CAGR is approximately 8.51%.
2. Which companies are prominent players in the Unmanned Marine Vehicles Market?
Key companies in the market include Textron Inc, Ocean Aero Inc, Liquid Robotics, BAE Systems, Sea Robotics Inc, ECA Group, Rafael Advanced Defense Systems, Atlas Elektronik, Thales Group, General Dynamics, Northrop Grumman, Pelorus Naval Systems, ASV Globa, Teledyne Technologies Inc.
3. What are the main segments of the Unmanned Marine Vehicles Market?
The market segments include Type, Control Type, Application.
4. Can you provide details about the market size?
The market size is estimated to be USD 4.93 Million as of 2022.
5. What are some drivers contributing to market growth?
Oceanic Surveillance for Defense Purposes; Increased Usage of Unmanned Marine Vehicles for Underwater Mapping for Marine Geoscience Studies.
6. What are the notable trends driving market growth?
The Defense Industry is Expected to Grow Significantly in the Market.
7. Are there any restraints impacting market growth?
High Cost for the Equipment and Maintenance Issues.
8. Can you provide examples of recent developments in the market?
August 2022 - Austal USA announced to partner with California-based Saildrone for building Saildrone Surveyor autonomous 'uncrewed' surface vehicle in Alabama. The partnership aims to provide a cutting-edge solution for maritime domain awareness, hydrographic survey, and other missions requiring persistent wide area coverage to the U.S. Navy and other government agency customers.
9. What pricing options are available for accessing the report?
Pricing options include single-user, multi-user, and enterprise licenses priced at USD 4750, USD 5250, and USD 8750 respectively.
10. Is the market size provided in terms of value or volume?
The market size is provided in terms of value, measured in Million and volume, measured in K Unit.
11. Are there any specific market keywords associated with the report?
Yes, the market keyword associated with the report is "Unmanned Marine Vehicles Market," which aids in identifying and referencing the specific market segment covered.
12. How do I determine which pricing option suits my needs best?
The pricing options vary based on user requirements and access needs. Individual users may opt for single-user licenses, while businesses requiring broader access may choose multi-user or enterprise licenses for cost-effective access to the report.
13. Are there any additional resources or data provided in the Unmanned Marine Vehicles Market report?
While the report offers comprehensive insights, it's advisable to review the specific contents or supplementary materials provided to ascertain if additional resources or data are available.
14. How can I stay updated on further developments or reports in the Unmanned Marine Vehicles Market?
To stay informed about further developments, trends, and reports in the Unmanned Marine Vehicles Market, consider subscribing to industry newsletters, following relevant companies and organizations, or regularly checking reputable industry news sources and publications.
Methodology
Step 1 - Identification of Relevant Samples Size from Population Database


Step 2 - Approaches for Defining Global Market Size (Value, Volume* & Price*)

Note*: In applicable scenarios
Step 3 - Data Sources
Primary Research
- Web Analytics
- Survey Reports
- Research Institute
- Latest Research Reports
- Opinion Leaders
Secondary Research
- Annual Reports
- White Paper
- Latest Press Release
- Industry Association
- Paid Database
- Investor Presentations

Step 4 - Data Triangulation
Involves using different sources of information in order to increase the validity of a study
These sources are likely to be stakeholders in a program - participants, other researchers, program staff, other community members, and so on.
Then we put all data in single framework & apply various statistical tools to find out the dynamic on the market.
During the analysis stage, feedback from the stakeholder groups would be compared to determine areas of agreement as well as areas of divergence