

Key Insights
The US energy storage market is poised for substantial expansion, projected to achieve a Compound Annual Growth Rate (CAGR) of 29.1% from 2024 to 2033. This growth is primarily attributed to the escalating integration of renewable energy sources, necessitating advanced storage solutions for grid stability and intermittency management. Supportive government incentives and policies promoting clean energy further accelerate market development. Heightened concerns regarding climate change and a drive for energy independence are also key demand drivers. The market is segmented by technology, with batteries leading, followed by other systems like pumped hydro. Three-phase systems dominate due to high-power applications, and the commercial & industrial sectors lead in end-user adoption due to substantial energy requirements. Leading companies such as BYD, LG Energy Solution, Tesla, and Siemens are fostering innovation and competitive pricing. Regional hotspots, particularly California and Texas, exhibit rapid growth due to high renewable energy penetration.
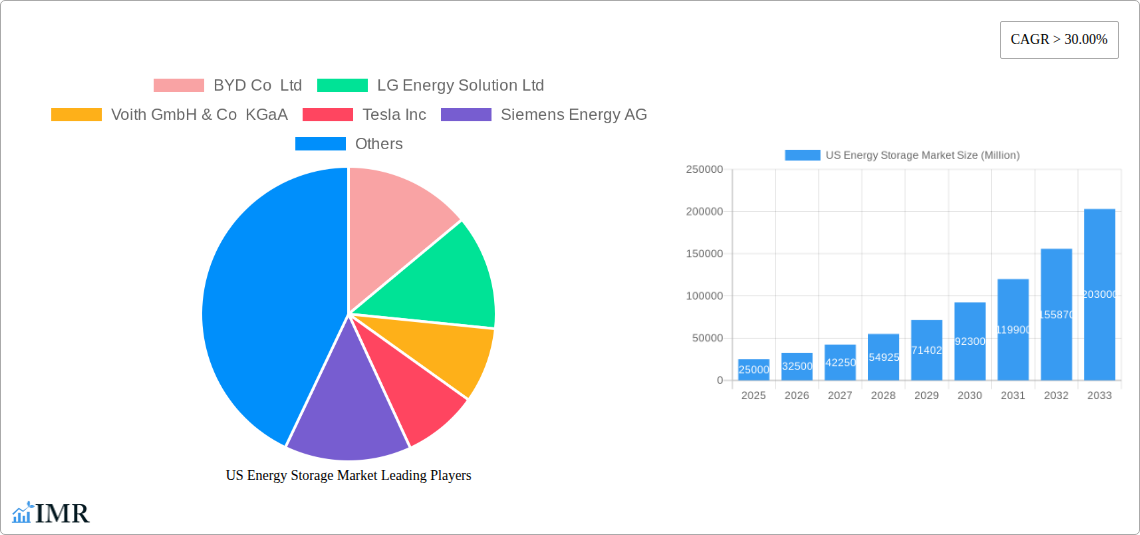
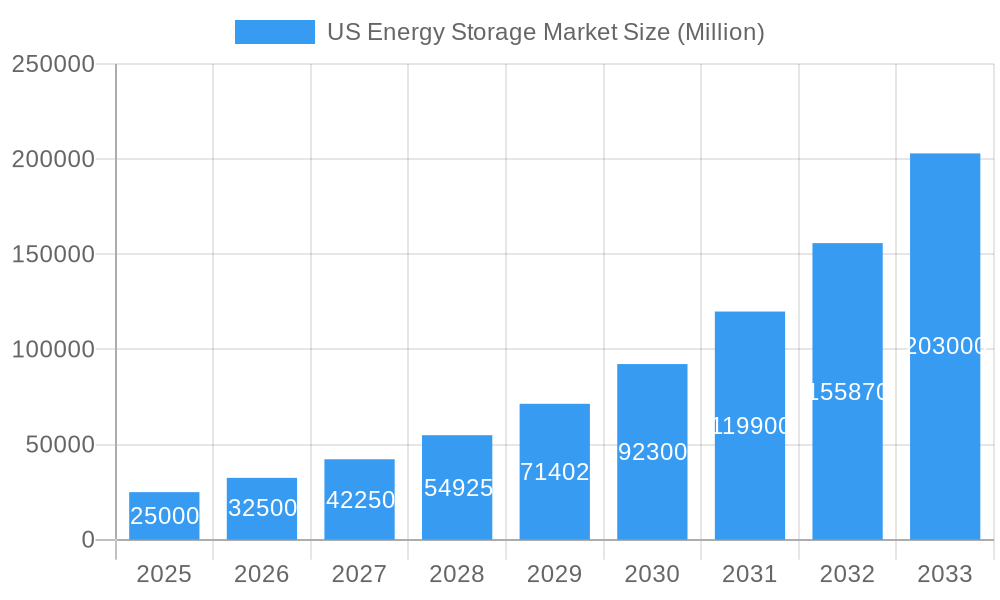
US Energy Storage Market Market Size (In Billion)
Continued market expansion throughout the forecast period is anticipated, driven by technological advancements, declining costs, and broadening applications. Despite challenges like grid infrastructure limitations and potential supply chain issues, the market outlook remains exceptionally positive. The residential sector is projected for significant growth, fueled by increasing affordability of home energy storage systems and heightened consumer awareness of backup power benefits and energy independence. This diverse market landscape ensures resilience and long-term sustainability, attracting further investment and innovation, and positioning the US energy storage market as a pivotal contributor to the global clean energy transition. The market size is estimated at $106.7 billion in the base year 2024.
US Energy Storage Market Company Market Share
US Energy Storage Market Report: 2019-2033
This comprehensive report provides an in-depth analysis of the US energy storage market, encompassing market dynamics, growth trends, key players, and future outlook. With a study period spanning 2019-2033, a base year of 2025, and a forecast period of 2025-2033, this report is an essential resource for industry professionals, investors, and stakeholders seeking to understand and capitalize on the opportunities within this rapidly expanding sector. The report segments the market by technology (Batteries, Other Energy Storage System Technologies), phase (Single Phase, Three Phase), and end-user (Residential, Commercial & Industrial), providing granular insights into market performance across diverse applications.
US Energy Storage Market Market Dynamics & Structure
The US energy storage market is characterized by increasing market concentration, with a few dominant players and a growing number of emerging companies. Technological innovation, driven by advancements in battery technology and other energy storage systems, is a key growth driver. Favorable regulatory frameworks and government incentives further stimulate market expansion. However, challenges remain, including high initial investment costs, limited grid infrastructure in certain regions, and the need for improved battery lifecycle management. The competitive landscape is dynamic, with mergers and acquisitions (M&A) activity steadily increasing.
- Market Concentration: The market is moderately concentrated, with the top 5 players holding approximately xx% of the market share in 2024. This is expected to slightly decrease to xx% by 2033 due to the entry of new players and increased competition.
- Technological Innovation: Advancements in battery chemistries (e.g., lithium-ion, solid-state), improved energy density, and reduced costs are key innovation drivers. The development of hybrid energy storage systems is also gaining momentum.
- Regulatory Framework: Federal and state-level policies, including tax incentives and renewable portfolio standards (RPS), significantly influence market growth. However, inconsistent regulations across different states pose a challenge.
- Competitive Landscape: The market is characterized by intense competition among established players and emerging companies, leading to increased product innovation and price pressure. The frequency of M&A activity is projected to increase by xx% between 2025 and 2033.
- End-User Demographics: The residential sector is experiencing steady growth, fueled by increasing adoption of rooftop solar and home energy storage systems. The commercial and industrial segments are also expanding rapidly, driven by the need for grid stability and cost savings.
US Energy Storage Market Growth Trends & Insights
The US energy storage market is experiencing robust growth, driven by increasing demand for renewable energy integration, grid modernization initiatives, and the rising adoption of electric vehicles (EVs). The market size, estimated at xx million units in 2025, is projected to reach xx million units by 2033, exhibiting a CAGR of xx% during the forecast period. This growth is fueled by factors such as declining battery costs, improved energy storage technologies, and supportive government policies. Adoption rates are accelerating, particularly in the residential and commercial & industrial sectors. Technological disruptions, such as advancements in battery technologies and smart grid integration, are further propelling market expansion. Consumer behavior is also shifting towards greater energy independence and sustainability, leading to increased demand for home energy storage systems.
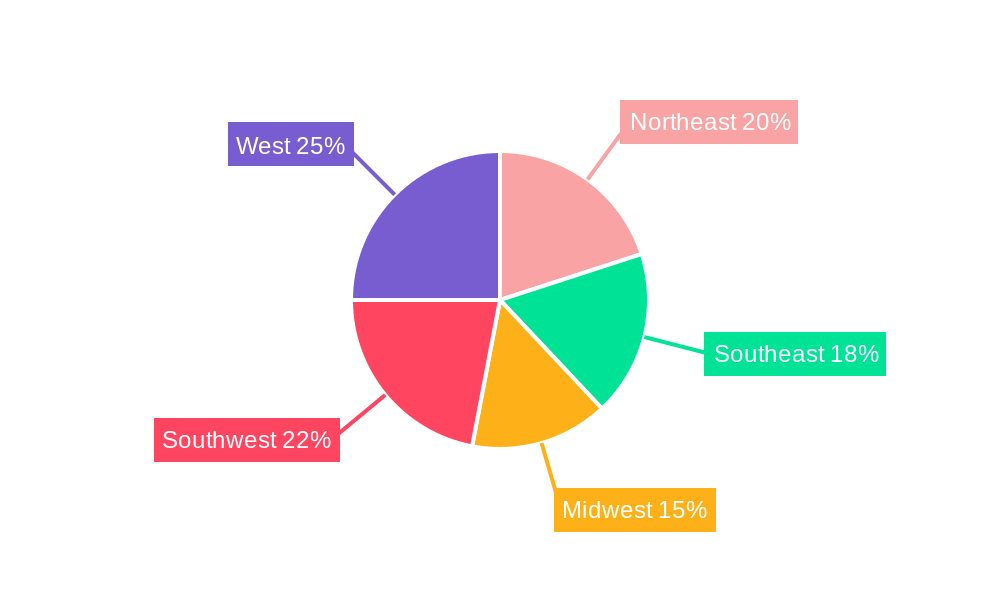
Dominant Regions, Countries, or Segments in US Energy Storage Market
California, Texas, and New York are currently the leading states in the US energy storage market. Within the technology segment, batteries dominate the market, accounting for approximately xx% of total market share in 2025, followed by other energy storage system technologies at xx%. The three-phase segment holds a larger market share compared to the single-phase segment, owing to its suitability for commercial and industrial applications. The commercial & industrial sector constitutes the largest end-user segment, driven by the rising need for backup power and grid stability.
- Key Drivers for California: Strong state-level policies supporting renewable energy and energy storage, coupled with a high concentration of solar installations and technological innovation hubs.
- Key Drivers for Texas: Growing energy demand, a robust industrial sector, and government incentives for renewable energy adoption.
- Key Drivers for New York: Government initiatives promoting clean energy, investment in grid modernization, and increasing adoption of renewable energy sources.
- Battery Technology Dominance: Cost-effectiveness, high energy density, and technological maturity contribute to the dominance of battery-based energy storage systems.
- Three-Phase Segment Leadership: Higher power requirements of commercial and industrial facilities drive the larger market share of three-phase energy storage systems.
- Commercial & Industrial Sector: Significant demand for uninterrupted power supply (UPS), grid stability, and cost savings drives growth in this segment.
US Energy Storage Market Product Landscape
The US energy storage market offers a diverse range of products, including lithium-ion batteries, flow batteries, and other emerging technologies. Recent innovations focus on improving energy density, lifespan, safety, and cost-effectiveness. Key features include advanced battery management systems (BMS), smart grid integration capabilities, and modular designs for flexibility. Unique selling propositions include improved performance, enhanced safety features, and reduced environmental impact. Technological advancements are driving the development of more efficient, sustainable, and cost-competitive energy storage solutions.
Key Drivers, Barriers & Challenges in US Energy Storage Market
Key Drivers:
- Declining battery costs: The continuous reduction in battery costs is making energy storage more economically viable.
- Growing adoption of renewable energy: The increasing use of solar and wind power necessitates efficient energy storage solutions.
- Government incentives and policies: Tax credits, rebates, and other financial incentives stimulate market growth.
Key Challenges:
- High initial investment costs: The upfront cost of installing energy storage systems remains a barrier for some consumers.
- Limited grid infrastructure: The lack of adequate grid infrastructure in certain regions hinders the widespread adoption of energy storage.
- Supply chain disruptions: Potential disruptions in the supply chain for critical raw materials pose a risk to market growth. These disruptions, estimated to cause a xx% decrease in production in 2024, are anticipated to improve by xx% by 2033.
Emerging Opportunities in US Energy Storage Market
- Microgrids: The growing adoption of microgrids, which combine renewable energy sources and energy storage, presents significant opportunities.
- Vehicle-to-grid (V2G) technology: V2G systems allow electric vehicles to feed electricity back into the grid, creating new revenue streams.
- Energy storage as a service (ESaaS): ESaaS models offer flexible and cost-effective access to energy storage for businesses and consumers.
Growth Accelerators in the US Energy Storage Market Industry
Technological breakthroughs in battery technology, including improvements in energy density, lifespan, and safety, are driving market growth. Strategic partnerships between energy storage companies and utilities are facilitating the integration of energy storage systems into the grid. Market expansion strategies, such as the development of innovative applications and the expansion into new geographical markets, further enhance long-term growth prospects.
Key Players Shaping the US Energy Storage Market Market
- BYD Co Ltd
- LG Energy Solution Ltd
- Voith GmbH & Co KGaA
- Tesla Inc
- Siemens Energy AG
- Sungrow Power Supply Co Ltd
- Fluence Energy
- Andritz AG
- Enphase Energy
- Sonnen GmbH
Notable Milestones in US Energy Storage Market Sector
- March 2021: Apple's initiative to install solar farms and rooftop solar panels across its operations and its 110 manufacturing partners globally significantly boosted renewable energy and energy storage adoption.
- November 2021: The Apparent project in Los Angeles, combining solar PV and a 4.5 MWh battery energy storage system to power electric buses, showcases the potential of microgrids for sustainable transportation.
In-Depth US Energy Storage Market Market Outlook
The US energy storage market is poised for continued strong growth, driven by increasing demand for clean energy, grid modernization initiatives, and technological advancements. Strategic partnerships, government support, and the expansion of innovative applications will further drive market expansion. The market presents significant opportunities for companies involved in battery technology, energy management systems, and grid infrastructure development. The long-term outlook is positive, with substantial potential for market growth and value creation.
US Energy Storage Market Segmentation
-
1. Technology
- 1.1. Batteries
- 1.2. Other Energy Storage System Technologies
-
2. Phase
- 2.1. Single Phase
- 2.2. Three Phase
-
3. End User
- 3.1. Residential
- 3.2. Commercial and Industrial
US Energy Storage Market Segmentation By Geography
-
1. North America
- 1.1. United States
- 1.2. Canada
- 1.3. Mexico
-
2. South America
- 2.1. Brazil
- 2.2. Argentina
- 2.3. Rest of South America
-
3. Europe
- 3.1. United Kingdom
- 3.2. Germany
- 3.3. France
- 3.4. Italy
- 3.5. Spain
- 3.6. Russia
- 3.7. Benelux
- 3.8. Nordics
- 3.9. Rest of Europe
-
4. Middle East & Africa
- 4.1. Turkey
- 4.2. Israel
- 4.3. GCC
- 4.4. North Africa
- 4.5. South Africa
- 4.6. Rest of Middle East & Africa
-
5. Asia Pacific
- 5.1. China
- 5.2. India
- 5.3. Japan
- 5.4. South Korea
- 5.5. ASEAN
- 5.6. Oceania
- 5.7. Rest of Asia Pacific
US Energy Storage Market Regional Market Share
Geographic Coverage of US Energy Storage Market
US Energy Storage Market REPORT HIGHLIGHTS
| Aspects | Details |
|---|---|
| Study Period | 2020-2034 |
| Base Year | 2025 |
| Estimated Year | 2026 |
| Forecast Period | 2026-2034 |
| Historical Period | 2020-2025 |
| Growth Rate | CAGR of 29.1% from 2020-2034 |
| Segmentation |
|
Table of Contents
- 1. Introduction
- 1.1. Research Scope
- 1.2. Market Segmentation
- 1.3. Research Objective
- 1.4. Definitions and Assumptions
- 2. Executive Summary
- 2.1. Market Snapshot
- 3. Market Dynamics
- 3.1. Market Drivers
- 3.2. Market Restrains
- 3.3. Market Trends
- 3.4. Market Opportunities
- 4. Market Factor Analysis
- 4.1. Porters Five Forces
- 4.1.1. Bargaining Power of Suppliers
- 4.1.2. Bargaining Power of Buyers
- 4.1.3. Threat of New Entrants
- 4.1.4. Threat of Substitutes
- 4.1.5. Competitive Rivalry
- 4.2. PESTEL analysis
- 4.3. BCG Analysis
- 4.3.1. Stars (High Growth, High Market Share)
- 4.3.2. Cash Cows (Low Growth, High Market Share)
- 4.3.3. Question Mark (High Growth, Low Market Share)
- 4.3.4. Dogs (Low Growth, Low Market Share)
- 4.4. Ansoff Matrix Analysis
- 4.5. Supply Chain Analysis
- 4.6. Regulatory Landscape
- 4.7. Current Market Potential and Opportunity Assessment (TAM–SAM–SOM Framework)
- 4.8. IMR Analyst Note
- 4.1. Porters Five Forces
- 5. Market Analysis, Insights and Forecast 2021-2033
- 5.1. Market Analysis, Insights and Forecast - by Technology
- 5.1.1. Batteries
- 5.1.2. Other Energy Storage System Technologies
- 5.2. Market Analysis, Insights and Forecast - by Phase
- 5.2.1. Single Phase
- 5.2.2. Three Phase
- 5.3. Market Analysis, Insights and Forecast - by End User
- 5.3.1. Residential
- 5.3.2. Commercial and Industrial
- 5.4. Market Analysis, Insights and Forecast - by Region
- 5.4.1. North America
- 5.4.2. South America
- 5.4.3. Europe
- 5.4.4. Middle East & Africa
- 5.4.5. Asia Pacific
- 5.1. Market Analysis, Insights and Forecast - by Technology
- 6. Global US Energy Storage Market Analysis, Insights and Forecast, 2021-2033
- 6.1. Market Analysis, Insights and Forecast - by Technology
- 6.1.1. Batteries
- 6.1.2. Other Energy Storage System Technologies
- 6.2. Market Analysis, Insights and Forecast - by Phase
- 6.2.1. Single Phase
- 6.2.2. Three Phase
- 6.3. Market Analysis, Insights and Forecast - by End User
- 6.3.1. Residential
- 6.3.2. Commercial and Industrial
- 6.1. Market Analysis, Insights and Forecast - by Technology
- 7. North America US Energy Storage Market Analysis, Insights and Forecast, 2020-2032
- 7.1. Market Analysis, Insights and Forecast - by Technology
- 7.1.1. Batteries
- 7.1.2. Other Energy Storage System Technologies
- 7.2. Market Analysis, Insights and Forecast - by Phase
- 7.2.1. Single Phase
- 7.2.2. Three Phase
- 7.3. Market Analysis, Insights and Forecast - by End User
- 7.3.1. Residential
- 7.3.2. Commercial and Industrial
- 7.1. Market Analysis, Insights and Forecast - by Technology
- 8. South America US Energy Storage Market Analysis, Insights and Forecast, 2020-2032
- 8.1. Market Analysis, Insights and Forecast - by Technology
- 8.1.1. Batteries
- 8.1.2. Other Energy Storage System Technologies
- 8.2. Market Analysis, Insights and Forecast - by Phase
- 8.2.1. Single Phase
- 8.2.2. Three Phase
- 8.3. Market Analysis, Insights and Forecast - by End User
- 8.3.1. Residential
- 8.3.2. Commercial and Industrial
- 8.1. Market Analysis, Insights and Forecast - by Technology
- 9. Europe US Energy Storage Market Analysis, Insights and Forecast, 2020-2032
- 9.1. Market Analysis, Insights and Forecast - by Technology
- 9.1.1. Batteries
- 9.1.2. Other Energy Storage System Technologies
- 9.2. Market Analysis, Insights and Forecast - by Phase
- 9.2.1. Single Phase
- 9.2.2. Three Phase
- 9.3. Market Analysis, Insights and Forecast - by End User
- 9.3.1. Residential
- 9.3.2. Commercial and Industrial
- 9.1. Market Analysis, Insights and Forecast - by Technology
- 10. Middle East & Africa US Energy Storage Market Analysis, Insights and Forecast, 2020-2032
- 10.1. Market Analysis, Insights and Forecast - by Technology
- 10.1.1. Batteries
- 10.1.2. Other Energy Storage System Technologies
- 10.2. Market Analysis, Insights and Forecast - by Phase
- 10.2.1. Single Phase
- 10.2.2. Three Phase
- 10.3. Market Analysis, Insights and Forecast - by End User
- 10.3.1. Residential
- 10.3.2. Commercial and Industrial
- 10.1. Market Analysis, Insights and Forecast - by Technology
- 11. Asia Pacific US Energy Storage Market Analysis, Insights and Forecast, 2020-2032
- 11.1. Market Analysis, Insights and Forecast - by Technology
- 11.1.1. Batteries
- 11.1.2. Other Energy Storage System Technologies
- 11.2. Market Analysis, Insights and Forecast - by Phase
- 11.2.1. Single Phase
- 11.2.2. Three Phase
- 11.3. Market Analysis, Insights and Forecast - by End User
- 11.3.1. Residential
- 11.3.2. Commercial and Industrial
- 11.1. Market Analysis, Insights and Forecast - by Technology
- 12. Competitive Analysis
- 12.1. Company Profiles
- 12.1.1 BYD Co Ltd
- 12.1.1.1. Company Overview
- 12.1.1.2. Products
- 12.1.1.3. Company Financials
- 12.1.1.4. SWOT Analysis
- 12.1.2 LG Energy Solution Ltd
- 12.1.2.1. Company Overview
- 12.1.2.2. Products
- 12.1.2.3. Company Financials
- 12.1.2.4. SWOT Analysis
- 12.1.3 Voith GmbH & Co KGaA
- 12.1.3.1. Company Overview
- 12.1.3.2. Products
- 12.1.3.3. Company Financials
- 12.1.3.4. SWOT Analysis
- 12.1.4 Tesla Inc
- 12.1.4.1. Company Overview
- 12.1.4.2. Products
- 12.1.4.3. Company Financials
- 12.1.4.4. SWOT Analysis
- 12.1.5 Siemens Energy AG
- 12.1.5.1. Company Overview
- 12.1.5.2. Products
- 12.1.5.3. Company Financials
- 12.1.5.4. SWOT Analysis
- 12.1.6 Sungrow Power Supply Co Ltd
- 12.1.6.1. Company Overview
- 12.1.6.2. Products
- 12.1.6.3. Company Financials
- 12.1.6.4. SWOT Analysis
- 12.1.7 Fluence Energy*List Not Exhaustive
- 12.1.7.1. Company Overview
- 12.1.7.2. Products
- 12.1.7.3. Company Financials
- 12.1.7.4. SWOT Analysis
- 12.1.8 Andritz AG
- 12.1.8.1. Company Overview
- 12.1.8.2. Products
- 12.1.8.3. Company Financials
- 12.1.8.4. SWOT Analysis
- 12.1.9 Enphase Energy
- 12.1.9.1. Company Overview
- 12.1.9.2. Products
- 12.1.9.3. Company Financials
- 12.1.9.4. SWOT Analysis
- 12.1.10 Sonnen GmbH
- 12.1.10.1. Company Overview
- 12.1.10.2. Products
- 12.1.10.3. Company Financials
- 12.1.10.4. SWOT Analysis
- 12.1.1 BYD Co Ltd
- 12.2. Market Entropy
- 12.2.1 Company's Key Areas Served
- 12.2.2 Recent Developments
- 12.3. Company Market Share Analysis 2025
- 12.3.1 Top 5 Companies Market Share Analysis
- 12.3.2 Top 3 Companies Market Share Analysis
- 12.4. List of Potential Customers
- 13. Research Methodology
List of Figures
- Figure 1: Global US Energy Storage Market Revenue Breakdown (billion, %) by Region 2025 & 2033
- Figure 2: North America US Energy Storage Market Revenue (billion), by Technology 2025 & 2033
- Figure 3: North America US Energy Storage Market Revenue Share (%), by Technology 2025 & 2033
- Figure 4: North America US Energy Storage Market Revenue (billion), by Phase 2025 & 2033
- Figure 5: North America US Energy Storage Market Revenue Share (%), by Phase 2025 & 2033
- Figure 6: North America US Energy Storage Market Revenue (billion), by End User 2025 & 2033
- Figure 7: North America US Energy Storage Market Revenue Share (%), by End User 2025 & 2033
- Figure 8: North America US Energy Storage Market Revenue (billion), by Country 2025 & 2033
- Figure 9: North America US Energy Storage Market Revenue Share (%), by Country 2025 & 2033
- Figure 10: South America US Energy Storage Market Revenue (billion), by Technology 2025 & 2033
- Figure 11: South America US Energy Storage Market Revenue Share (%), by Technology 2025 & 2033
- Figure 12: South America US Energy Storage Market Revenue (billion), by Phase 2025 & 2033
- Figure 13: South America US Energy Storage Market Revenue Share (%), by Phase 2025 & 2033
- Figure 14: South America US Energy Storage Market Revenue (billion), by End User 2025 & 2033
- Figure 15: South America US Energy Storage Market Revenue Share (%), by End User 2025 & 2033
- Figure 16: South America US Energy Storage Market Revenue (billion), by Country 2025 & 2033
- Figure 17: South America US Energy Storage Market Revenue Share (%), by Country 2025 & 2033
- Figure 18: Europe US Energy Storage Market Revenue (billion), by Technology 2025 & 2033
- Figure 19: Europe US Energy Storage Market Revenue Share (%), by Technology 2025 & 2033
- Figure 20: Europe US Energy Storage Market Revenue (billion), by Phase 2025 & 2033
- Figure 21: Europe US Energy Storage Market Revenue Share (%), by Phase 2025 & 2033
- Figure 22: Europe US Energy Storage Market Revenue (billion), by End User 2025 & 2033
- Figure 23: Europe US Energy Storage Market Revenue Share (%), by End User 2025 & 2033
- Figure 24: Europe US Energy Storage Market Revenue (billion), by Country 2025 & 2033
- Figure 25: Europe US Energy Storage Market Revenue Share (%), by Country 2025 & 2033
- Figure 26: Middle East & Africa US Energy Storage Market Revenue (billion), by Technology 2025 & 2033
- Figure 27: Middle East & Africa US Energy Storage Market Revenue Share (%), by Technology 2025 & 2033
- Figure 28: Middle East & Africa US Energy Storage Market Revenue (billion), by Phase 2025 & 2033
- Figure 29: Middle East & Africa US Energy Storage Market Revenue Share (%), by Phase 2025 & 2033
- Figure 30: Middle East & Africa US Energy Storage Market Revenue (billion), by End User 2025 & 2033
- Figure 31: Middle East & Africa US Energy Storage Market Revenue Share (%), by End User 2025 & 2033
- Figure 32: Middle East & Africa US Energy Storage Market Revenue (billion), by Country 2025 & 2033
- Figure 33: Middle East & Africa US Energy Storage Market Revenue Share (%), by Country 2025 & 2033
- Figure 34: Asia Pacific US Energy Storage Market Revenue (billion), by Technology 2025 & 2033
- Figure 35: Asia Pacific US Energy Storage Market Revenue Share (%), by Technology 2025 & 2033
- Figure 36: Asia Pacific US Energy Storage Market Revenue (billion), by Phase 2025 & 2033
- Figure 37: Asia Pacific US Energy Storage Market Revenue Share (%), by Phase 2025 & 2033
- Figure 38: Asia Pacific US Energy Storage Market Revenue (billion), by End User 2025 & 2033
- Figure 39: Asia Pacific US Energy Storage Market Revenue Share (%), by End User 2025 & 2033
- Figure 40: Asia Pacific US Energy Storage Market Revenue (billion), by Country 2025 & 2033
- Figure 41: Asia Pacific US Energy Storage Market Revenue Share (%), by Country 2025 & 2033
List of Tables
- Table 1: Global US Energy Storage Market Revenue billion Forecast, by Technology 2020 & 2033
- Table 2: Global US Energy Storage Market Revenue billion Forecast, by Phase 2020 & 2033
- Table 3: Global US Energy Storage Market Revenue billion Forecast, by End User 2020 & 2033
- Table 4: Global US Energy Storage Market Revenue billion Forecast, by Region 2020 & 2033
- Table 5: Global US Energy Storage Market Revenue billion Forecast, by Technology 2020 & 2033
- Table 6: Global US Energy Storage Market Revenue billion Forecast, by Phase 2020 & 2033
- Table 7: Global US Energy Storage Market Revenue billion Forecast, by End User 2020 & 2033
- Table 8: Global US Energy Storage Market Revenue billion Forecast, by Country 2020 & 2033
- Table 9: United States US Energy Storage Market Revenue (billion) Forecast, by Application 2020 & 2033
- Table 10: Canada US Energy Storage Market Revenue (billion) Forecast, by Application 2020 & 2033
- Table 11: Mexico US Energy Storage Market Revenue (billion) Forecast, by Application 2020 & 2033
- Table 12: Global US Energy Storage Market Revenue billion Forecast, by Technology 2020 & 2033
- Table 13: Global US Energy Storage Market Revenue billion Forecast, by Phase 2020 & 2033
- Table 14: Global US Energy Storage Market Revenue billion Forecast, by End User 2020 & 2033
- Table 15: Global US Energy Storage Market Revenue billion Forecast, by Country 2020 & 2033
- Table 16: Brazil US Energy Storage Market Revenue (billion) Forecast, by Application 2020 & 2033
- Table 17: Argentina US Energy Storage Market Revenue (billion) Forecast, by Application 2020 & 2033
- Table 18: Rest of South America US Energy Storage Market Revenue (billion) Forecast, by Application 2020 & 2033
- Table 19: Global US Energy Storage Market Revenue billion Forecast, by Technology 2020 & 2033
- Table 20: Global US Energy Storage Market Revenue billion Forecast, by Phase 2020 & 2033
- Table 21: Global US Energy Storage Market Revenue billion Forecast, by End User 2020 & 2033
- Table 22: Global US Energy Storage Market Revenue billion Forecast, by Country 2020 & 2033
- Table 23: United Kingdom US Energy Storage Market Revenue (billion) Forecast, by Application 2020 & 2033
- Table 24: Germany US Energy Storage Market Revenue (billion) Forecast, by Application 2020 & 2033
- Table 25: France US Energy Storage Market Revenue (billion) Forecast, by Application 2020 & 2033
- Table 26: Italy US Energy Storage Market Revenue (billion) Forecast, by Application 2020 & 2033
- Table 27: Spain US Energy Storage Market Revenue (billion) Forecast, by Application 2020 & 2033
- Table 28: Russia US Energy Storage Market Revenue (billion) Forecast, by Application 2020 & 2033
- Table 29: Benelux US Energy Storage Market Revenue (billion) Forecast, by Application 2020 & 2033
- Table 30: Nordics US Energy Storage Market Revenue (billion) Forecast, by Application 2020 & 2033
- Table 31: Rest of Europe US Energy Storage Market Revenue (billion) Forecast, by Application 2020 & 2033
- Table 32: Global US Energy Storage Market Revenue billion Forecast, by Technology 2020 & 2033
- Table 33: Global US Energy Storage Market Revenue billion Forecast, by Phase 2020 & 2033
- Table 34: Global US Energy Storage Market Revenue billion Forecast, by End User 2020 & 2033
- Table 35: Global US Energy Storage Market Revenue billion Forecast, by Country 2020 & 2033
- Table 36: Turkey US Energy Storage Market Revenue (billion) Forecast, by Application 2020 & 2033
- Table 37: Israel US Energy Storage Market Revenue (billion) Forecast, by Application 2020 & 2033
- Table 38: GCC US Energy Storage Market Revenue (billion) Forecast, by Application 2020 & 2033
- Table 39: North Africa US Energy Storage Market Revenue (billion) Forecast, by Application 2020 & 2033
- Table 40: South Africa US Energy Storage Market Revenue (billion) Forecast, by Application 2020 & 2033
- Table 41: Rest of Middle East & Africa US Energy Storage Market Revenue (billion) Forecast, by Application 2020 & 2033
- Table 42: Global US Energy Storage Market Revenue billion Forecast, by Technology 2020 & 2033
- Table 43: Global US Energy Storage Market Revenue billion Forecast, by Phase 2020 & 2033
- Table 44: Global US Energy Storage Market Revenue billion Forecast, by End User 2020 & 2033
- Table 45: Global US Energy Storage Market Revenue billion Forecast, by Country 2020 & 2033
- Table 46: China US Energy Storage Market Revenue (billion) Forecast, by Application 2020 & 2033
- Table 47: India US Energy Storage Market Revenue (billion) Forecast, by Application 2020 & 2033
- Table 48: Japan US Energy Storage Market Revenue (billion) Forecast, by Application 2020 & 2033
- Table 49: South Korea US Energy Storage Market Revenue (billion) Forecast, by Application 2020 & 2033
- Table 50: ASEAN US Energy Storage Market Revenue (billion) Forecast, by Application 2020 & 2033
- Table 51: Oceania US Energy Storage Market Revenue (billion) Forecast, by Application 2020 & 2033
- Table 52: Rest of Asia Pacific US Energy Storage Market Revenue (billion) Forecast, by Application 2020 & 2033
Frequently Asked Questions
1. What is the projected Compound Annual Growth Rate (CAGR) of the US Energy Storage Market?
The projected CAGR is approximately 29.1%.
2. Which companies are prominent players in the US Energy Storage Market?
Key companies in the market include BYD Co Ltd, LG Energy Solution Ltd, Voith GmbH & Co KGaA, Tesla Inc, Siemens Energy AG, Sungrow Power Supply Co Ltd, Fluence Energy*List Not Exhaustive, Andritz AG, Enphase Energy, Sonnen GmbH.
3. What are the main segments of the US Energy Storage Market?
The market segments include Technology, Phase, End User.
4. Can you provide details about the market size?
The market size is estimated to be USD 106.7 billion as of 2022.
5. What are some drivers contributing to market growth?
4.; The High Amount of Waste Generation in the Country4.; The growing Focus on Non-Fossil Fuel Sources.
6. What are the notable trends driving market growth?
Residential Segment Expected to Dominate the Market.
7. Are there any restraints impacting market growth?
4.; The Recycling Rate of Waste in Germany.
8. Can you provide examples of recent developments in the market?
In March 2021, Apple inspired the entire corporate world by setting up a solar farm to power its headquarters in California, the United States, and installing rooftop solar panels for its manufacturing park in the city. The company announced that the initiative has been taken by not only one arm, but its 110 manufacturing partners around the globe, which are switching to renewable options to power their infrastructure. It has also implemented a new energy storage project in California to pilot new solutions for renewable infrastructure.
9. What pricing options are available for accessing the report?
Pricing options include single-user, multi-user, and enterprise licenses priced at USD 3800, USD 4500, and USD 5800 respectively.
10. Is the market size provided in terms of value or volume?
The market size is provided in terms of value, measured in billion.
11. Are there any specific market keywords associated with the report?
Yes, the market keyword associated with the report is "US Energy Storage Market," which aids in identifying and referencing the specific market segment covered.
12. How do I determine which pricing option suits my needs best?
The pricing options vary based on user requirements and access needs. Individual users may opt for single-user licenses, while businesses requiring broader access may choose multi-user or enterprise licenses for cost-effective access to the report.
13. Are there any additional resources or data provided in the US Energy Storage Market report?
While the report offers comprehensive insights, it's advisable to review the specific contents or supplementary materials provided to ascertain if additional resources or data are available.
14. How can I stay updated on further developments or reports in the US Energy Storage Market?
To stay informed about further developments, trends, and reports in the US Energy Storage Market, consider subscribing to industry newsletters, following relevant companies and organizations, or regularly checking reputable industry news sources and publications.
Methodology
Step 1 - Identification of Relevant Samples Size from Population Database


Step 2 - Approaches for Defining Global Market Size (Value, Volume* & Price*)

Note*: In applicable scenarios
Step 3 - Data Sources
Primary Research
- Web Analytics
- Survey Reports
- Research Institute
- Latest Research Reports
- Opinion Leaders
Secondary Research
- Annual Reports
- White Paper
- Latest Press Release
- Industry Association
- Paid Database
- Investor Presentations

Step 4 - Data Triangulation
Involves using different sources of information in order to increase the validity of a study
These sources are likely to be stakeholders in a program - participants, other researchers, program staff, other community members, and so on.
Then we put all data in single framework & apply various statistical tools to find out the dynamic on the market.
During the analysis stage, feedback from the stakeholder groups would be compared to determine areas of agreement as well as areas of divergence