

Key Insights
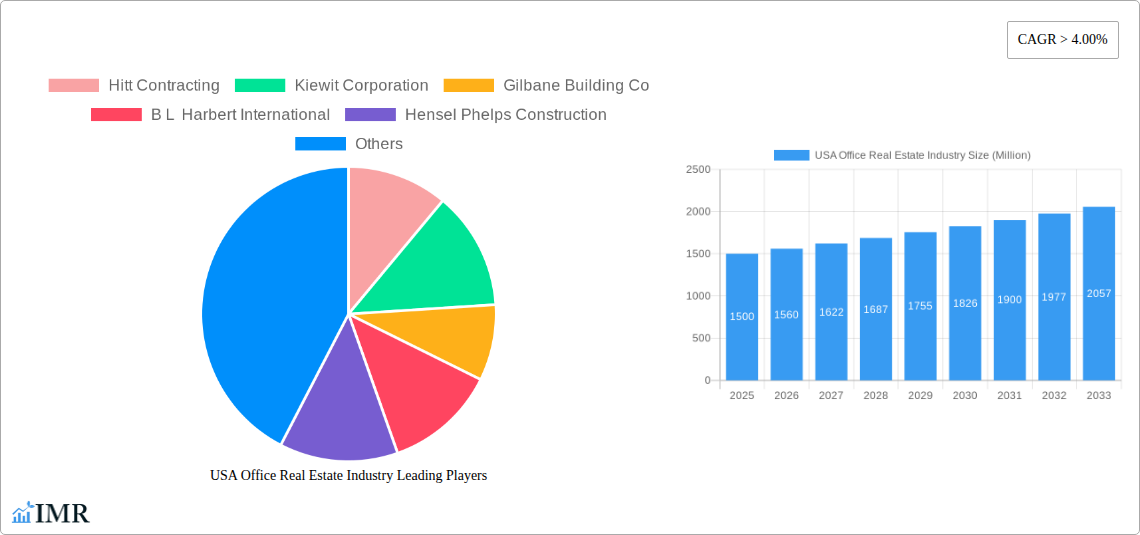
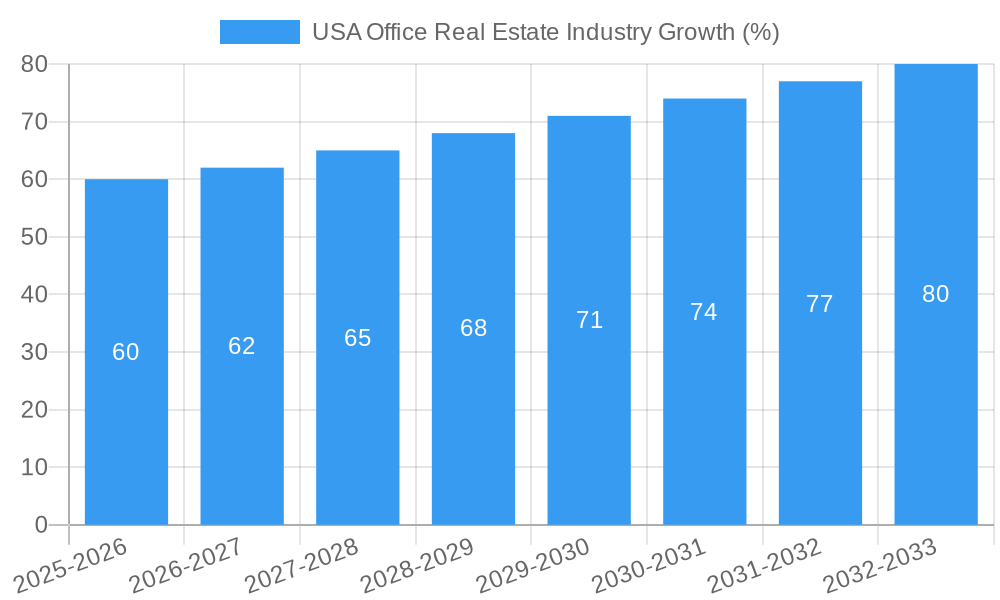
The US office real estate market, currently experiencing robust growth, is projected to maintain a Compound Annual Growth Rate (CAGR) exceeding 4% from 2025 to 2033. This expansion is driven by several key factors. Firstly, the ongoing strength of the Information Technology (IT and ITES), Banking, Financial Services, and Insurance (BFSI), and Consulting sectors fuels demand for modern, efficient office spaces. Secondly, urbanization and population growth in key regions like the Northeast and West continue to increase the need for office accommodations. Lastly, a gradual shift towards hybrid work models, while impacting overall demand, is simultaneously spurring investment in high-quality, amenity-rich office buildings designed to attract and retain talent. While construction costs and potential economic downturns pose challenges, the market's resilience is supported by a diverse tenant base and ongoing investments in infrastructure improvements. Leading construction companies like Hitt Contracting, Kiewit Corporation, and others play a significant role in shaping the market's supply.
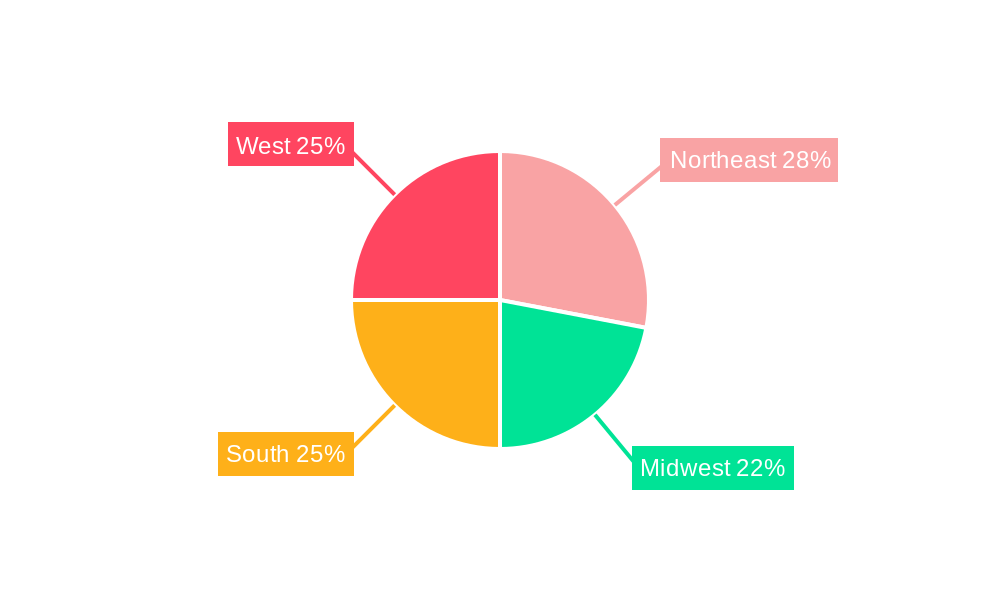
The regional distribution of the market reveals considerable variance. The Northeast and West, known for their established financial and technological hubs, likely command larger market shares than the Midwest and South. However, growth within the Southern and Midwestern regions is expected, driven by expanding industrial sectors and the relocation of companies seeking lower operating costs. Segmentation by sector highlights the dominance of IT, BFSI, and Consulting, which collectively contribute a substantial portion of office space demand. The "Other Services" segment, representing a broad range of industries, also contributes significantly to market dynamism. Future growth will depend on managing factors like interest rates, economic stability, and the evolving nature of remote work arrangements. The forecast indicates consistent market expansion, albeit with potential fluctuations reflective of broader economic trends.
This in-depth report provides a comprehensive analysis of the USA office real estate industry, covering market dynamics, growth trends, key players, and future outlook. The study period spans from 2019 to 2033, with a base year of 2025 and a forecast period from 2025 to 2033. This report is invaluable for industry professionals, investors, and anyone seeking to understand this dynamic sector. Parent markets include the broader commercial real estate sector, while child markets include specific office sub-sectors like Class A, B, and C office spaces. The report’s quantitative analysis is presented in millions of units.
USA Office Real Estate Industry Market Dynamics & Structure
The USA office real estate market is characterized by a moderately concentrated landscape, with a few large players holding significant market share. However, numerous smaller firms and regional players also contribute significantly. Technological innovations, such as smart building technologies and improved property management software, are driving efficiency gains and influencing demand. Regulatory frameworks at both the federal and state levels impact zoning, building codes, and environmental regulations, shaping development patterns. While there are some substitute options for office space (like co-working spaces and remote work), the traditional office remains a crucial hub for many businesses. End-user demographics are shifting, with a growing focus on flexible workspace solutions and sustainability concerns influencing leasing decisions. M&A activity in the sector has been robust in recent years, with xx million deals closed in 2024, indicating a trend toward consolidation.
- Market Concentration: Top 5 players hold approximately xx% market share in 2025.
- Technological Drivers: Smart building technologies, proptech solutions, and data analytics are key innovation drivers.
- Regulatory Framework: Zoning regulations, environmental compliance, and building codes significantly influence development costs and timelines.
- M&A Activity: xx million deals closed in 2024, with a projected xx million deals for 2025.
- Innovation Barriers: High initial investment costs and resistance to change among some businesses are significant hurdles.
USA Office Real Estate Industry Growth Trends & Insights
The USA office real estate market experienced a period of moderate growth from 2019 to 2024, driven primarily by the expansion of IT and BFSI sectors. The impact of the COVID-19 pandemic caused a temporary slowdown, however, the market is showing signs of recovery. The adoption rate of flexible workspace solutions has risen significantly, impacting demand patterns. Technological disruptions, such as the widespread adoption of remote work capabilities, have presented both challenges and opportunities. Consumer behavior has shifted toward a preference for modern, sustainable, and amenity-rich office spaces. The market size is projected to reach xx million square feet by 2033, reflecting a Compound Annual Growth Rate (CAGR) of xx% during the forecast period. Market penetration of green building certifications is also expected to increase significantly.
Dominant Regions, Countries, or Segments in USA Office Real Estate Industry
The Northeast and West regions currently dominate the USA office real estate market, driven by strong economic activity and a concentration of major corporations in key cities like New York, San Francisco, and Boston. The IT and BFSI sectors are the most significant drivers of demand, accounting for approximately xx% and xx% of total office space leased, respectively.
- Northeast: High concentration of financial institutions and tech companies; robust economic activity; limited land availability driving up prices.
- West: Strong presence of technology companies; favorable business climate; high demand for innovative workspace solutions.
- IT & ITES Sector: High growth rates, demand for modern office spaces, and a concentration in major tech hubs.
- BFSI Sector: Stable demand, preference for prime locations, and significant leasing activity in major financial centers.
USA Office Real Estate Industry Product Landscape
The office real estate product landscape encompasses a diverse range of offerings, from traditional Class A high-rise buildings to flexible co-working spaces and suburban office parks. Innovations include smart building technologies, sustainable design features, and enhanced amenities designed to attract and retain tenants. Key performance metrics include occupancy rates, rental yields, and capital appreciation. Unique selling propositions often focus on location, amenities, sustainability, and technological integration. Technological advancements continue to shape the design and functionality of office spaces, emphasizing flexibility, collaboration, and efficiency.
Key Drivers, Barriers & Challenges in USA Office Real Estate Industry
Key Drivers: Strong economic growth in key sectors, increasing urbanization, and the growing demand for flexible workspaces are driving market growth. Technological advancements in building design and management systems are also propelling the sector forward. Government initiatives promoting sustainable construction practices are also playing a role.
Challenges: High construction costs, labor shortages, increasing interest rates, and supply chain disruptions are presenting significant challenges. Stringent environmental regulations, competition from alternative workspace solutions, and the lingering effects of the pandemic continue to impact the sector. The overall impact of these challenges on market growth is estimated to be a xx% reduction in projected growth by 2033.
Emerging Opportunities in USA Office Real Estate Industry
Emerging opportunities lie in the adoption of sustainable building practices, the growth of co-working spaces, and the increasing demand for amenity-rich office environments. Untapped markets exist in secondary cities and suburban areas, while the integration of technology and data analytics offers significant potential for enhancing efficiency and value. Evolving consumer preferences toward flexible work arrangements present opportunities for developers to create adaptable and customizable office spaces.
Growth Accelerators in the USA Office Real Estate Industry Industry
Long-term growth is expected to be driven by technological breakthroughs in building automation and sustainability, strategic partnerships between developers and technology companies, and expansion into new markets. Government incentives promoting sustainable development and infrastructure improvements will also play a critical role. The continued growth of the IT and BFSI sectors is expected to significantly impact demand for office space.
Key Players Shaping the USA Office Real Estate Industry Market
- Hitt Contracting
- Kiewit Corporation
- Gilbane Building Co
- B L Harbert International
- Hensel Phelps Construction
- Ryan Companies US Inc
- Skanska USA Inc
- Turner Construction Company Inc
- Trammell Crow Company
- Clayco Inc
- Dpr Construction
- PCL Construction Enterprises
- Structure Tone LLC
- (List Not Exhaustive)
Notable Milestones in USA Office Real Estate Industry Sector
- 2020 (March): The COVID-19 pandemic significantly impacts office occupancy rates and leasing activity.
- 2021 (Q3): Increased focus on workplace safety and hygiene measures leads to renovations and adoption of flexible work solutions.
- 2022 (Q4): Increased interest in sustainable and energy-efficient office spaces.
- 2023 (Ongoing): Continued growth in the adoption of smart building technologies and PropTech solutions.
In-Depth USA Office Real Estate Industry Market Outlook
The future of the USA office real estate market is promising, driven by technological innovations, sustainable development practices, and the continued growth of key economic sectors. Strategic opportunities exist in developing flexible workspaces, investing in smart building technologies, and focusing on sustainable design and construction. The long-term outlook is positive, with consistent growth expected throughout the forecast period, though at a pace moderated by macroeconomic factors and the evolving preferences of office tenants.
USA Office Real Estate Industry Segmentation
-
1. Sector
- 1.1. Information Technology (IT and ITES)
- 1.2. Manufacturing
- 1.3. BFSI (Banking, Financial Services, and Insurance)
- 1.4. Consulting
- 1.5. Other Services
USA Office Real Estate Industry Segmentation By Geography
-
1. North America
- 1.1. United States
- 1.2. Canada
- 1.3. Mexico
-
2. South America
- 2.1. Brazil
- 2.2. Argentina
- 2.3. Rest of South America
-
3. Europe
- 3.1. United Kingdom
- 3.2. Germany
- 3.3. France
- 3.4. Italy
- 3.5. Spain
- 3.6. Russia
- 3.7. Benelux
- 3.8. Nordics
- 3.9. Rest of Europe
-
4. Middle East & Africa
- 4.1. Turkey
- 4.2. Israel
- 4.3. GCC
- 4.4. North Africa
- 4.5. South Africa
- 4.6. Rest of Middle East & Africa
-
5. Asia Pacific
- 5.1. China
- 5.2. India
- 5.3. Japan
- 5.4. South Korea
- 5.5. ASEAN
- 5.6. Oceania
- 5.7. Rest of Asia Pacific
USA Office Real Estate Industry REPORT HIGHLIGHTS
| Aspects | Details |
|---|---|
| Study Period | 2019-2033 |
| Base Year | 2024 |
| Estimated Year | 2025 |
| Forecast Period | 2025-2033 |
| Historical Period | 2019-2024 |
| Growth Rate | CAGR of > 4.00% from 2019-2033 |
| Segmentation |
|
Table of Contents
- 1. Introduction
- 1.1. Research Scope
- 1.2. Market Segmentation
- 1.3. Research Methodology
- 1.4. Definitions and Assumptions
- 2. Executive Summary
- 2.1. Introduction
- 3. Market Dynamics
- 3.1. Introduction
- 3.2. Market Drivers
- 3.2.1. Increasing Disposable Income and Middle-Class Expansion; Increased Awareness of Roofing Solutions
- 3.3. Market Restrains
- 3.3.1. The presence of counterfeit or substandard roofing materials in the market poses a significant challenge; The roofing industry faces a shortage of skilled labor
- 3.4. Market Trends
- 3.4.1. Increase in Leasing Volumes
- 4. Market Factor Analysis
- 4.1. Porters Five Forces
- 4.2. Supply/Value Chain
- 4.3. PESTEL analysis
- 4.4. Market Entropy
- 4.5. Patent/Trademark Analysis
- 5. Global USA Office Real Estate Industry Analysis, Insights and Forecast, 2019-2031
- 5.1. Market Analysis, Insights and Forecast - by Sector
- 5.1.1. Information Technology (IT and ITES)
- 5.1.2. Manufacturing
- 5.1.3. BFSI (Banking, Financial Services, and Insurance)
- 5.1.4. Consulting
- 5.1.5. Other Services
- 5.2. Market Analysis, Insights and Forecast - by Region
- 5.2.1. North America
- 5.2.2. South America
- 5.2.3. Europe
- 5.2.4. Middle East & Africa
- 5.2.5. Asia Pacific
- 5.1. Market Analysis, Insights and Forecast - by Sector
- 6. North America USA Office Real Estate Industry Analysis, Insights and Forecast, 2019-2031
- 6.1. Market Analysis, Insights and Forecast - by Sector
- 6.1.1. Information Technology (IT and ITES)
- 6.1.2. Manufacturing
- 6.1.3. BFSI (Banking, Financial Services, and Insurance)
- 6.1.4. Consulting
- 6.1.5. Other Services
- 6.1. Market Analysis, Insights and Forecast - by Sector
- 7. South America USA Office Real Estate Industry Analysis, Insights and Forecast, 2019-2031
- 7.1. Market Analysis, Insights and Forecast - by Sector
- 7.1.1. Information Technology (IT and ITES)
- 7.1.2. Manufacturing
- 7.1.3. BFSI (Banking, Financial Services, and Insurance)
- 7.1.4. Consulting
- 7.1.5. Other Services
- 7.1. Market Analysis, Insights and Forecast - by Sector
- 8. Europe USA Office Real Estate Industry Analysis, Insights and Forecast, 2019-2031
- 8.1. Market Analysis, Insights and Forecast - by Sector
- 8.1.1. Information Technology (IT and ITES)
- 8.1.2. Manufacturing
- 8.1.3. BFSI (Banking, Financial Services, and Insurance)
- 8.1.4. Consulting
- 8.1.5. Other Services
- 8.1. Market Analysis, Insights and Forecast - by Sector
- 9. Middle East & Africa USA Office Real Estate Industry Analysis, Insights and Forecast, 2019-2031
- 9.1. Market Analysis, Insights and Forecast - by Sector
- 9.1.1. Information Technology (IT and ITES)
- 9.1.2. Manufacturing
- 9.1.3. BFSI (Banking, Financial Services, and Insurance)
- 9.1.4. Consulting
- 9.1.5. Other Services
- 9.1. Market Analysis, Insights and Forecast - by Sector
- 10. Asia Pacific USA Office Real Estate Industry Analysis, Insights and Forecast, 2019-2031
- 10.1. Market Analysis, Insights and Forecast - by Sector
- 10.1.1. Information Technology (IT and ITES)
- 10.1.2. Manufacturing
- 10.1.3. BFSI (Banking, Financial Services, and Insurance)
- 10.1.4. Consulting
- 10.1.5. Other Services
- 10.1. Market Analysis, Insights and Forecast - by Sector
- 11. Northeast USA Office Real Estate Industry Analysis, Insights and Forecast, 2019-2031
- 12. Southeast USA Office Real Estate Industry Analysis, Insights and Forecast, 2019-2031
- 13. Midwest USA Office Real Estate Industry Analysis, Insights and Forecast, 2019-2031
- 14. Southwest USA Office Real Estate Industry Analysis, Insights and Forecast, 2019-2031
- 15. West USA Office Real Estate Industry Analysis, Insights and Forecast, 2019-2031
- 16. Competitive Analysis
- 16.1. Global Market Share Analysis 2024
- 16.2. Company Profiles
- 16.2.1 Hitt Contracting
- 16.2.1.1. Overview
- 16.2.1.2. Products
- 16.2.1.3. SWOT Analysis
- 16.2.1.4. Recent Developments
- 16.2.1.5. Financials (Based on Availability)
- 16.2.2 Kiewit Corporation
- 16.2.2.1. Overview
- 16.2.2.2. Products
- 16.2.2.3. SWOT Analysis
- 16.2.2.4. Recent Developments
- 16.2.2.5. Financials (Based on Availability)
- 16.2.3 Gilbane Building Co
- 16.2.3.1. Overview
- 16.2.3.2. Products
- 16.2.3.3. SWOT Analysis
- 16.2.3.4. Recent Developments
- 16.2.3.5. Financials (Based on Availability)
- 16.2.4 B L Harbert International
- 16.2.4.1. Overview
- 16.2.4.2. Products
- 16.2.4.3. SWOT Analysis
- 16.2.4.4. Recent Developments
- 16.2.4.5. Financials (Based on Availability)
- 16.2.5 Hensel Phelps Construction
- 16.2.5.1. Overview
- 16.2.5.2. Products
- 16.2.5.3. SWOT Analysis
- 16.2.5.4. Recent Developments
- 16.2.5.5. Financials (Based on Availability)
- 16.2.6 Ryan Companies US Inc
- 16.2.6.1. Overview
- 16.2.6.2. Products
- 16.2.6.3. SWOT Analysis
- 16.2.6.4. Recent Developments
- 16.2.6.5. Financials (Based on Availability)
- 16.2.7 Skanska USA Inc
- 16.2.7.1. Overview
- 16.2.7.2. Products
- 16.2.7.3. SWOT Analysis
- 16.2.7.4. Recent Developments
- 16.2.7.5. Financials (Based on Availability)
- 16.2.8 Turner Construction Company Inc
- 16.2.8.1. Overview
- 16.2.8.2. Products
- 16.2.8.3. SWOT Analysis
- 16.2.8.4. Recent Developments
- 16.2.8.5. Financials (Based on Availability)
- 16.2.9 Trammell Crow Company
- 16.2.9.1. Overview
- 16.2.9.2. Products
- 16.2.9.3. SWOT Analysis
- 16.2.9.4. Recent Developments
- 16.2.9.5. Financials (Based on Availability)
- 16.2.10 Clayco Inc
- 16.2.10.1. Overview
- 16.2.10.2. Products
- 16.2.10.3. SWOT Analysis
- 16.2.10.4. Recent Developments
- 16.2.10.5. Financials (Based on Availability)
- 16.2.11 Dpr Construction
- 16.2.11.1. Overview
- 16.2.11.2. Products
- 16.2.11.3. SWOT Analysis
- 16.2.11.4. Recent Developments
- 16.2.11.5. Financials (Based on Availability)
- 16.2.12 PCL Construction Enterprises
- 16.2.12.1. Overview
- 16.2.12.2. Products
- 16.2.12.3. SWOT Analysis
- 16.2.12.4. Recent Developments
- 16.2.12.5. Financials (Based on Availability)
- 16.2.13 Structure Tone LLC**List Not Exhaustive
- 16.2.13.1. Overview
- 16.2.13.2. Products
- 16.2.13.3. SWOT Analysis
- 16.2.13.4. Recent Developments
- 16.2.13.5. Financials (Based on Availability)
- 16.2.1 Hitt Contracting
List of Figures
- Figure 1: Global USA Office Real Estate Industry Revenue Breakdown (Million, %) by Region 2024 & 2032
- Figure 2: United states USA Office Real Estate Industry Revenue (Million), by Country 2024 & 2032
- Figure 3: United states USA Office Real Estate Industry Revenue Share (%), by Country 2024 & 2032
- Figure 4: North America USA Office Real Estate Industry Revenue (Million), by Sector 2024 & 2032
- Figure 5: North America USA Office Real Estate Industry Revenue Share (%), by Sector 2024 & 2032
- Figure 6: North America USA Office Real Estate Industry Revenue (Million), by Country 2024 & 2032
- Figure 7: North America USA Office Real Estate Industry Revenue Share (%), by Country 2024 & 2032
- Figure 8: South America USA Office Real Estate Industry Revenue (Million), by Sector 2024 & 2032
- Figure 9: South America USA Office Real Estate Industry Revenue Share (%), by Sector 2024 & 2032
- Figure 10: South America USA Office Real Estate Industry Revenue (Million), by Country 2024 & 2032
- Figure 11: South America USA Office Real Estate Industry Revenue Share (%), by Country 2024 & 2032
- Figure 12: Europe USA Office Real Estate Industry Revenue (Million), by Sector 2024 & 2032
- Figure 13: Europe USA Office Real Estate Industry Revenue Share (%), by Sector 2024 & 2032
- Figure 14: Europe USA Office Real Estate Industry Revenue (Million), by Country 2024 & 2032
- Figure 15: Europe USA Office Real Estate Industry Revenue Share (%), by Country 2024 & 2032
- Figure 16: Middle East & Africa USA Office Real Estate Industry Revenue (Million), by Sector 2024 & 2032
- Figure 17: Middle East & Africa USA Office Real Estate Industry Revenue Share (%), by Sector 2024 & 2032
- Figure 18: Middle East & Africa USA Office Real Estate Industry Revenue (Million), by Country 2024 & 2032
- Figure 19: Middle East & Africa USA Office Real Estate Industry Revenue Share (%), by Country 2024 & 2032
- Figure 20: Asia Pacific USA Office Real Estate Industry Revenue (Million), by Sector 2024 & 2032
- Figure 21: Asia Pacific USA Office Real Estate Industry Revenue Share (%), by Sector 2024 & 2032
- Figure 22: Asia Pacific USA Office Real Estate Industry Revenue (Million), by Country 2024 & 2032
- Figure 23: Asia Pacific USA Office Real Estate Industry Revenue Share (%), by Country 2024 & 2032
List of Tables
- Table 1: Global USA Office Real Estate Industry Revenue Million Forecast, by Region 2019 & 2032
- Table 2: Global USA Office Real Estate Industry Revenue Million Forecast, by Sector 2019 & 2032
- Table 3: Global USA Office Real Estate Industry Revenue Million Forecast, by Region 2019 & 2032
- Table 4: Global USA Office Real Estate Industry Revenue Million Forecast, by Country 2019 & 2032
- Table 5: Northeast USA Office Real Estate Industry Revenue (Million) Forecast, by Application 2019 & 2032
- Table 6: Southeast USA Office Real Estate Industry Revenue (Million) Forecast, by Application 2019 & 2032
- Table 7: Midwest USA Office Real Estate Industry Revenue (Million) Forecast, by Application 2019 & 2032
- Table 8: Southwest USA Office Real Estate Industry Revenue (Million) Forecast, by Application 2019 & 2032
- Table 9: West USA Office Real Estate Industry Revenue (Million) Forecast, by Application 2019 & 2032
- Table 10: Global USA Office Real Estate Industry Revenue Million Forecast, by Sector 2019 & 2032
- Table 11: Global USA Office Real Estate Industry Revenue Million Forecast, by Country 2019 & 2032
- Table 12: United States USA Office Real Estate Industry Revenue (Million) Forecast, by Application 2019 & 2032
- Table 13: Canada USA Office Real Estate Industry Revenue (Million) Forecast, by Application 2019 & 2032
- Table 14: Mexico USA Office Real Estate Industry Revenue (Million) Forecast, by Application 2019 & 2032
- Table 15: Global USA Office Real Estate Industry Revenue Million Forecast, by Sector 2019 & 2032
- Table 16: Global USA Office Real Estate Industry Revenue Million Forecast, by Country 2019 & 2032
- Table 17: Brazil USA Office Real Estate Industry Revenue (Million) Forecast, by Application 2019 & 2032
- Table 18: Argentina USA Office Real Estate Industry Revenue (Million) Forecast, by Application 2019 & 2032
- Table 19: Rest of South America USA Office Real Estate Industry Revenue (Million) Forecast, by Application 2019 & 2032
- Table 20: Global USA Office Real Estate Industry Revenue Million Forecast, by Sector 2019 & 2032
- Table 21: Global USA Office Real Estate Industry Revenue Million Forecast, by Country 2019 & 2032
- Table 22: United Kingdom USA Office Real Estate Industry Revenue (Million) Forecast, by Application 2019 & 2032
- Table 23: Germany USA Office Real Estate Industry Revenue (Million) Forecast, by Application 2019 & 2032
- Table 24: France USA Office Real Estate Industry Revenue (Million) Forecast, by Application 2019 & 2032
- Table 25: Italy USA Office Real Estate Industry Revenue (Million) Forecast, by Application 2019 & 2032
- Table 26: Spain USA Office Real Estate Industry Revenue (Million) Forecast, by Application 2019 & 2032
- Table 27: Russia USA Office Real Estate Industry Revenue (Million) Forecast, by Application 2019 & 2032
- Table 28: Benelux USA Office Real Estate Industry Revenue (Million) Forecast, by Application 2019 & 2032
- Table 29: Nordics USA Office Real Estate Industry Revenue (Million) Forecast, by Application 2019 & 2032
- Table 30: Rest of Europe USA Office Real Estate Industry Revenue (Million) Forecast, by Application 2019 & 2032
- Table 31: Global USA Office Real Estate Industry Revenue Million Forecast, by Sector 2019 & 2032
- Table 32: Global USA Office Real Estate Industry Revenue Million Forecast, by Country 2019 & 2032
- Table 33: Turkey USA Office Real Estate Industry Revenue (Million) Forecast, by Application 2019 & 2032
- Table 34: Israel USA Office Real Estate Industry Revenue (Million) Forecast, by Application 2019 & 2032
- Table 35: GCC USA Office Real Estate Industry Revenue (Million) Forecast, by Application 2019 & 2032
- Table 36: North Africa USA Office Real Estate Industry Revenue (Million) Forecast, by Application 2019 & 2032
- Table 37: South Africa USA Office Real Estate Industry Revenue (Million) Forecast, by Application 2019 & 2032
- Table 38: Rest of Middle East & Africa USA Office Real Estate Industry Revenue (Million) Forecast, by Application 2019 & 2032
- Table 39: Global USA Office Real Estate Industry Revenue Million Forecast, by Sector 2019 & 2032
- Table 40: Global USA Office Real Estate Industry Revenue Million Forecast, by Country 2019 & 2032
- Table 41: China USA Office Real Estate Industry Revenue (Million) Forecast, by Application 2019 & 2032
- Table 42: India USA Office Real Estate Industry Revenue (Million) Forecast, by Application 2019 & 2032
- Table 43: Japan USA Office Real Estate Industry Revenue (Million) Forecast, by Application 2019 & 2032
- Table 44: South Korea USA Office Real Estate Industry Revenue (Million) Forecast, by Application 2019 & 2032
- Table 45: ASEAN USA Office Real Estate Industry Revenue (Million) Forecast, by Application 2019 & 2032
- Table 46: Oceania USA Office Real Estate Industry Revenue (Million) Forecast, by Application 2019 & 2032
- Table 47: Rest of Asia Pacific USA Office Real Estate Industry Revenue (Million) Forecast, by Application 2019 & 2032
Frequently Asked Questions
1. What is the projected Compound Annual Growth Rate (CAGR) of the USA Office Real Estate Industry?
The projected CAGR is approximately > 4.00%.
2. Which companies are prominent players in the USA Office Real Estate Industry?
Key companies in the market include Hitt Contracting, Kiewit Corporation, Gilbane Building Co, B L Harbert International, Hensel Phelps Construction, Ryan Companies US Inc, Skanska USA Inc, Turner Construction Company Inc, Trammell Crow Company, Clayco Inc, Dpr Construction, PCL Construction Enterprises, Structure Tone LLC**List Not Exhaustive.
3. What are the main segments of the USA Office Real Estate Industry?
The market segments include Sector.
4. Can you provide details about the market size?
The market size is estimated to be USD XX Million as of 2022.
5. What are some drivers contributing to market growth?
Increasing Disposable Income and Middle-Class Expansion; Increased Awareness of Roofing Solutions.
6. What are the notable trends driving market growth?
Increase in Leasing Volumes.
7. Are there any restraints impacting market growth?
The presence of counterfeit or substandard roofing materials in the market poses a significant challenge; The roofing industry faces a shortage of skilled labor.
8. Can you provide examples of recent developments in the market?
N/A
9. What pricing options are available for accessing the report?
Pricing options include single-user, multi-user, and enterprise licenses priced at USD 3800, USD 4500, and USD 5800 respectively.
10. Is the market size provided in terms of value or volume?
The market size is provided in terms of value, measured in Million.
11. Are there any specific market keywords associated with the report?
Yes, the market keyword associated with the report is "USA Office Real Estate Industry," which aids in identifying and referencing the specific market segment covered.
12. How do I determine which pricing option suits my needs best?
The pricing options vary based on user requirements and access needs. Individual users may opt for single-user licenses, while businesses requiring broader access may choose multi-user or enterprise licenses for cost-effective access to the report.
13. Are there any additional resources or data provided in the USA Office Real Estate Industry report?
While the report offers comprehensive insights, it's advisable to review the specific contents or supplementary materials provided to ascertain if additional resources or data are available.
14. How can I stay updated on further developments or reports in the USA Office Real Estate Industry?
To stay informed about further developments, trends, and reports in the USA Office Real Estate Industry, consider subscribing to industry newsletters, following relevant companies and organizations, or regularly checking reputable industry news sources and publications.
Methodology
Step 1 - Identification of Relevant Samples Size from Population Database


Step 2 - Approaches for Defining Global Market Size (Value, Volume* & Price*)

Note*: In applicable scenarios
Step 3 - Data Sources
Primary Research
- Web Analytics
- Survey Reports
- Research Institute
- Latest Research Reports
- Opinion Leaders
Secondary Research
- Annual Reports
- White Paper
- Latest Press Release
- Industry Association
- Paid Database
- Investor Presentations

Step 4 - Data Triangulation
Involves using different sources of information in order to increase the validity of a study
These sources are likely to be stakeholders in a program - participants, other researchers, program staff, other community members, and so on.
Then we put all data in single framework & apply various statistical tools to find out the dynamic on the market.
During the analysis stage, feedback from the stakeholder groups would be compared to determine areas of agreement as well as areas of divergence
