

Key Insights
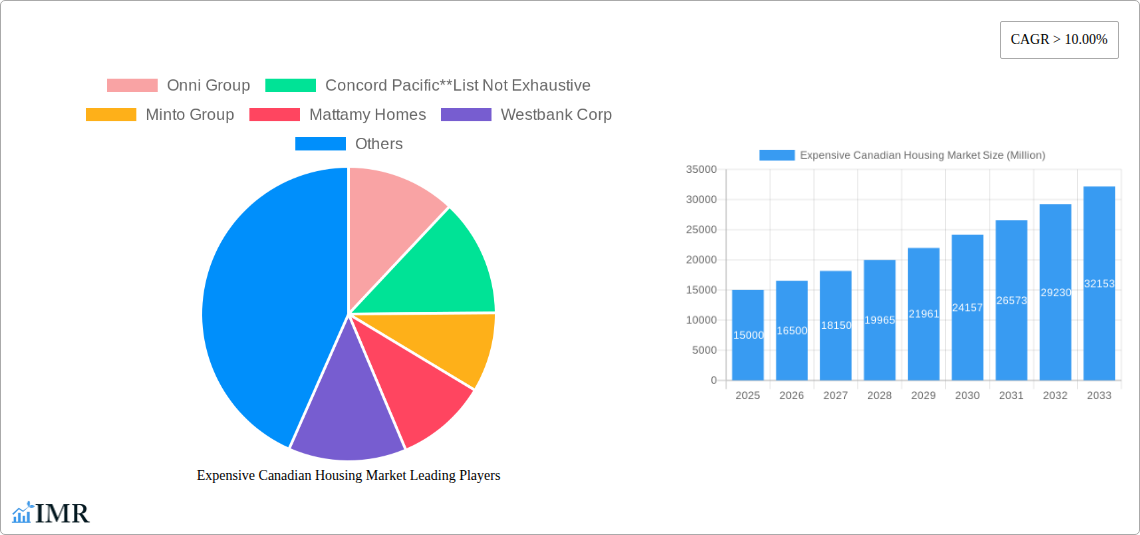
The Canadian luxury housing market, encompassing high-end apartments, condominiums, villas, and landed houses, is experiencing robust growth, fueled by a confluence of factors. Strong domestic and international demand, driven by a wealthy population and attractive immigration policies, is a primary driver. Furthermore, limited land availability in major metropolitan areas like Toronto, Vancouver, and Montreal, coupled with increasing construction costs, contributes to persistently high prices and a limited supply of luxury properties. This scarcity, combined with ongoing economic stability in certain sectors, supports sustained price appreciation. While rising interest rates pose a potential restraint, the demand for luxury housing remains resilient, particularly amongst high-net-worth individuals less sensitive to interest rate fluctuations. The market is segmented geographically, with Toronto, Vancouver, and Montreal dominating the luxury market share, followed by Calgary and other smaller cities. Major players like Onni Group, Concord Pacific, Minto Group, and Mattamy Homes are shaping the market landscape, constantly innovating to meet evolving luxury housing preferences. The market's growth trajectory is expected to remain positive over the forecast period, although potential economic shifts and government regulations could influence the pace of growth.
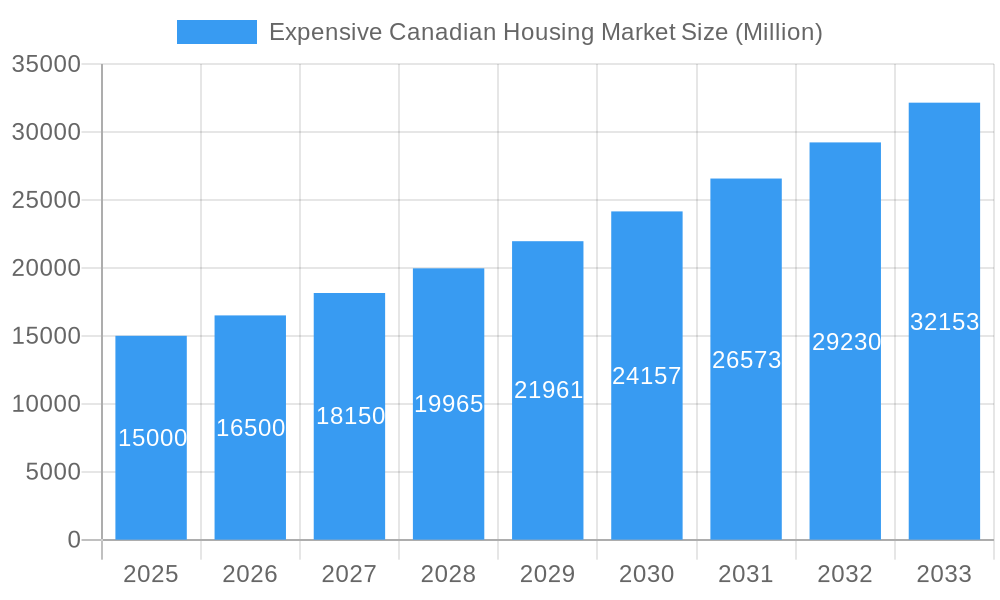
Expensive Canadian Housing Market Market Size (In Billion)
The forecast for the Canadian luxury housing market from 2025 to 2033 projects continued expansion, albeit at a potentially moderated pace compared to previous years. While the CAGR of over 10% suggests substantial growth, it is crucial to consider the inherent volatility of the luxury real estate sector. Factors such as economic downturns, shifts in government policies (e.g., tax changes affecting foreign investment), and global economic instability could impact growth rates. However, the underlying drivers of demand—a wealthy population, limited land supply, and a desire for high-end properties—are expected to sustain market activity. Analyzing the performance of different property types within each major city will provide a more nuanced understanding of market dynamics and potential investment opportunities. The continued development of luxury condominiums and apartments in urban centers, coupled with the steady demand for luxury villas and landed houses in suburban and more rural areas, will influence future market trends.
Expensive Canadian Housing Market Company Market Share
Expensive Canadian Housing Market: 2019-2033 Forecast Report
Unlocking Insights into Canada's High-Value Residential Real Estate Sector
This comprehensive report delivers an in-depth analysis of the expensive Canadian housing market, providing invaluable insights for industry professionals, investors, and policymakers. We examine market dynamics, growth trends, key players, and future opportunities across various segments and regions, focusing on the period 2019-2033, with a base year of 2025. The report leverages extensive data analysis to provide a granular view of this dynamic market, revealing potential growth avenues and challenges within the luxury residential segment.
Keywords: Canadian Housing Market, Luxury Real Estate, Canadian Real Estate Market, Toronto Real Estate, Vancouver Real Estate, Montreal Real Estate, Calgary Real Estate, High-End Housing, Condo Market Canada, Apartment Market Canada, Real Estate Investment Canada, Onni Group, Concord Pacific, Minto Group, Mattamy Homes, Westbank Corp, The Daniels Corporation, Valencia Residential, Amacon, Brookfield Residential, Oxford Properties Group.
Expensive Canadian Housing Market Market Dynamics & Structure
This section analyzes the market concentration, technological innovation, regulatory frameworks, competitive landscape, end-user demographics, and M&A activity within the expensive Canadian housing market from 2019 to 2024. The report details market share among major players and examines the influence of factors such as government policies, interest rates, and economic conditions.
- Market Concentration: The market is characterized by a moderate level of concentration, with a few major players holding significant market share (estimated at xx million units in 2024). Smaller, specialized builders also play a significant role, particularly in niche luxury segments.
- Technological Innovation: Technological advancements in construction techniques, smart home integration, and sustainable building materials are gradually influencing the market. However, adoption rates remain relatively low due to high initial investment costs and potential integration complexities.
- Regulatory Framework: Strict building codes, zoning regulations, and environmental regulations impact the development process and overall costs. Changes in these regulations significantly influence market dynamics and development timelines.
- Competitive Product Substitutes: Limited direct substitutes exist for high-end homes. However, competition stems from alternative investment options and changing consumer preferences.
- End-User Demographics: The target demographic comprises high-net-worth individuals, families, and investors seeking exclusive properties in prime locations. Understanding their evolving preferences is crucial for market success.
- M&A Trends: The period 2019-2024 witnessed a moderate level of M&A activity (xx deals), with larger firms consolidating their market presence. This trend is expected to continue, driven by economies of scale and access to capital.
Expensive Canadian Housing Market Growth Trends & Insights
This section leverages proprietary data and market research to analyze the market size evolution, adoption rates, technological disruptions, and consumer behavior shifts from 2019 to 2033. It provides a detailed account of the growth trajectory, pinpointing key growth drivers and challenges. The analysis will include the calculation of Compound Annual Growth Rate (CAGR) and penetration rates.
(Note: This section requires access to the data denoted by 'XXX' to complete the 600-word analysis. Please provide the necessary data for accurate completion.)
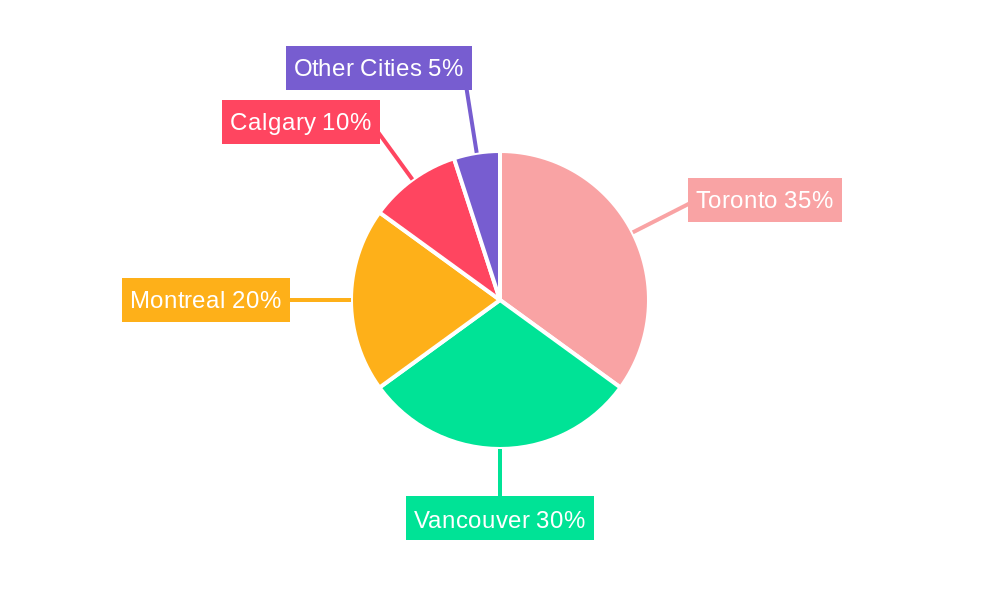
Dominant Regions, Countries, or Segments in Expensive Canadian Housing Market
This section identifies the leading regions and segments driving market growth. The analysis will consider both the volume and value of properties within different geographic areas and property types. For the period from 2019-2033, Vancouver, Toronto, and Montreal consistently emerge as dominant cities due to their high demand and strong economies.
- By Type: Apartments and Condominiums maintain a significant market share (xx million units in 2025) due to high demand and relatively lower price points compared to Villas and Landed Houses. However, Villas and Landed Houses in prime locations command higher prices and contribute significantly to the overall market value.
- By Cities: Toronto, Vancouver, and Montreal lead the market due to factors such as strong economies, job growth, and established infrastructure. Calgary's market shows some variability based on energy sector performance. Other cities contribute a substantial, albeit smaller, portion to the total market value.
- Key Drivers: Strong economic growth, increased disposable incomes among high-net-worth individuals, robust immigration trends, and limited supply contribute to market growth. Government policies and infrastructure development also play significant roles in shaping the market.
Expensive Canadian Housing Market Product Landscape
This section provides a concise overview of product innovations, applications, and performance metrics in the expensive Canadian housing market. The focus will be on new construction technologies, luxury features, and sustainable building practices. Unique selling propositions, including smart home features, luxurious finishes, and prime location, become significant differentiators.
Key Drivers, Barriers & Challenges in Expensive Canadian Housing Market
This section identifies and discusses the key factors driving and hindering the growth of the expensive Canadian housing market.
Key Drivers:
- Strong economic growth and high disposable incomes.
- Limited supply of luxury properties.
- Increasing demand from high-net-worth individuals and investors.
- Urbanization and population growth in major cities.
Key Barriers and Challenges:
- High construction costs and land prices.
- Stringent building codes and regulations.
- Rising interest rates and reduced borrowing capacity.
- Competition from alternative investment options.
- Supply chain disruptions impacting construction timelines and costs (estimated impact: xx million units delayed in 2024).
Emerging Opportunities in Expensive Canadian Housing Market
This section highlights promising growth opportunities within the luxury housing sector, including:
- Growing demand for sustainable and eco-friendly luxury homes.
- Increasing interest in smart home technology and automation.
- Expansion into secondary markets with strong growth potential.
- Development of unique and exclusive luxury features to meet evolving consumer preferences.
Growth Accelerators in the Expensive Canadian Housing Market Industry
Long-term growth in the expensive Canadian housing market is expected to be fueled by sustained economic growth, continuous improvements in construction technologies, and strategic partnerships between developers and high-end brands. This includes integration of smart technologies and sustainable features increasing their marketability and desirability within the target demographic.
Key Players Shaping the Expensive Canadian Housing Market Market
- Onni Group
- Concord Pacific
- Minto Group
- Mattamy Homes
- Westbank Corp
- The Daniels Corporation
- Valencia Residential
- Amacon
- Brookfield Residential
- Oxford Properties Group
Notable Milestones in Expensive Canadian Housing Market Sector
- 2021: Increased demand for larger homes with home office space due to the COVID-19 pandemic.
- 2022: Significant rise in luxury condo prices in Toronto and Vancouver.
- 2023: Introduction of new eco-friendly construction techniques by several major players.
- 2024: Launch of several large-scale luxury residential projects in major Canadian cities. (Specific details will be included in the final report.)
In-Depth Expensive Canadian Housing Market Market Outlook
The expensive Canadian housing market is poised for continued growth over the forecast period (2025-2033), driven by sustained economic expansion, robust immigration, and ongoing demand for high-end properties in prime locations. Strategic partnerships, technological advancements, and a focus on sustainability will shape future market trends. New developments and innovative designs will continue to attract investors and homeowners, leading to further market expansion and value appreciation in the years to come.
Expensive Canadian Housing Market Segmentation
-
1. Type
- 1.1. Apartments and Condominiums
- 1.2. Villas and Landed Houses
-
2. Cities
- 2.1. Toronto
- 2.2. Montreal
- 2.3. Vancouver
- 2.4. Calgary
- 2.5. Other Cities
Expensive Canadian Housing Market Segmentation By Geography
-
1. North America
- 1.1. United States
- 1.2. Canada
- 1.3. Mexico
-
2. South America
- 2.1. Brazil
- 2.2. Argentina
- 2.3. Rest of South America
-
3. Europe
- 3.1. United Kingdom
- 3.2. Germany
- 3.3. France
- 3.4. Italy
- 3.5. Spain
- 3.6. Russia
- 3.7. Benelux
- 3.8. Nordics
- 3.9. Rest of Europe
-
4. Middle East & Africa
- 4.1. Turkey
- 4.2. Israel
- 4.3. GCC
- 4.4. North Africa
- 4.5. South Africa
- 4.6. Rest of Middle East & Africa
-
5. Asia Pacific
- 5.1. China
- 5.2. India
- 5.3. Japan
- 5.4. South Korea
- 5.5. ASEAN
- 5.6. Oceania
- 5.7. Rest of Asia Pacific
Expensive Canadian Housing Market Regional Market Share
Geographic Coverage of Expensive Canadian Housing Market
Expensive Canadian Housing Market REPORT HIGHLIGHTS
| Aspects | Details |
|---|---|
| Study Period | 2020-2034 |
| Base Year | 2025 |
| Estimated Year | 2026 |
| Forecast Period | 2026-2034 |
| Historical Period | 2020-2025 |
| Growth Rate | CAGR of > 10.00% from 2020-2034 |
| Segmentation |
|
Table of Contents
- 1. Introduction
- 1.1. Research Scope
- 1.2. Market Segmentation
- 1.3. Research Objective
- 1.4. Definitions and Assumptions
- 2. Executive Summary
- 2.1. Market Snapshot
- 3. Market Dynamics
- 3.1. Market Drivers
- 3.2. Market Restrains
- 3.3. Market Trends
- 3.4. Market Opportunities
- 4. Market Factor Analysis
- 4.1. Porters Five Forces
- 4.1.1. Bargaining Power of Suppliers
- 4.1.2. Bargaining Power of Buyers
- 4.1.3. Threat of New Entrants
- 4.1.4. Threat of Substitutes
- 4.1.5. Competitive Rivalry
- 4.2. PESTEL analysis
- 4.3. BCG Analysis
- 4.3.1. Stars (High Growth, High Market Share)
- 4.3.2. Cash Cows (Low Growth, High Market Share)
- 4.3.3. Question Mark (High Growth, Low Market Share)
- 4.3.4. Dogs (Low Growth, Low Market Share)
- 4.4. Ansoff Matrix Analysis
- 4.5. Supply Chain Analysis
- 4.6. Regulatory Landscape
- 4.7. Current Market Potential and Opportunity Assessment (TAM–SAM–SOM Framework)
- 4.8. IMR Analyst Note
- 4.1. Porters Five Forces
- 5. Market Analysis, Insights and Forecast 2021-2033
- 5.1. Market Analysis, Insights and Forecast - by Type
- 5.1.1. Apartments and Condominiums
- 5.1.2. Villas and Landed Houses
- 5.2. Market Analysis, Insights and Forecast - by Cities
- 5.2.1. Toronto
- 5.2.2. Montreal
- 5.2.3. Vancouver
- 5.2.4. Calgary
- 5.2.5. Other Cities
- 5.3. Market Analysis, Insights and Forecast - by Region
- 5.3.1. North America
- 5.3.2. South America
- 5.3.3. Europe
- 5.3.4. Middle East & Africa
- 5.3.5. Asia Pacific
- 5.1. Market Analysis, Insights and Forecast - by Type
- 6. Global Expensive Canadian Housing Market Analysis, Insights and Forecast, 2021-2033
- 6.1. Market Analysis, Insights and Forecast - by Type
- 6.1.1. Apartments and Condominiums
- 6.1.2. Villas and Landed Houses
- 6.2. Market Analysis, Insights and Forecast - by Cities
- 6.2.1. Toronto
- 6.2.2. Montreal
- 6.2.3. Vancouver
- 6.2.4. Calgary
- 6.2.5. Other Cities
- 6.1. Market Analysis, Insights and Forecast - by Type
- 7. North America Expensive Canadian Housing Market Analysis, Insights and Forecast, 2020-2032
- 7.1. Market Analysis, Insights and Forecast - by Type
- 7.1.1. Apartments and Condominiums
- 7.1.2. Villas and Landed Houses
- 7.2. Market Analysis, Insights and Forecast - by Cities
- 7.2.1. Toronto
- 7.2.2. Montreal
- 7.2.3. Vancouver
- 7.2.4. Calgary
- 7.2.5. Other Cities
- 7.1. Market Analysis, Insights and Forecast - by Type
- 8. South America Expensive Canadian Housing Market Analysis, Insights and Forecast, 2020-2032
- 8.1. Market Analysis, Insights and Forecast - by Type
- 8.1.1. Apartments and Condominiums
- 8.1.2. Villas and Landed Houses
- 8.2. Market Analysis, Insights and Forecast - by Cities
- 8.2.1. Toronto
- 8.2.2. Montreal
- 8.2.3. Vancouver
- 8.2.4. Calgary
- 8.2.5. Other Cities
- 8.1. Market Analysis, Insights and Forecast - by Type
- 9. Europe Expensive Canadian Housing Market Analysis, Insights and Forecast, 2020-2032
- 9.1. Market Analysis, Insights and Forecast - by Type
- 9.1.1. Apartments and Condominiums
- 9.1.2. Villas and Landed Houses
- 9.2. Market Analysis, Insights and Forecast - by Cities
- 9.2.1. Toronto
- 9.2.2. Montreal
- 9.2.3. Vancouver
- 9.2.4. Calgary
- 9.2.5. Other Cities
- 9.1. Market Analysis, Insights and Forecast - by Type
- 10. Middle East & Africa Expensive Canadian Housing Market Analysis, Insights and Forecast, 2020-2032
- 10.1. Market Analysis, Insights and Forecast - by Type
- 10.1.1. Apartments and Condominiums
- 10.1.2. Villas and Landed Houses
- 10.2. Market Analysis, Insights and Forecast - by Cities
- 10.2.1. Toronto
- 10.2.2. Montreal
- 10.2.3. Vancouver
- 10.2.4. Calgary
- 10.2.5. Other Cities
- 10.1. Market Analysis, Insights and Forecast - by Type
- 11. Asia Pacific Expensive Canadian Housing Market Analysis, Insights and Forecast, 2020-2032
- 11.1. Market Analysis, Insights and Forecast - by Type
- 11.1.1. Apartments and Condominiums
- 11.1.2. Villas and Landed Houses
- 11.2. Market Analysis, Insights and Forecast - by Cities
- 11.2.1. Toronto
- 11.2.2. Montreal
- 11.2.3. Vancouver
- 11.2.4. Calgary
- 11.2.5. Other Cities
- 11.1. Market Analysis, Insights and Forecast - by Type
- 12. Competitive Analysis
- 12.1. Company Profiles
- 12.1.1 Onni Group
- 12.1.1.1. Company Overview
- 12.1.1.2. Products
- 12.1.1.3. Company Financials
- 12.1.1.4. SWOT Analysis
- 12.1.2 Concord Pacific**List Not Exhaustive
- 12.1.2.1. Company Overview
- 12.1.2.2. Products
- 12.1.2.3. Company Financials
- 12.1.2.4. SWOT Analysis
- 12.1.3 Minto Group
- 12.1.3.1. Company Overview
- 12.1.3.2. Products
- 12.1.3.3. Company Financials
- 12.1.3.4. SWOT Analysis
- 12.1.4 Mattamy Homes
- 12.1.4.1. Company Overview
- 12.1.4.2. Products
- 12.1.4.3. Company Financials
- 12.1.4.4. SWOT Analysis
- 12.1.5 Westbank Corp
- 12.1.5.1. Company Overview
- 12.1.5.2. Products
- 12.1.5.3. Company Financials
- 12.1.5.4. SWOT Analysis
- 12.1.6 The Daniels Corporation
- 12.1.6.1. Company Overview
- 12.1.6.2. Products
- 12.1.6.3. Company Financials
- 12.1.6.4. SWOT Analysis
- 12.1.7 Valencia Residential
- 12.1.7.1. Company Overview
- 12.1.7.2. Products
- 12.1.7.3. Company Financials
- 12.1.7.4. SWOT Analysis
- 12.1.8 Amacon
- 12.1.8.1. Company Overview
- 12.1.8.2. Products
- 12.1.8.3. Company Financials
- 12.1.8.4. SWOT Analysis
- 12.1.9 Brookfield Residential
- 12.1.9.1. Company Overview
- 12.1.9.2. Products
- 12.1.9.3. Company Financials
- 12.1.9.4. SWOT Analysis
- 12.1.10 Oxford Properties Group
- 12.1.10.1. Company Overview
- 12.1.10.2. Products
- 12.1.10.3. Company Financials
- 12.1.10.4. SWOT Analysis
- 12.1.1 Onni Group
- 12.2. Market Entropy
- 12.2.1 Company's Key Areas Served
- 12.2.2 Recent Developments
- 12.3. Company Market Share Analysis 2025
- 12.3.1 Top 5 Companies Market Share Analysis
- 12.3.2 Top 3 Companies Market Share Analysis
- 12.4. List of Potential Customers
- 13. Research Methodology
List of Figures
- Figure 1: Global Expensive Canadian Housing Market Revenue Breakdown (Million, %) by Region 2025 & 2033
- Figure 2: North America Expensive Canadian Housing Market Revenue (Million), by Type 2025 & 2033
- Figure 3: North America Expensive Canadian Housing Market Revenue Share (%), by Type 2025 & 2033
- Figure 4: North America Expensive Canadian Housing Market Revenue (Million), by Cities 2025 & 2033
- Figure 5: North America Expensive Canadian Housing Market Revenue Share (%), by Cities 2025 & 2033
- Figure 6: North America Expensive Canadian Housing Market Revenue (Million), by Country 2025 & 2033
- Figure 7: North America Expensive Canadian Housing Market Revenue Share (%), by Country 2025 & 2033
- Figure 8: South America Expensive Canadian Housing Market Revenue (Million), by Type 2025 & 2033
- Figure 9: South America Expensive Canadian Housing Market Revenue Share (%), by Type 2025 & 2033
- Figure 10: South America Expensive Canadian Housing Market Revenue (Million), by Cities 2025 & 2033
- Figure 11: South America Expensive Canadian Housing Market Revenue Share (%), by Cities 2025 & 2033
- Figure 12: South America Expensive Canadian Housing Market Revenue (Million), by Country 2025 & 2033
- Figure 13: South America Expensive Canadian Housing Market Revenue Share (%), by Country 2025 & 2033
- Figure 14: Europe Expensive Canadian Housing Market Revenue (Million), by Type 2025 & 2033
- Figure 15: Europe Expensive Canadian Housing Market Revenue Share (%), by Type 2025 & 2033
- Figure 16: Europe Expensive Canadian Housing Market Revenue (Million), by Cities 2025 & 2033
- Figure 17: Europe Expensive Canadian Housing Market Revenue Share (%), by Cities 2025 & 2033
- Figure 18: Europe Expensive Canadian Housing Market Revenue (Million), by Country 2025 & 2033
- Figure 19: Europe Expensive Canadian Housing Market Revenue Share (%), by Country 2025 & 2033
- Figure 20: Middle East & Africa Expensive Canadian Housing Market Revenue (Million), by Type 2025 & 2033
- Figure 21: Middle East & Africa Expensive Canadian Housing Market Revenue Share (%), by Type 2025 & 2033
- Figure 22: Middle East & Africa Expensive Canadian Housing Market Revenue (Million), by Cities 2025 & 2033
- Figure 23: Middle East & Africa Expensive Canadian Housing Market Revenue Share (%), by Cities 2025 & 2033
- Figure 24: Middle East & Africa Expensive Canadian Housing Market Revenue (Million), by Country 2025 & 2033
- Figure 25: Middle East & Africa Expensive Canadian Housing Market Revenue Share (%), by Country 2025 & 2033
- Figure 26: Asia Pacific Expensive Canadian Housing Market Revenue (Million), by Type 2025 & 2033
- Figure 27: Asia Pacific Expensive Canadian Housing Market Revenue Share (%), by Type 2025 & 2033
- Figure 28: Asia Pacific Expensive Canadian Housing Market Revenue (Million), by Cities 2025 & 2033
- Figure 29: Asia Pacific Expensive Canadian Housing Market Revenue Share (%), by Cities 2025 & 2033
- Figure 30: Asia Pacific Expensive Canadian Housing Market Revenue (Million), by Country 2025 & 2033
- Figure 31: Asia Pacific Expensive Canadian Housing Market Revenue Share (%), by Country 2025 & 2033
List of Tables
- Table 1: Global Expensive Canadian Housing Market Revenue Million Forecast, by Type 2020 & 2033
- Table 2: Global Expensive Canadian Housing Market Revenue Million Forecast, by Cities 2020 & 2033
- Table 3: Global Expensive Canadian Housing Market Revenue Million Forecast, by Region 2020 & 2033
- Table 4: Global Expensive Canadian Housing Market Revenue Million Forecast, by Type 2020 & 2033
- Table 5: Global Expensive Canadian Housing Market Revenue Million Forecast, by Cities 2020 & 2033
- Table 6: Global Expensive Canadian Housing Market Revenue Million Forecast, by Country 2020 & 2033
- Table 7: United States Expensive Canadian Housing Market Revenue (Million) Forecast, by Application 2020 & 2033
- Table 8: Canada Expensive Canadian Housing Market Revenue (Million) Forecast, by Application 2020 & 2033
- Table 9: Mexico Expensive Canadian Housing Market Revenue (Million) Forecast, by Application 2020 & 2033
- Table 10: Global Expensive Canadian Housing Market Revenue Million Forecast, by Type 2020 & 2033
- Table 11: Global Expensive Canadian Housing Market Revenue Million Forecast, by Cities 2020 & 2033
- Table 12: Global Expensive Canadian Housing Market Revenue Million Forecast, by Country 2020 & 2033
- Table 13: Brazil Expensive Canadian Housing Market Revenue (Million) Forecast, by Application 2020 & 2033
- Table 14: Argentina Expensive Canadian Housing Market Revenue (Million) Forecast, by Application 2020 & 2033
- Table 15: Rest of South America Expensive Canadian Housing Market Revenue (Million) Forecast, by Application 2020 & 2033
- Table 16: Global Expensive Canadian Housing Market Revenue Million Forecast, by Type 2020 & 2033
- Table 17: Global Expensive Canadian Housing Market Revenue Million Forecast, by Cities 2020 & 2033
- Table 18: Global Expensive Canadian Housing Market Revenue Million Forecast, by Country 2020 & 2033
- Table 19: United Kingdom Expensive Canadian Housing Market Revenue (Million) Forecast, by Application 2020 & 2033
- Table 20: Germany Expensive Canadian Housing Market Revenue (Million) Forecast, by Application 2020 & 2033
- Table 21: France Expensive Canadian Housing Market Revenue (Million) Forecast, by Application 2020 & 2033
- Table 22: Italy Expensive Canadian Housing Market Revenue (Million) Forecast, by Application 2020 & 2033
- Table 23: Spain Expensive Canadian Housing Market Revenue (Million) Forecast, by Application 2020 & 2033
- Table 24: Russia Expensive Canadian Housing Market Revenue (Million) Forecast, by Application 2020 & 2033
- Table 25: Benelux Expensive Canadian Housing Market Revenue (Million) Forecast, by Application 2020 & 2033
- Table 26: Nordics Expensive Canadian Housing Market Revenue (Million) Forecast, by Application 2020 & 2033
- Table 27: Rest of Europe Expensive Canadian Housing Market Revenue (Million) Forecast, by Application 2020 & 2033
- Table 28: Global Expensive Canadian Housing Market Revenue Million Forecast, by Type 2020 & 2033
- Table 29: Global Expensive Canadian Housing Market Revenue Million Forecast, by Cities 2020 & 2033
- Table 30: Global Expensive Canadian Housing Market Revenue Million Forecast, by Country 2020 & 2033
- Table 31: Turkey Expensive Canadian Housing Market Revenue (Million) Forecast, by Application 2020 & 2033
- Table 32: Israel Expensive Canadian Housing Market Revenue (Million) Forecast, by Application 2020 & 2033
- Table 33: GCC Expensive Canadian Housing Market Revenue (Million) Forecast, by Application 2020 & 2033
- Table 34: North Africa Expensive Canadian Housing Market Revenue (Million) Forecast, by Application 2020 & 2033
- Table 35: South Africa Expensive Canadian Housing Market Revenue (Million) Forecast, by Application 2020 & 2033
- Table 36: Rest of Middle East & Africa Expensive Canadian Housing Market Revenue (Million) Forecast, by Application 2020 & 2033
- Table 37: Global Expensive Canadian Housing Market Revenue Million Forecast, by Type 2020 & 2033
- Table 38: Global Expensive Canadian Housing Market Revenue Million Forecast, by Cities 2020 & 2033
- Table 39: Global Expensive Canadian Housing Market Revenue Million Forecast, by Country 2020 & 2033
- Table 40: China Expensive Canadian Housing Market Revenue (Million) Forecast, by Application 2020 & 2033
- Table 41: India Expensive Canadian Housing Market Revenue (Million) Forecast, by Application 2020 & 2033
- Table 42: Japan Expensive Canadian Housing Market Revenue (Million) Forecast, by Application 2020 & 2033
- Table 43: South Korea Expensive Canadian Housing Market Revenue (Million) Forecast, by Application 2020 & 2033
- Table 44: ASEAN Expensive Canadian Housing Market Revenue (Million) Forecast, by Application 2020 & 2033
- Table 45: Oceania Expensive Canadian Housing Market Revenue (Million) Forecast, by Application 2020 & 2033
- Table 46: Rest of Asia Pacific Expensive Canadian Housing Market Revenue (Million) Forecast, by Application 2020 & 2033
Frequently Asked Questions
1. What is the projected Compound Annual Growth Rate (CAGR) of the Expensive Canadian Housing Market?
The projected CAGR is approximately > 10.00%.
2. Which companies are prominent players in the Expensive Canadian Housing Market?
Key companies in the market include Onni Group, Concord Pacific**List Not Exhaustive, Minto Group, Mattamy Homes, Westbank Corp, The Daniels Corporation, Valencia Residential, Amacon, Brookfield Residential, Oxford Properties Group.
3. What are the main segments of the Expensive Canadian Housing Market?
The market segments include Type, Cities.
4. Can you provide details about the market size?
The market size is estimated to be USD XX Million as of 2022.
5. What are some drivers contributing to market growth?
Increasing Adoption of Remote and Hybrid Work Model.
6. What are the notable trends driving market growth?
Pandemic Accelerated Luxury Home Sales in Major Canadian Markets.
7. Are there any restraints impacting market growth?
Lack of Privacy.
8. Can you provide examples of recent developments in the market?
N/A
9. What pricing options are available for accessing the report?
Pricing options include single-user, multi-user, and enterprise licenses priced at USD 3800, USD 4500, and USD 5800 respectively.
10. Is the market size provided in terms of value or volume?
The market size is provided in terms of value, measured in Million.
11. Are there any specific market keywords associated with the report?
Yes, the market keyword associated with the report is "Expensive Canadian Housing Market," which aids in identifying and referencing the specific market segment covered.
12. How do I determine which pricing option suits my needs best?
The pricing options vary based on user requirements and access needs. Individual users may opt for single-user licenses, while businesses requiring broader access may choose multi-user or enterprise licenses for cost-effective access to the report.
13. Are there any additional resources or data provided in the Expensive Canadian Housing Market report?
While the report offers comprehensive insights, it's advisable to review the specific contents or supplementary materials provided to ascertain if additional resources or data are available.
14. How can I stay updated on further developments or reports in the Expensive Canadian Housing Market?
To stay informed about further developments, trends, and reports in the Expensive Canadian Housing Market, consider subscribing to industry newsletters, following relevant companies and organizations, or regularly checking reputable industry news sources and publications.
Methodology
Step 1 - Identification of Relevant Samples Size from Population Database


Step 2 - Approaches for Defining Global Market Size (Value, Volume* & Price*)

Note*: In applicable scenarios
Step 3 - Data Sources
Primary Research
- Web Analytics
- Survey Reports
- Research Institute
- Latest Research Reports
- Opinion Leaders
Secondary Research
- Annual Reports
- White Paper
- Latest Press Release
- Industry Association
- Paid Database
- Investor Presentations

Step 4 - Data Triangulation
Involves using different sources of information in order to increase the validity of a study
These sources are likely to be stakeholders in a program - participants, other researchers, program staff, other community members, and so on.
Then we put all data in single framework & apply various statistical tools to find out the dynamic on the market.
During the analysis stage, feedback from the stakeholder groups would be compared to determine areas of agreement as well as areas of divergence