

Key Insights
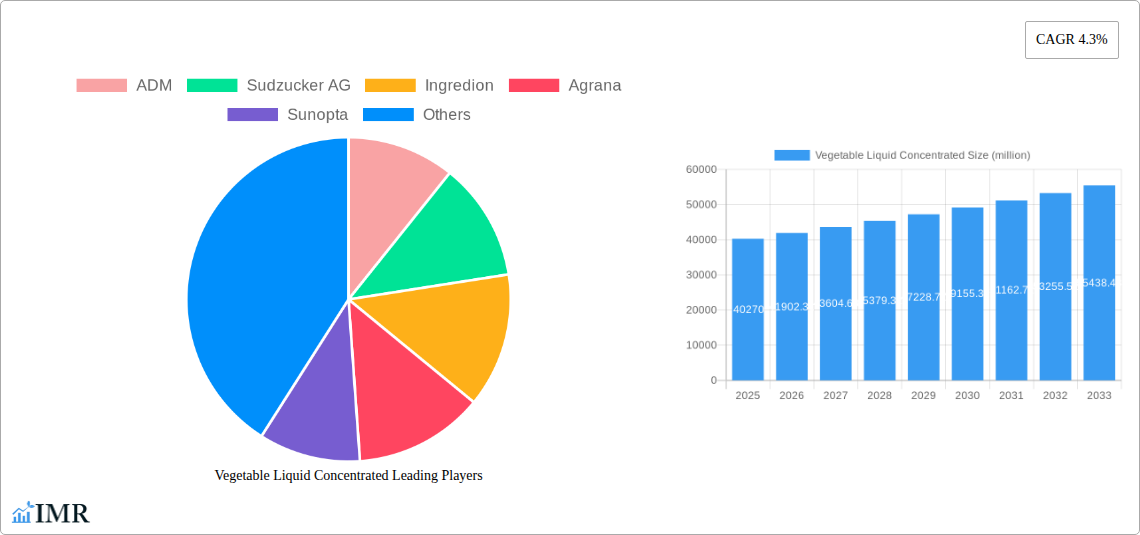
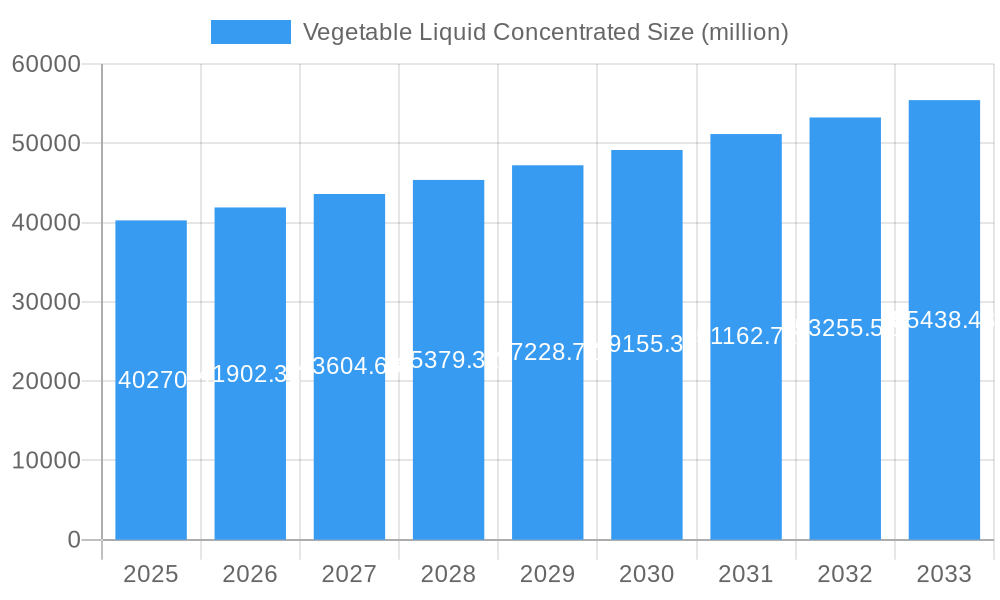
The global vegetable liquid concentrate market, valued at $40,270 million in 2025, is projected to experience steady growth, driven by increasing demand for convenient and healthy food options. The rising popularity of ready-to-eat meals, processed foods, and beverages incorporating vegetable concentrates as natural flavor enhancers and colorants fuels this market expansion. Health-conscious consumers are increasingly seeking natural alternatives to artificial ingredients, further bolstering the demand for vegetable liquid concentrates. Innovation in extraction and processing techniques, leading to improved product quality and shelf life, contributes significantly to market growth. While challenges such as seasonal variations in vegetable availability and fluctuating raw material prices exist, the ongoing trend towards clean-label products and the expansion of the food processing industry are expected to mitigate these restraints. The market is segmented by type of vegetable concentrate (e.g., tomato, carrot, onion, etc.), application (e.g., soups, sauces, beverages), and geography. Key players like ADM, Südzucker AG, and Ingredion are driving innovation and expanding their product portfolios to cater to diverse consumer preferences and market demands. The projected CAGR of 4.3% indicates a consistent, albeit moderate, expansion through 2033.
Vegetable Liquid Concentrated Market Size (In Billion)
The market's competitive landscape features both large multinational corporations and smaller specialized firms. Successful players are focusing on strategic partnerships, mergers and acquisitions, and research and development to enhance their market share and product offerings. The growth in the food service industry and the increasing adoption of vegetable liquid concentrates in various food and beverage applications across different regions contribute to the market's overall growth trajectory. Future growth will likely be shaped by sustainability concerns, with increased focus on environmentally friendly sourcing and processing practices. The development of novel vegetable concentrates with enhanced functionalities and improved nutritional profiles presents significant opportunities for market players. Furthermore, regional variations in consumption patterns and regulatory frameworks will influence the market's future development.
Vegetable Liquid Concentrated Company Market Share
Vegetable Liquid Concentrated Market Report: 2019-2033
This comprehensive report provides an in-depth analysis of the global vegetable liquid concentrated market, encompassing historical data (2019-2024), current estimations (2025), and future projections (2025-2033). The report segments the market by key players (ADM, Sudzucker AG, Ingredion, Agrana, Sunopta, Welch Foods, Diana Naturals, Doehler Group, SVZ International, Kanegrade, Florida Food Products, SkyPeople Fruit Juice), application, and geography, offering invaluable insights for industry professionals, investors, and stakeholders. The market size is expressed in million units.
Vegetable Liquid Concentrated Market Dynamics & Structure
The vegetable liquid concentrated market is characterized by moderate concentration, with a few large players holding significant market share. Technological innovation, driven by the demand for healthier and more convenient food and beverage options, is a key driver. Stringent regulatory frameworks related to food safety and labeling influence market dynamics. Competitive product substitutes, such as powders and pastes, pose a challenge. End-user demographics, particularly the growing preference for processed foods and convenience among younger consumers, contribute to market expansion. Mergers and acquisitions (M&A) activity, while not extremely high, shapes the competitive landscape, with an estimated xx M&A deals in the historical period.
- Market Concentration: Moderately concentrated, with the top 5 players holding approximately xx% market share in 2025.
- Technological Innovation: Focus on sustainable extraction, improved preservation techniques, and functional ingredient development.
- Regulatory Framework: Stringent food safety regulations and labeling requirements influence production and marketing.
- Competitive Substitutes: Powdered and paste vegetable concentrates compete for market share.
- End-User Demographics: Growing demand from processed food and beverage manufacturers, particularly in developing economies.
- M&A Activity: xx M&A deals between 2019-2024, with a projected xx deals during the forecast period.
Vegetable Liquid Concentrated Growth Trends & Insights
The global vegetable liquid concentrated market exhibits robust growth, driven by increasing demand from the food and beverage industry. The market size reached xx million units in 2024, with a CAGR of xx% during the historical period. This growth is fueled by consumer preference shifts towards healthier and convenient food options, technological advancements in processing and preservation, and expansion into new applications. Market penetration is high in developed countries, while emerging markets present significant untapped potential. Technological disruptions, particularly in sustainable processing methods and packaging innovation, are shaping the industry's future. Consumer behavior shifts toward plant-based diets and functional foods are key drivers. The estimated market size in 2025 is xx million units, and the projected CAGR for 2025-2033 is xx%.
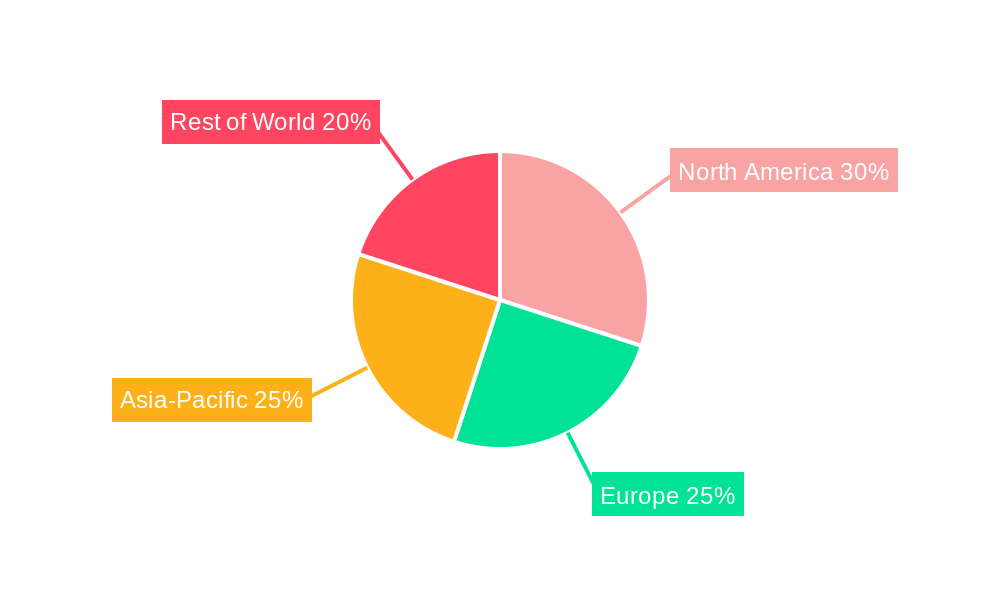
Dominant Regions, Countries, or Segments in Vegetable Liquid Concentrated
North America and Europe currently dominate the vegetable liquid concentrated market, driven by established food processing industries, high consumer spending power, and robust regulatory frameworks. However, Asia-Pacific is projected to exhibit the fastest growth rate due to rising disposable incomes, increasing urbanization, and growing demand for processed foods. Specific countries like China and India hold significant potential.
- North America: Established infrastructure, high consumer demand for processed foods, and strong regulatory standards drive market leadership.
- Europe: High consumption of processed foods, stringent quality standards, and strong research and development capabilities fuel market growth.
- Asia-Pacific: Rapid economic development, rising disposable incomes, and increasing urbanization create significant growth opportunities.
- Key Drivers: Economic growth, increasing urbanization, rising disposable incomes, and the expanding processed food industry.
Vegetable Liquid Concentrated Product Landscape
The vegetable liquid concentrated market offers a range of products catering to diverse applications. Innovations focus on enhancing shelf life, improving flavor profiles, and developing functional ingredients with added health benefits. Concentrates derived from diverse vegetables are available, each with unique nutritional profiles and applications. Technological advancements, such as high-pressure processing and enzymatic treatments, are employed to improve quality and functionality. Unique selling propositions include enhanced taste, extended shelf life, and cost-effectiveness.
Key Drivers, Barriers & Challenges in Vegetable Liquid Concentrated
Key Drivers:
- Growing demand for convenient and healthy food and beverages.
- Increasing use of vegetable concentrates in processed food products.
- Technological advancements in extraction and preservation.
Key Challenges:
- Fluctuations in raw material prices.
- Stringent regulatory requirements for food safety and labeling.
- Intense competition from substitute products.
- Supply chain disruptions potentially impacting availability and cost. The projected impact is a xx% increase in production costs during peak seasons.
Emerging Opportunities in Vegetable Liquid Concentrated
- Expanding into new and untapped markets (e.g., Africa, Latin America).
- Development of innovative applications (e.g., functional foods, nutraceuticals).
- Growing demand for organic and sustainably produced vegetable concentrates.
- Customization of products to meet specific customer requirements.
Growth Accelerators in the Vegetable Liquid Concentrated Industry
Long-term growth will be propelled by technological advancements in processing and packaging, strategic partnerships for market expansion, and collaborations for research and development. Sustainability initiatives and the growing trend towards plant-based diets will further accelerate market growth.
Key Players Shaping the Vegetable Liquid Concentrated Market
- ADM
- Sudzucker AG
- Ingredion
- Agrana
- Sunopta
- Welch Foods
- Diana Naturals
- Doehler Group
- SVZ International
- Kanegrade
- Florida Food Products
- SkyPeople Fruit Juice
Notable Milestones in Vegetable Liquid Concentrated Sector
- 2020: Introduction of a new sustainable extraction technology by ADM.
- 2022: Acquisition of a smaller vegetable processing company by Ingredion.
- 2023: Launch of a new line of organic vegetable concentrates by Sunopta.
- 2024: Increased focus on plant-based product lines across the board.
In-Depth Vegetable Liquid Concentrated Market Outlook
The future of the vegetable liquid concentrated market appears bright, with continued growth driven by several factors. Technological advancements, expanding applications across food and beverage sectors, a focus on sustainability, and the global shift toward healthier lifestyles will contribute to market expansion. Strategic partnerships and acquisitions will shape the competitive landscape. The market is expected to reach xx million units by 2033, presenting significant opportunities for players to innovate and capture market share.
Vegetable Liquid Concentrated Segmentation
-
1. Application
- 1.1. Beverage
- 1.2. Soups and Sauces
- 1.3. Dairy
- 1.4. Bakery and Confectionery
- 1.5. Others
-
2. Type
- 2.1. Carrot Juice
- 2.2. Beet Juice
- 2.3. Spinach Juice
- 2.4. Cucumber Juice
- 2.5. Others
Vegetable Liquid Concentrated Segmentation By Geography
-
1. North America
- 1.1. United States
- 1.2. Canada
- 1.3. Mexico
-
2. South America
- 2.1. Brazil
- 2.2. Argentina
- 2.3. Rest of South America
-
3. Europe
- 3.1. United Kingdom
- 3.2. Germany
- 3.3. France
- 3.4. Italy
- 3.5. Spain
- 3.6. Russia
- 3.7. Benelux
- 3.8. Nordics
- 3.9. Rest of Europe
-
4. Middle East & Africa
- 4.1. Turkey
- 4.2. Israel
- 4.3. GCC
- 4.4. North Africa
- 4.5. South Africa
- 4.6. Rest of Middle East & Africa
-
5. Asia Pacific
- 5.1. China
- 5.2. India
- 5.3. Japan
- 5.4. South Korea
- 5.5. ASEAN
- 5.6. Oceania
- 5.7. Rest of Asia Pacific
Vegetable Liquid Concentrated Regional Market Share
Geographic Coverage of Vegetable Liquid Concentrated
Vegetable Liquid Concentrated REPORT HIGHLIGHTS
| Aspects | Details |
|---|---|
| Study Period | 2020-2034 |
| Base Year | 2025 |
| Estimated Year | 2026 |
| Forecast Period | 2026-2034 |
| Historical Period | 2020-2025 |
| Growth Rate | CAGR of 4.3% from 2020-2034 |
| Segmentation |
|
Table of Contents
- 1. Introduction
- 1.1. Research Scope
- 1.2. Market Segmentation
- 1.3. Research Objective
- 1.4. Definitions and Assumptions
- 2. Executive Summary
- 2.1. Market Snapshot
- 3. Market Dynamics
- 3.1. Market Drivers
- 3.2. Market Restrains
- 3.3. Market Trends
- 3.4. Market Opportunities
- 4. Market Factor Analysis
- 4.1. Porters Five Forces
- 4.1.1. Bargaining Power of Suppliers
- 4.1.2. Bargaining Power of Buyers
- 4.1.3. Threat of New Entrants
- 4.1.4. Threat of Substitutes
- 4.1.5. Competitive Rivalry
- 4.2. PESTEL analysis
- 4.3. BCG Analysis
- 4.3.1. Stars (High Growth, High Market Share)
- 4.3.2. Cash Cows (Low Growth, High Market Share)
- 4.3.3. Question Mark (High Growth, Low Market Share)
- 4.3.4. Dogs (Low Growth, Low Market Share)
- 4.4. Ansoff Matrix Analysis
- 4.5. Supply Chain Analysis
- 4.6. Regulatory Landscape
- 4.7. Current Market Potential and Opportunity Assessment (TAM–SAM–SOM Framework)
- 4.8. IMR Analyst Note
- 4.1. Porters Five Forces
- 5. Market Analysis, Insights and Forecast 2021-2033
- 5.1. Market Analysis, Insights and Forecast - by Application
- 5.1.1. Beverage
- 5.1.2. Soups and Sauces
- 5.1.3. Dairy
- 5.1.4. Bakery and Confectionery
- 5.1.5. Others
- 5.2. Market Analysis, Insights and Forecast - by Type
- 5.2.1. Carrot Juice
- 5.2.2. Beet Juice
- 5.2.3. Spinach Juice
- 5.2.4. Cucumber Juice
- 5.2.5. Others
- 5.3. Market Analysis, Insights and Forecast - by Region
- 5.3.1. North America
- 5.3.2. South America
- 5.3.3. Europe
- 5.3.4. Middle East & Africa
- 5.3.5. Asia Pacific
- 5.1. Market Analysis, Insights and Forecast - by Application
- 6. Global Vegetable Liquid Concentrated Analysis, Insights and Forecast, 2021-2033
- 6.1. Market Analysis, Insights and Forecast - by Application
- 6.1.1. Beverage
- 6.1.2. Soups and Sauces
- 6.1.3. Dairy
- 6.1.4. Bakery and Confectionery
- 6.1.5. Others
- 6.2. Market Analysis, Insights and Forecast - by Type
- 6.2.1. Carrot Juice
- 6.2.2. Beet Juice
- 6.2.3. Spinach Juice
- 6.2.4. Cucumber Juice
- 6.2.5. Others
- 6.1. Market Analysis, Insights and Forecast - by Application
- 7. North America Vegetable Liquid Concentrated Analysis, Insights and Forecast, 2020-2032
- 7.1. Market Analysis, Insights and Forecast - by Application
- 7.1.1. Beverage
- 7.1.2. Soups and Sauces
- 7.1.3. Dairy
- 7.1.4. Bakery and Confectionery
- 7.1.5. Others
- 7.2. Market Analysis, Insights and Forecast - by Type
- 7.2.1. Carrot Juice
- 7.2.2. Beet Juice
- 7.2.3. Spinach Juice
- 7.2.4. Cucumber Juice
- 7.2.5. Others
- 7.1. Market Analysis, Insights and Forecast - by Application
- 8. South America Vegetable Liquid Concentrated Analysis, Insights and Forecast, 2020-2032
- 8.1. Market Analysis, Insights and Forecast - by Application
- 8.1.1. Beverage
- 8.1.2. Soups and Sauces
- 8.1.3. Dairy
- 8.1.4. Bakery and Confectionery
- 8.1.5. Others
- 8.2. Market Analysis, Insights and Forecast - by Type
- 8.2.1. Carrot Juice
- 8.2.2. Beet Juice
- 8.2.3. Spinach Juice
- 8.2.4. Cucumber Juice
- 8.2.5. Others
- 8.1. Market Analysis, Insights and Forecast - by Application
- 9. Europe Vegetable Liquid Concentrated Analysis, Insights and Forecast, 2020-2032
- 9.1. Market Analysis, Insights and Forecast - by Application
- 9.1.1. Beverage
- 9.1.2. Soups and Sauces
- 9.1.3. Dairy
- 9.1.4. Bakery and Confectionery
- 9.1.5. Others
- 9.2. Market Analysis, Insights and Forecast - by Type
- 9.2.1. Carrot Juice
- 9.2.2. Beet Juice
- 9.2.3. Spinach Juice
- 9.2.4. Cucumber Juice
- 9.2.5. Others
- 9.1. Market Analysis, Insights and Forecast - by Application
- 10. Middle East & Africa Vegetable Liquid Concentrated Analysis, Insights and Forecast, 2020-2032
- 10.1. Market Analysis, Insights and Forecast - by Application
- 10.1.1. Beverage
- 10.1.2. Soups and Sauces
- 10.1.3. Dairy
- 10.1.4. Bakery and Confectionery
- 10.1.5. Others
- 10.2. Market Analysis, Insights and Forecast - by Type
- 10.2.1. Carrot Juice
- 10.2.2. Beet Juice
- 10.2.3. Spinach Juice
- 10.2.4. Cucumber Juice
- 10.2.5. Others
- 10.1. Market Analysis, Insights and Forecast - by Application
- 11. Asia Pacific Vegetable Liquid Concentrated Analysis, Insights and Forecast, 2020-2032
- 11.1. Market Analysis, Insights and Forecast - by Application
- 11.1.1. Beverage
- 11.1.2. Soups and Sauces
- 11.1.3. Dairy
- 11.1.4. Bakery and Confectionery
- 11.1.5. Others
- 11.2. Market Analysis, Insights and Forecast - by Type
- 11.2.1. Carrot Juice
- 11.2.2. Beet Juice
- 11.2.3. Spinach Juice
- 11.2.4. Cucumber Juice
- 11.2.5. Others
- 11.1. Market Analysis, Insights and Forecast - by Application
- 12. Competitive Analysis
- 12.1. Company Profiles
- 12.1.1 ADM
- 12.1.1.1. Company Overview
- 12.1.1.2. Products
- 12.1.1.3. Company Financials
- 12.1.1.4. SWOT Analysis
- 12.1.2 Sudzucker AG
- 12.1.2.1. Company Overview
- 12.1.2.2. Products
- 12.1.2.3. Company Financials
- 12.1.2.4. SWOT Analysis
- 12.1.3 Ingredion
- 12.1.3.1. Company Overview
- 12.1.3.2. Products
- 12.1.3.3. Company Financials
- 12.1.3.4. SWOT Analysis
- 12.1.4 Agrana
- 12.1.4.1. Company Overview
- 12.1.4.2. Products
- 12.1.4.3. Company Financials
- 12.1.4.4. SWOT Analysis
- 12.1.5 Sunopta
- 12.1.5.1. Company Overview
- 12.1.5.2. Products
- 12.1.5.3. Company Financials
- 12.1.5.4. SWOT Analysis
- 12.1.6 Welch Foods
- 12.1.6.1. Company Overview
- 12.1.6.2. Products
- 12.1.6.3. Company Financials
- 12.1.6.4. SWOT Analysis
- 12.1.7 Diana Naturals
- 12.1.7.1. Company Overview
- 12.1.7.2. Products
- 12.1.7.3. Company Financials
- 12.1.7.4. SWOT Analysis
- 12.1.8 Doehler Group
- 12.1.8.1. Company Overview
- 12.1.8.2. Products
- 12.1.8.3. Company Financials
- 12.1.8.4. SWOT Analysis
- 12.1.9 SVZ International
- 12.1.9.1. Company Overview
- 12.1.9.2. Products
- 12.1.9.3. Company Financials
- 12.1.9.4. SWOT Analysis
- 12.1.10 Kanegrade
- 12.1.10.1. Company Overview
- 12.1.10.2. Products
- 12.1.10.3. Company Financials
- 12.1.10.4. SWOT Analysis
- 12.1.11 Florida Food Products
- 12.1.11.1. Company Overview
- 12.1.11.2. Products
- 12.1.11.3. Company Financials
- 12.1.11.4. SWOT Analysis
- 12.1.12 SkyPeople Fruit Juice
- 12.1.12.1. Company Overview
- 12.1.12.2. Products
- 12.1.12.3. Company Financials
- 12.1.12.4. SWOT Analysis
- 12.1.1 ADM
- 12.2. Market Entropy
- 12.2.1 Company's Key Areas Served
- 12.2.2 Recent Developments
- 12.3. Company Market Share Analysis 2025
- 12.3.1 Top 5 Companies Market Share Analysis
- 12.3.2 Top 3 Companies Market Share Analysis
- 12.4. List of Potential Customers
- 13. Research Methodology
List of Figures
- Figure 1: Global Vegetable Liquid Concentrated Revenue Breakdown (million, %) by Region 2025 & 2033
- Figure 2: Global Vegetable Liquid Concentrated Volume Breakdown (K, %) by Region 2025 & 2033
- Figure 3: North America Vegetable Liquid Concentrated Revenue (million), by Application 2025 & 2033
- Figure 4: North America Vegetable Liquid Concentrated Volume (K), by Application 2025 & 2033
- Figure 5: North America Vegetable Liquid Concentrated Revenue Share (%), by Application 2025 & 2033
- Figure 6: North America Vegetable Liquid Concentrated Volume Share (%), by Application 2025 & 2033
- Figure 7: North America Vegetable Liquid Concentrated Revenue (million), by Type 2025 & 2033
- Figure 8: North America Vegetable Liquid Concentrated Volume (K), by Type 2025 & 2033
- Figure 9: North America Vegetable Liquid Concentrated Revenue Share (%), by Type 2025 & 2033
- Figure 10: North America Vegetable Liquid Concentrated Volume Share (%), by Type 2025 & 2033
- Figure 11: North America Vegetable Liquid Concentrated Revenue (million), by Country 2025 & 2033
- Figure 12: North America Vegetable Liquid Concentrated Volume (K), by Country 2025 & 2033
- Figure 13: North America Vegetable Liquid Concentrated Revenue Share (%), by Country 2025 & 2033
- Figure 14: North America Vegetable Liquid Concentrated Volume Share (%), by Country 2025 & 2033
- Figure 15: South America Vegetable Liquid Concentrated Revenue (million), by Application 2025 & 2033
- Figure 16: South America Vegetable Liquid Concentrated Volume (K), by Application 2025 & 2033
- Figure 17: South America Vegetable Liquid Concentrated Revenue Share (%), by Application 2025 & 2033
- Figure 18: South America Vegetable Liquid Concentrated Volume Share (%), by Application 2025 & 2033
- Figure 19: South America Vegetable Liquid Concentrated Revenue (million), by Type 2025 & 2033
- Figure 20: South America Vegetable Liquid Concentrated Volume (K), by Type 2025 & 2033
- Figure 21: South America Vegetable Liquid Concentrated Revenue Share (%), by Type 2025 & 2033
- Figure 22: South America Vegetable Liquid Concentrated Volume Share (%), by Type 2025 & 2033
- Figure 23: South America Vegetable Liquid Concentrated Revenue (million), by Country 2025 & 2033
- Figure 24: South America Vegetable Liquid Concentrated Volume (K), by Country 2025 & 2033
- Figure 25: South America Vegetable Liquid Concentrated Revenue Share (%), by Country 2025 & 2033
- Figure 26: South America Vegetable Liquid Concentrated Volume Share (%), by Country 2025 & 2033
- Figure 27: Europe Vegetable Liquid Concentrated Revenue (million), by Application 2025 & 2033
- Figure 28: Europe Vegetable Liquid Concentrated Volume (K), by Application 2025 & 2033
- Figure 29: Europe Vegetable Liquid Concentrated Revenue Share (%), by Application 2025 & 2033
- Figure 30: Europe Vegetable Liquid Concentrated Volume Share (%), by Application 2025 & 2033
- Figure 31: Europe Vegetable Liquid Concentrated Revenue (million), by Type 2025 & 2033
- Figure 32: Europe Vegetable Liquid Concentrated Volume (K), by Type 2025 & 2033
- Figure 33: Europe Vegetable Liquid Concentrated Revenue Share (%), by Type 2025 & 2033
- Figure 34: Europe Vegetable Liquid Concentrated Volume Share (%), by Type 2025 & 2033
- Figure 35: Europe Vegetable Liquid Concentrated Revenue (million), by Country 2025 & 2033
- Figure 36: Europe Vegetable Liquid Concentrated Volume (K), by Country 2025 & 2033
- Figure 37: Europe Vegetable Liquid Concentrated Revenue Share (%), by Country 2025 & 2033
- Figure 38: Europe Vegetable Liquid Concentrated Volume Share (%), by Country 2025 & 2033
- Figure 39: Middle East & Africa Vegetable Liquid Concentrated Revenue (million), by Application 2025 & 2033
- Figure 40: Middle East & Africa Vegetable Liquid Concentrated Volume (K), by Application 2025 & 2033
- Figure 41: Middle East & Africa Vegetable Liquid Concentrated Revenue Share (%), by Application 2025 & 2033
- Figure 42: Middle East & Africa Vegetable Liquid Concentrated Volume Share (%), by Application 2025 & 2033
- Figure 43: Middle East & Africa Vegetable Liquid Concentrated Revenue (million), by Type 2025 & 2033
- Figure 44: Middle East & Africa Vegetable Liquid Concentrated Volume (K), by Type 2025 & 2033
- Figure 45: Middle East & Africa Vegetable Liquid Concentrated Revenue Share (%), by Type 2025 & 2033
- Figure 46: Middle East & Africa Vegetable Liquid Concentrated Volume Share (%), by Type 2025 & 2033
- Figure 47: Middle East & Africa Vegetable Liquid Concentrated Revenue (million), by Country 2025 & 2033
- Figure 48: Middle East & Africa Vegetable Liquid Concentrated Volume (K), by Country 2025 & 2033
- Figure 49: Middle East & Africa Vegetable Liquid Concentrated Revenue Share (%), by Country 2025 & 2033
- Figure 50: Middle East & Africa Vegetable Liquid Concentrated Volume Share (%), by Country 2025 & 2033
- Figure 51: Asia Pacific Vegetable Liquid Concentrated Revenue (million), by Application 2025 & 2033
- Figure 52: Asia Pacific Vegetable Liquid Concentrated Volume (K), by Application 2025 & 2033
- Figure 53: Asia Pacific Vegetable Liquid Concentrated Revenue Share (%), by Application 2025 & 2033
- Figure 54: Asia Pacific Vegetable Liquid Concentrated Volume Share (%), by Application 2025 & 2033
- Figure 55: Asia Pacific Vegetable Liquid Concentrated Revenue (million), by Type 2025 & 2033
- Figure 56: Asia Pacific Vegetable Liquid Concentrated Volume (K), by Type 2025 & 2033
- Figure 57: Asia Pacific Vegetable Liquid Concentrated Revenue Share (%), by Type 2025 & 2033
- Figure 58: Asia Pacific Vegetable Liquid Concentrated Volume Share (%), by Type 2025 & 2033
- Figure 59: Asia Pacific Vegetable Liquid Concentrated Revenue (million), by Country 2025 & 2033
- Figure 60: Asia Pacific Vegetable Liquid Concentrated Volume (K), by Country 2025 & 2033
- Figure 61: Asia Pacific Vegetable Liquid Concentrated Revenue Share (%), by Country 2025 & 2033
- Figure 62: Asia Pacific Vegetable Liquid Concentrated Volume Share (%), by Country 2025 & 2033
List of Tables
- Table 1: Global Vegetable Liquid Concentrated Revenue million Forecast, by Application 2020 & 2033
- Table 2: Global Vegetable Liquid Concentrated Volume K Forecast, by Application 2020 & 2033
- Table 3: Global Vegetable Liquid Concentrated Revenue million Forecast, by Type 2020 & 2033
- Table 4: Global Vegetable Liquid Concentrated Volume K Forecast, by Type 2020 & 2033
- Table 5: Global Vegetable Liquid Concentrated Revenue million Forecast, by Region 2020 & 2033
- Table 6: Global Vegetable Liquid Concentrated Volume K Forecast, by Region 2020 & 2033
- Table 7: Global Vegetable Liquid Concentrated Revenue million Forecast, by Application 2020 & 2033
- Table 8: Global Vegetable Liquid Concentrated Volume K Forecast, by Application 2020 & 2033
- Table 9: Global Vegetable Liquid Concentrated Revenue million Forecast, by Type 2020 & 2033
- Table 10: Global Vegetable Liquid Concentrated Volume K Forecast, by Type 2020 & 2033
- Table 11: Global Vegetable Liquid Concentrated Revenue million Forecast, by Country 2020 & 2033
- Table 12: Global Vegetable Liquid Concentrated Volume K Forecast, by Country 2020 & 2033
- Table 13: United States Vegetable Liquid Concentrated Revenue (million) Forecast, by Application 2020 & 2033
- Table 14: United States Vegetable Liquid Concentrated Volume (K) Forecast, by Application 2020 & 2033
- Table 15: Canada Vegetable Liquid Concentrated Revenue (million) Forecast, by Application 2020 & 2033
- Table 16: Canada Vegetable Liquid Concentrated Volume (K) Forecast, by Application 2020 & 2033
- Table 17: Mexico Vegetable Liquid Concentrated Revenue (million) Forecast, by Application 2020 & 2033
- Table 18: Mexico Vegetable Liquid Concentrated Volume (K) Forecast, by Application 2020 & 2033
- Table 19: Global Vegetable Liquid Concentrated Revenue million Forecast, by Application 2020 & 2033
- Table 20: Global Vegetable Liquid Concentrated Volume K Forecast, by Application 2020 & 2033
- Table 21: Global Vegetable Liquid Concentrated Revenue million Forecast, by Type 2020 & 2033
- Table 22: Global Vegetable Liquid Concentrated Volume K Forecast, by Type 2020 & 2033
- Table 23: Global Vegetable Liquid Concentrated Revenue million Forecast, by Country 2020 & 2033
- Table 24: Global Vegetable Liquid Concentrated Volume K Forecast, by Country 2020 & 2033
- Table 25: Brazil Vegetable Liquid Concentrated Revenue (million) Forecast, by Application 2020 & 2033
- Table 26: Brazil Vegetable Liquid Concentrated Volume (K) Forecast, by Application 2020 & 2033
- Table 27: Argentina Vegetable Liquid Concentrated Revenue (million) Forecast, by Application 2020 & 2033
- Table 28: Argentina Vegetable Liquid Concentrated Volume (K) Forecast, by Application 2020 & 2033
- Table 29: Rest of South America Vegetable Liquid Concentrated Revenue (million) Forecast, by Application 2020 & 2033
- Table 30: Rest of South America Vegetable Liquid Concentrated Volume (K) Forecast, by Application 2020 & 2033
- Table 31: Global Vegetable Liquid Concentrated Revenue million Forecast, by Application 2020 & 2033
- Table 32: Global Vegetable Liquid Concentrated Volume K Forecast, by Application 2020 & 2033
- Table 33: Global Vegetable Liquid Concentrated Revenue million Forecast, by Type 2020 & 2033
- Table 34: Global Vegetable Liquid Concentrated Volume K Forecast, by Type 2020 & 2033
- Table 35: Global Vegetable Liquid Concentrated Revenue million Forecast, by Country 2020 & 2033
- Table 36: Global Vegetable Liquid Concentrated Volume K Forecast, by Country 2020 & 2033
- Table 37: United Kingdom Vegetable Liquid Concentrated Revenue (million) Forecast, by Application 2020 & 2033
- Table 38: United Kingdom Vegetable Liquid Concentrated Volume (K) Forecast, by Application 2020 & 2033
- Table 39: Germany Vegetable Liquid Concentrated Revenue (million) Forecast, by Application 2020 & 2033
- Table 40: Germany Vegetable Liquid Concentrated Volume (K) Forecast, by Application 2020 & 2033
- Table 41: France Vegetable Liquid Concentrated Revenue (million) Forecast, by Application 2020 & 2033
- Table 42: France Vegetable Liquid Concentrated Volume (K) Forecast, by Application 2020 & 2033
- Table 43: Italy Vegetable Liquid Concentrated Revenue (million) Forecast, by Application 2020 & 2033
- Table 44: Italy Vegetable Liquid Concentrated Volume (K) Forecast, by Application 2020 & 2033
- Table 45: Spain Vegetable Liquid Concentrated Revenue (million) Forecast, by Application 2020 & 2033
- Table 46: Spain Vegetable Liquid Concentrated Volume (K) Forecast, by Application 2020 & 2033
- Table 47: Russia Vegetable Liquid Concentrated Revenue (million) Forecast, by Application 2020 & 2033
- Table 48: Russia Vegetable Liquid Concentrated Volume (K) Forecast, by Application 2020 & 2033
- Table 49: Benelux Vegetable Liquid Concentrated Revenue (million) Forecast, by Application 2020 & 2033
- Table 50: Benelux Vegetable Liquid Concentrated Volume (K) Forecast, by Application 2020 & 2033
- Table 51: Nordics Vegetable Liquid Concentrated Revenue (million) Forecast, by Application 2020 & 2033
- Table 52: Nordics Vegetable Liquid Concentrated Volume (K) Forecast, by Application 2020 & 2033
- Table 53: Rest of Europe Vegetable Liquid Concentrated Revenue (million) Forecast, by Application 2020 & 2033
- Table 54: Rest of Europe Vegetable Liquid Concentrated Volume (K) Forecast, by Application 2020 & 2033
- Table 55: Global Vegetable Liquid Concentrated Revenue million Forecast, by Application 2020 & 2033
- Table 56: Global Vegetable Liquid Concentrated Volume K Forecast, by Application 2020 & 2033
- Table 57: Global Vegetable Liquid Concentrated Revenue million Forecast, by Type 2020 & 2033
- Table 58: Global Vegetable Liquid Concentrated Volume K Forecast, by Type 2020 & 2033
- Table 59: Global Vegetable Liquid Concentrated Revenue million Forecast, by Country 2020 & 2033
- Table 60: Global Vegetable Liquid Concentrated Volume K Forecast, by Country 2020 & 2033
- Table 61: Turkey Vegetable Liquid Concentrated Revenue (million) Forecast, by Application 2020 & 2033
- Table 62: Turkey Vegetable Liquid Concentrated Volume (K) Forecast, by Application 2020 & 2033
- Table 63: Israel Vegetable Liquid Concentrated Revenue (million) Forecast, by Application 2020 & 2033
- Table 64: Israel Vegetable Liquid Concentrated Volume (K) Forecast, by Application 2020 & 2033
- Table 65: GCC Vegetable Liquid Concentrated Revenue (million) Forecast, by Application 2020 & 2033
- Table 66: GCC Vegetable Liquid Concentrated Volume (K) Forecast, by Application 2020 & 2033
- Table 67: North Africa Vegetable Liquid Concentrated Revenue (million) Forecast, by Application 2020 & 2033
- Table 68: North Africa Vegetable Liquid Concentrated Volume (K) Forecast, by Application 2020 & 2033
- Table 69: South Africa Vegetable Liquid Concentrated Revenue (million) Forecast, by Application 2020 & 2033
- Table 70: South Africa Vegetable Liquid Concentrated Volume (K) Forecast, by Application 2020 & 2033
- Table 71: Rest of Middle East & Africa Vegetable Liquid Concentrated Revenue (million) Forecast, by Application 2020 & 2033
- Table 72: Rest of Middle East & Africa Vegetable Liquid Concentrated Volume (K) Forecast, by Application 2020 & 2033
- Table 73: Global Vegetable Liquid Concentrated Revenue million Forecast, by Application 2020 & 2033
- Table 74: Global Vegetable Liquid Concentrated Volume K Forecast, by Application 2020 & 2033
- Table 75: Global Vegetable Liquid Concentrated Revenue million Forecast, by Type 2020 & 2033
- Table 76: Global Vegetable Liquid Concentrated Volume K Forecast, by Type 2020 & 2033
- Table 77: Global Vegetable Liquid Concentrated Revenue million Forecast, by Country 2020 & 2033
- Table 78: Global Vegetable Liquid Concentrated Volume K Forecast, by Country 2020 & 2033
- Table 79: China Vegetable Liquid Concentrated Revenue (million) Forecast, by Application 2020 & 2033
- Table 80: China Vegetable Liquid Concentrated Volume (K) Forecast, by Application 2020 & 2033
- Table 81: India Vegetable Liquid Concentrated Revenue (million) Forecast, by Application 2020 & 2033
- Table 82: India Vegetable Liquid Concentrated Volume (K) Forecast, by Application 2020 & 2033
- Table 83: Japan Vegetable Liquid Concentrated Revenue (million) Forecast, by Application 2020 & 2033
- Table 84: Japan Vegetable Liquid Concentrated Volume (K) Forecast, by Application 2020 & 2033
- Table 85: South Korea Vegetable Liquid Concentrated Revenue (million) Forecast, by Application 2020 & 2033
- Table 86: South Korea Vegetable Liquid Concentrated Volume (K) Forecast, by Application 2020 & 2033
- Table 87: ASEAN Vegetable Liquid Concentrated Revenue (million) Forecast, by Application 2020 & 2033
- Table 88: ASEAN Vegetable Liquid Concentrated Volume (K) Forecast, by Application 2020 & 2033
- Table 89: Oceania Vegetable Liquid Concentrated Revenue (million) Forecast, by Application 2020 & 2033
- Table 90: Oceania Vegetable Liquid Concentrated Volume (K) Forecast, by Application 2020 & 2033
- Table 91: Rest of Asia Pacific Vegetable Liquid Concentrated Revenue (million) Forecast, by Application 2020 & 2033
- Table 92: Rest of Asia Pacific Vegetable Liquid Concentrated Volume (K) Forecast, by Application 2020 & 2033
Frequently Asked Questions
1. What is the projected Compound Annual Growth Rate (CAGR) of the Vegetable Liquid Concentrated?
The projected CAGR is approximately 4.3%.
2. Which companies are prominent players in the Vegetable Liquid Concentrated?
Key companies in the market include ADM, Sudzucker AG, Ingredion, Agrana, Sunopta, Welch Foods, Diana Naturals, Doehler Group, SVZ International, Kanegrade, Florida Food Products, SkyPeople Fruit Juice.
3. What are the main segments of the Vegetable Liquid Concentrated?
The market segments include Application, Type.
4. Can you provide details about the market size?
The market size is estimated to be USD 40270 million as of 2022.
5. What are some drivers contributing to market growth?
N/A
6. What are the notable trends driving market growth?
N/A
7. Are there any restraints impacting market growth?
N/A
8. Can you provide examples of recent developments in the market?
N/A
9. What pricing options are available for accessing the report?
Pricing options include single-user, multi-user, and enterprise licenses priced at USD 3950.00, USD 5925.00, and USD 7900.00 respectively.
10. Is the market size provided in terms of value or volume?
The market size is provided in terms of value, measured in million and volume, measured in K.
11. Are there any specific market keywords associated with the report?
Yes, the market keyword associated with the report is "Vegetable Liquid Concentrated," which aids in identifying and referencing the specific market segment covered.
12. How do I determine which pricing option suits my needs best?
The pricing options vary based on user requirements and access needs. Individual users may opt for single-user licenses, while businesses requiring broader access may choose multi-user or enterprise licenses for cost-effective access to the report.
13. Are there any additional resources or data provided in the Vegetable Liquid Concentrated report?
While the report offers comprehensive insights, it's advisable to review the specific contents or supplementary materials provided to ascertain if additional resources or data are available.
14. How can I stay updated on further developments or reports in the Vegetable Liquid Concentrated?
To stay informed about further developments, trends, and reports in the Vegetable Liquid Concentrated, consider subscribing to industry newsletters, following relevant companies and organizations, or regularly checking reputable industry news sources and publications.
Methodology
Step 1 - Identification of Relevant Samples Size from Population Database


Step 2 - Approaches for Defining Global Market Size (Value, Volume* & Price*)

Note*: In applicable scenarios
Step 3 - Data Sources
Primary Research
- Web Analytics
- Survey Reports
- Research Institute
- Latest Research Reports
- Opinion Leaders
Secondary Research
- Annual Reports
- White Paper
- Latest Press Release
- Industry Association
- Paid Database
- Investor Presentations

Step 4 - Data Triangulation
Involves using different sources of information in order to increase the validity of a study
These sources are likely to be stakeholders in a program - participants, other researchers, program staff, other community members, and so on.
Then we put all data in single framework & apply various statistical tools to find out the dynamic on the market.
During the analysis stage, feedback from the stakeholder groups would be compared to determine areas of agreement as well as areas of divergence