

Key Insights
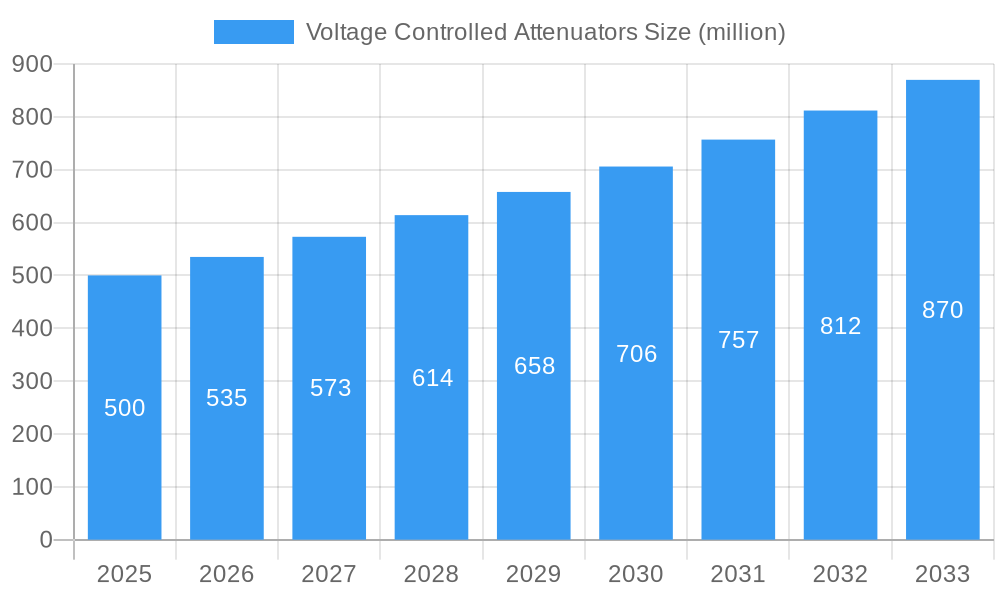
The voltage-controlled attenuator (VCA) market is experiencing robust growth, driven by increasing demand across various sectors. The market, estimated at $500 million in 2025, is projected to exhibit a Compound Annual Growth Rate (CAGR) of 7% from 2025 to 2033, reaching approximately $900 million by 2033. This expansion is fueled by several key factors, including the burgeoning adoption of 5G infrastructure, the proliferation of advanced radar systems, and the rising need for precise signal control in high-frequency applications like satellite communication and test and measurement equipment. Technological advancements leading to smaller form factors, improved linearity, and wider bandwidth capabilities are further stimulating market growth. Leading players like Analog Devices, Qorvo, and Macom are actively investing in R&D to enhance VCA performance and cater to evolving market demands, fostering innovation and competition within the sector.
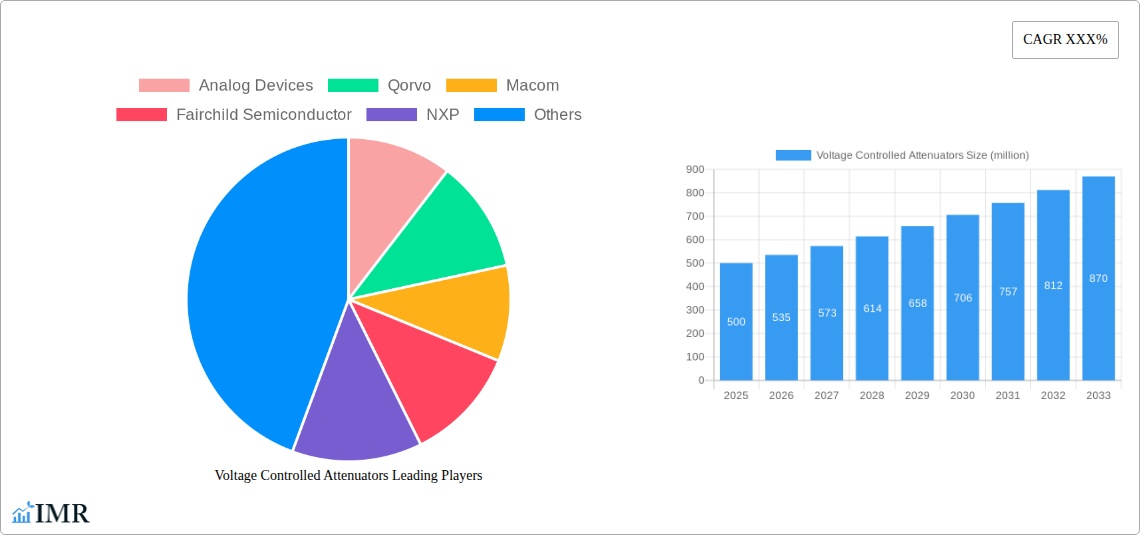
Voltage Controlled Attenuators Market Size (In Million)
However, certain restraints are limiting market growth. The high cost associated with advanced VCA technologies can hinder adoption, especially in cost-sensitive applications. Furthermore, the complexities involved in designing and integrating VCAs into various systems pose a challenge. Despite these limitations, the overall market outlook remains positive. Segmentation analysis reveals strong growth in the high-frequency VCA segment driven by the increasing demand for 5G and millimeter-wave applications. Geographical analysis indicates significant market opportunities in North America and Asia-Pacific, owing to substantial investments in telecommunications infrastructure and technological advancements in these regions. Future growth will likely depend on the continued development of more efficient, cost-effective, and higher-performance VCAs tailored to emerging applications in areas like autonomous driving and IoT.
Voltage Controlled Attenuators Company Market Share
Voltage Controlled Attenuators Market Report: 2019-2033
This comprehensive report provides a detailed analysis of the Voltage Controlled Attenuators (VCAs) market, encompassing market dynamics, growth trends, regional insights, product landscapes, and key player strategies. The study period covers 2019-2033, with 2025 as the base and estimated year. The forecast period spans 2025-2033, and the historical period covers 2019-2024. This report is crucial for industry professionals, investors, and anyone seeking a deep understanding of this dynamic market segment within the broader RF and Microwave components industry. The market is projected to reach xx million units by 2033.
Voltage Controlled Attenuators Market Dynamics & Structure
The Voltage Controlled Attenuator market is characterized by moderate concentration, with key players holding significant market share. Technological innovation, driven by advancements in semiconductor technology and miniaturization, is a major driver. Stringent regulatory compliance and safety standards significantly impact market operations. Competition from alternative technologies, such as digital attenuators, poses a challenge. The end-user demographics are diverse, spanning telecommunications, aerospace & defense, and industrial automation. M&A activity has been moderate, with several strategic acquisitions aiming to enhance product portfolios and expand market reach.
- Market Concentration: Moderately concentrated, with top 5 players holding approximately 55% market share in 2024.
- Technological Innovation: Focus on higher linearity, wider bandwidth, and lower power consumption.
- Regulatory Frameworks: Compliance with international standards like RoHS and REACH.
- Competitive Substitutes: Digital attenuators and other programmable attenuation technologies.
- End-User Demographics: Telecommunications (40%), Aerospace & Defense (30%), Industrial Automation (20%), Others (10%).
- M&A Trends: xx M&A deals recorded between 2019-2024, with an average deal size of xx million USD.
Voltage Controlled Attenuators Growth Trends & Insights
The VCA market experienced steady growth during the historical period (2019-2024), driven by increasing demand from the telecommunications and aerospace & defense sectors. The market size expanded from xx million units in 2019 to xx million units in 2024, registering a CAGR of xx%. Technological advancements, such as the integration of advanced semiconductor processes and improved performance metrics, fueled adoption rates. Consumer behavior shifts towards higher performance and smaller form factors are influencing product design and development. The forecast period (2025-2033) projects continued growth, with a projected CAGR of xx%, reaching xx million units by 2033. Market penetration in emerging economies is expected to drive substantial growth.
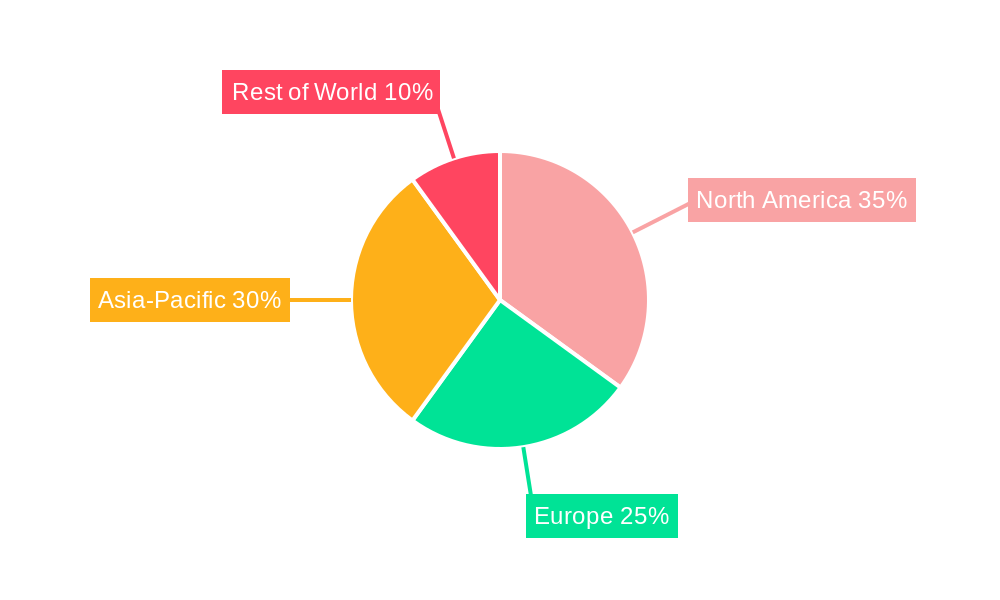
Dominant Regions, Countries, or Segments in Voltage Controlled Attenuators
North America currently holds the largest market share in the VCA market, driven by strong demand from the aerospace & defense and telecommunications industries. This dominance is attributed to robust infrastructure, technological advancements, and the presence of major market players. Asia-Pacific is projected to experience the highest growth rate during the forecast period, fuelled by rapid industrialization, expanding telecommunication networks, and increasing government investments in infrastructure development. Europe maintains a stable market share, driven by strong technological capabilities and a well-established industrial base.
- North America: Strong demand from aerospace & defense, robust R&D investments.
- Asia-Pacific: Rapid industrialization, expanding telecommunications infrastructure, and cost-effective manufacturing.
- Europe: Technological advancements, strong industrial base, and favorable government policies.
Voltage Controlled Attenuators Product Landscape
VCAs are available in various configurations, including single-stage and multi-stage designs, offering different attenuation ranges, linearity, and power handling capabilities. Recent innovations focus on improving dynamic range, reducing insertion loss, and integrating functionalities such as switches and amplifiers. These advancements enable greater flexibility and improved performance in various applications. Key selling propositions include high accuracy, low distortion, and compact size.
Key Drivers, Barriers & Challenges in Voltage Controlled Attenuators
Key Drivers:
- Increasing demand from 5G infrastructure deployments
- Growing adoption in high-frequency applications
- Advancements in semiconductor technology enabling improved performance and miniaturization
Challenges & Restraints:
- Intense competition from alternative technologies
- Supply chain disruptions impacting component availability
- Stringent regulatory compliance requirements leading to increased costs.
Emerging Opportunities in Voltage Controlled Attenuators
Emerging opportunities include the growing demand for VCAs in high-frequency applications like 5G and satellite communications, the development of miniaturized and highly integrated VCAs for space-constrained applications, and the exploration of new materials and technologies for improved performance and cost-effectiveness.
Growth Accelerators in the Voltage Controlled Attenuators Industry
Technological breakthroughs in semiconductor technology are driving miniaturization, improved performance, and reduced costs. Strategic partnerships and collaborations between component manufacturers and system integrators are accelerating product development and market adoption. Expansion into emerging markets with growing infrastructure development further fuels market growth.
Key Players Shaping the Voltage Controlled Attenuators Market
- Analog Devices
- Qorvo
- Macom
- Fairchild Semiconductor
- NXP
- Teledyne Microwave Solutions
- Microsemiconductor
- DAICO
- NEC Corporation
- GT Microwave
Notable Milestones in Voltage Controlled Attenuators Sector
- 2020: Introduction of a new VCA with improved linearity by Analog Devices.
- 2021: Acquisition of a smaller VCA manufacturer by Qorvo.
- 2022: Launch of a high-frequency VCA by Macom.
- 2023: Development of a new packaging technology for miniaturized VCAs.
- 2024: Introduction of a cost-effective VCA for the industrial market segment.
In-Depth Voltage Controlled Attenuators Market Outlook
The future of the VCA market looks promising, driven by the sustained growth of the telecommunications and aerospace & defense sectors. Technological advancements, strategic partnerships, and expansion into new applications will further propel market growth. Companies focusing on innovation, cost optimization, and efficient supply chain management will be well-positioned to capitalize on the significant opportunities available in this dynamic market.
Voltage Controlled Attenuators Segmentation
-
1. Application
- 1.1. Automotive
- 1.2. Cellular Infrastructure
- 1.3. Radar Systems
- 1.4. Satellite Radios
- 1.5. Test Equipment
- 1.6. Others
-
2. Type
- 2.1. Digital Voltage Controlled Attenuators
- 2.2. Analog Voltage Controlled Attenuators
Voltage Controlled Attenuators Segmentation By Geography
-
1. North America
- 1.1. United States
- 1.2. Canada
- 1.3. Mexico
-
2. South America
- 2.1. Brazil
- 2.2. Argentina
- 2.3. Rest of South America
-
3. Europe
- 3.1. United Kingdom
- 3.2. Germany
- 3.3. France
- 3.4. Italy
- 3.5. Spain
- 3.6. Russia
- 3.7. Benelux
- 3.8. Nordics
- 3.9. Rest of Europe
-
4. Middle East & Africa
- 4.1. Turkey
- 4.2. Israel
- 4.3. GCC
- 4.4. North Africa
- 4.5. South Africa
- 4.6. Rest of Middle East & Africa
-
5. Asia Pacific
- 5.1. China
- 5.2. India
- 5.3. Japan
- 5.4. South Korea
- 5.5. ASEAN
- 5.6. Oceania
- 5.7. Rest of Asia Pacific
Voltage Controlled Attenuators Regional Market Share
Geographic Coverage of Voltage Controlled Attenuators
Voltage Controlled Attenuators REPORT HIGHLIGHTS
| Aspects | Details |
|---|---|
| Study Period | 2020-2034 |
| Base Year | 2025 |
| Estimated Year | 2026 |
| Forecast Period | 2026-2034 |
| Historical Period | 2020-2025 |
| Growth Rate | CAGR of 6.5% from 2020-2034 |
| Segmentation |
|
Table of Contents
- 1. Introduction
- 1.1. Research Scope
- 1.2. Market Segmentation
- 1.3. Research Objective
- 1.4. Definitions and Assumptions
- 2. Executive Summary
- 2.1. Market Snapshot
- 3. Market Dynamics
- 3.1. Market Drivers
- 3.2. Market Restrains
- 3.3. Market Trends
- 3.4. Market Opportunities
- 4. Market Factor Analysis
- 4.1. Porters Five Forces
- 4.1.1. Bargaining Power of Suppliers
- 4.1.2. Bargaining Power of Buyers
- 4.1.3. Threat of New Entrants
- 4.1.4. Threat of Substitutes
- 4.1.5. Competitive Rivalry
- 4.2. PESTEL analysis
- 4.3. BCG Analysis
- 4.3.1. Stars (High Growth, High Market Share)
- 4.3.2. Cash Cows (Low Growth, High Market Share)
- 4.3.3. Question Mark (High Growth, Low Market Share)
- 4.3.4. Dogs (Low Growth, Low Market Share)
- 4.4. Ansoff Matrix Analysis
- 4.5. Supply Chain Analysis
- 4.6. Regulatory Landscape
- 4.7. Current Market Potential and Opportunity Assessment (TAM–SAM–SOM Framework)
- 4.8. IMR Analyst Note
- 4.1. Porters Five Forces
- 5. Market Analysis, Insights and Forecast 2021-2033
- 5.1. Market Analysis, Insights and Forecast - by Application
- 5.1.1. Automotive
- 5.1.2. Cellular Infrastructure
- 5.1.3. Radar Systems
- 5.1.4. Satellite Radios
- 5.1.5. Test Equipment
- 5.1.6. Others
- 5.2. Market Analysis, Insights and Forecast - by Type
- 5.2.1. Digital Voltage Controlled Attenuators
- 5.2.2. Analog Voltage Controlled Attenuators
- 5.3. Market Analysis, Insights and Forecast - by Region
- 5.3.1. North America
- 5.3.2. South America
- 5.3.3. Europe
- 5.3.4. Middle East & Africa
- 5.3.5. Asia Pacific
- 5.1. Market Analysis, Insights and Forecast - by Application
- 6. Global Voltage Controlled Attenuators Analysis, Insights and Forecast, 2021-2033
- 6.1. Market Analysis, Insights and Forecast - by Application
- 6.1.1. Automotive
- 6.1.2. Cellular Infrastructure
- 6.1.3. Radar Systems
- 6.1.4. Satellite Radios
- 6.1.5. Test Equipment
- 6.1.6. Others
- 6.2. Market Analysis, Insights and Forecast - by Type
- 6.2.1. Digital Voltage Controlled Attenuators
- 6.2.2. Analog Voltage Controlled Attenuators
- 6.1. Market Analysis, Insights and Forecast - by Application
- 7. North America Voltage Controlled Attenuators Analysis, Insights and Forecast, 2020-2032
- 7.1. Market Analysis, Insights and Forecast - by Application
- 7.1.1. Automotive
- 7.1.2. Cellular Infrastructure
- 7.1.3. Radar Systems
- 7.1.4. Satellite Radios
- 7.1.5. Test Equipment
- 7.1.6. Others
- 7.2. Market Analysis, Insights and Forecast - by Type
- 7.2.1. Digital Voltage Controlled Attenuators
- 7.2.2. Analog Voltage Controlled Attenuators
- 7.1. Market Analysis, Insights and Forecast - by Application
- 8. South America Voltage Controlled Attenuators Analysis, Insights and Forecast, 2020-2032
- 8.1. Market Analysis, Insights and Forecast - by Application
- 8.1.1. Automotive
- 8.1.2. Cellular Infrastructure
- 8.1.3. Radar Systems
- 8.1.4. Satellite Radios
- 8.1.5. Test Equipment
- 8.1.6. Others
- 8.2. Market Analysis, Insights and Forecast - by Type
- 8.2.1. Digital Voltage Controlled Attenuators
- 8.2.2. Analog Voltage Controlled Attenuators
- 8.1. Market Analysis, Insights and Forecast - by Application
- 9. Europe Voltage Controlled Attenuators Analysis, Insights and Forecast, 2020-2032
- 9.1. Market Analysis, Insights and Forecast - by Application
- 9.1.1. Automotive
- 9.1.2. Cellular Infrastructure
- 9.1.3. Radar Systems
- 9.1.4. Satellite Radios
- 9.1.5. Test Equipment
- 9.1.6. Others
- 9.2. Market Analysis, Insights and Forecast - by Type
- 9.2.1. Digital Voltage Controlled Attenuators
- 9.2.2. Analog Voltage Controlled Attenuators
- 9.1. Market Analysis, Insights and Forecast - by Application
- 10. Middle East & Africa Voltage Controlled Attenuators Analysis, Insights and Forecast, 2020-2032
- 10.1. Market Analysis, Insights and Forecast - by Application
- 10.1.1. Automotive
- 10.1.2. Cellular Infrastructure
- 10.1.3. Radar Systems
- 10.1.4. Satellite Radios
- 10.1.5. Test Equipment
- 10.1.6. Others
- 10.2. Market Analysis, Insights and Forecast - by Type
- 10.2.1. Digital Voltage Controlled Attenuators
- 10.2.2. Analog Voltage Controlled Attenuators
- 10.1. Market Analysis, Insights and Forecast - by Application
- 11. Asia Pacific Voltage Controlled Attenuators Analysis, Insights and Forecast, 2020-2032
- 11.1. Market Analysis, Insights and Forecast - by Application
- 11.1.1. Automotive
- 11.1.2. Cellular Infrastructure
- 11.1.3. Radar Systems
- 11.1.4. Satellite Radios
- 11.1.5. Test Equipment
- 11.1.6. Others
- 11.2. Market Analysis, Insights and Forecast - by Type
- 11.2.1. Digital Voltage Controlled Attenuators
- 11.2.2. Analog Voltage Controlled Attenuators
- 11.1. Market Analysis, Insights and Forecast - by Application
- 12. Competitive Analysis
- 12.1. Company Profiles
- 12.1.1 Analog Devices
- 12.1.1.1. Company Overview
- 12.1.1.2. Products
- 12.1.1.3. Company Financials
- 12.1.1.4. SWOT Analysis
- 12.1.2 Qorvo
- 12.1.2.1. Company Overview
- 12.1.2.2. Products
- 12.1.2.3. Company Financials
- 12.1.2.4. SWOT Analysis
- 12.1.3 Macom
- 12.1.3.1. Company Overview
- 12.1.3.2. Products
- 12.1.3.3. Company Financials
- 12.1.3.4. SWOT Analysis
- 12.1.4 Fairchild Semiconductor
- 12.1.4.1. Company Overview
- 12.1.4.2. Products
- 12.1.4.3. Company Financials
- 12.1.4.4. SWOT Analysis
- 12.1.5 NXP
- 12.1.5.1. Company Overview
- 12.1.5.2. Products
- 12.1.5.3. Company Financials
- 12.1.5.4. SWOT Analysis
- 12.1.6 Teledyne Microwave Solutions
- 12.1.6.1. Company Overview
- 12.1.6.2. Products
- 12.1.6.3. Company Financials
- 12.1.6.4. SWOT Analysis
- 12.1.7 Microsemiconductor
- 12.1.7.1. Company Overview
- 12.1.7.2. Products
- 12.1.7.3. Company Financials
- 12.1.7.4. SWOT Analysis
- 12.1.8 DAICO
- 12.1.8.1. Company Overview
- 12.1.8.2. Products
- 12.1.8.3. Company Financials
- 12.1.8.4. SWOT Analysis
- 12.1.9 NEC Corporation
- 12.1.9.1. Company Overview
- 12.1.9.2. Products
- 12.1.9.3. Company Financials
- 12.1.9.4. SWOT Analysis
- 12.1.10 GT Microwave
- 12.1.10.1. Company Overview
- 12.1.10.2. Products
- 12.1.10.3. Company Financials
- 12.1.10.4. SWOT Analysis
- 12.1.1 Analog Devices
- 12.2. Market Entropy
- 12.2.1 Company's Key Areas Served
- 12.2.2 Recent Developments
- 12.3. Company Market Share Analysis 2025
- 12.3.1 Top 5 Companies Market Share Analysis
- 12.3.2 Top 3 Companies Market Share Analysis
- 12.4. List of Potential Customers
- 13. Research Methodology
List of Figures
- Figure 1: Global Voltage Controlled Attenuators Revenue Breakdown (undefined, %) by Region 2025 & 2033
- Figure 2: North America Voltage Controlled Attenuators Revenue (undefined), by Application 2025 & 2033
- Figure 3: North America Voltage Controlled Attenuators Revenue Share (%), by Application 2025 & 2033
- Figure 4: North America Voltage Controlled Attenuators Revenue (undefined), by Type 2025 & 2033
- Figure 5: North America Voltage Controlled Attenuators Revenue Share (%), by Type 2025 & 2033
- Figure 6: North America Voltage Controlled Attenuators Revenue (undefined), by Country 2025 & 2033
- Figure 7: North America Voltage Controlled Attenuators Revenue Share (%), by Country 2025 & 2033
- Figure 8: South America Voltage Controlled Attenuators Revenue (undefined), by Application 2025 & 2033
- Figure 9: South America Voltage Controlled Attenuators Revenue Share (%), by Application 2025 & 2033
- Figure 10: South America Voltage Controlled Attenuators Revenue (undefined), by Type 2025 & 2033
- Figure 11: South America Voltage Controlled Attenuators Revenue Share (%), by Type 2025 & 2033
- Figure 12: South America Voltage Controlled Attenuators Revenue (undefined), by Country 2025 & 2033
- Figure 13: South America Voltage Controlled Attenuators Revenue Share (%), by Country 2025 & 2033
- Figure 14: Europe Voltage Controlled Attenuators Revenue (undefined), by Application 2025 & 2033
- Figure 15: Europe Voltage Controlled Attenuators Revenue Share (%), by Application 2025 & 2033
- Figure 16: Europe Voltage Controlled Attenuators Revenue (undefined), by Type 2025 & 2033
- Figure 17: Europe Voltage Controlled Attenuators Revenue Share (%), by Type 2025 & 2033
- Figure 18: Europe Voltage Controlled Attenuators Revenue (undefined), by Country 2025 & 2033
- Figure 19: Europe Voltage Controlled Attenuators Revenue Share (%), by Country 2025 & 2033
- Figure 20: Middle East & Africa Voltage Controlled Attenuators Revenue (undefined), by Application 2025 & 2033
- Figure 21: Middle East & Africa Voltage Controlled Attenuators Revenue Share (%), by Application 2025 & 2033
- Figure 22: Middle East & Africa Voltage Controlled Attenuators Revenue (undefined), by Type 2025 & 2033
- Figure 23: Middle East & Africa Voltage Controlled Attenuators Revenue Share (%), by Type 2025 & 2033
- Figure 24: Middle East & Africa Voltage Controlled Attenuators Revenue (undefined), by Country 2025 & 2033
- Figure 25: Middle East & Africa Voltage Controlled Attenuators Revenue Share (%), by Country 2025 & 2033
- Figure 26: Asia Pacific Voltage Controlled Attenuators Revenue (undefined), by Application 2025 & 2033
- Figure 27: Asia Pacific Voltage Controlled Attenuators Revenue Share (%), by Application 2025 & 2033
- Figure 28: Asia Pacific Voltage Controlled Attenuators Revenue (undefined), by Type 2025 & 2033
- Figure 29: Asia Pacific Voltage Controlled Attenuators Revenue Share (%), by Type 2025 & 2033
- Figure 30: Asia Pacific Voltage Controlled Attenuators Revenue (undefined), by Country 2025 & 2033
- Figure 31: Asia Pacific Voltage Controlled Attenuators Revenue Share (%), by Country 2025 & 2033
List of Tables
- Table 1: Global Voltage Controlled Attenuators Revenue undefined Forecast, by Application 2020 & 2033
- Table 2: Global Voltage Controlled Attenuators Revenue undefined Forecast, by Type 2020 & 2033
- Table 3: Global Voltage Controlled Attenuators Revenue undefined Forecast, by Region 2020 & 2033
- Table 4: Global Voltage Controlled Attenuators Revenue undefined Forecast, by Application 2020 & 2033
- Table 5: Global Voltage Controlled Attenuators Revenue undefined Forecast, by Type 2020 & 2033
- Table 6: Global Voltage Controlled Attenuators Revenue undefined Forecast, by Country 2020 & 2033
- Table 7: United States Voltage Controlled Attenuators Revenue (undefined) Forecast, by Application 2020 & 2033
- Table 8: Canada Voltage Controlled Attenuators Revenue (undefined) Forecast, by Application 2020 & 2033
- Table 9: Mexico Voltage Controlled Attenuators Revenue (undefined) Forecast, by Application 2020 & 2033
- Table 10: Global Voltage Controlled Attenuators Revenue undefined Forecast, by Application 2020 & 2033
- Table 11: Global Voltage Controlled Attenuators Revenue undefined Forecast, by Type 2020 & 2033
- Table 12: Global Voltage Controlled Attenuators Revenue undefined Forecast, by Country 2020 & 2033
- Table 13: Brazil Voltage Controlled Attenuators Revenue (undefined) Forecast, by Application 2020 & 2033
- Table 14: Argentina Voltage Controlled Attenuators Revenue (undefined) Forecast, by Application 2020 & 2033
- Table 15: Rest of South America Voltage Controlled Attenuators Revenue (undefined) Forecast, by Application 2020 & 2033
- Table 16: Global Voltage Controlled Attenuators Revenue undefined Forecast, by Application 2020 & 2033
- Table 17: Global Voltage Controlled Attenuators Revenue undefined Forecast, by Type 2020 & 2033
- Table 18: Global Voltage Controlled Attenuators Revenue undefined Forecast, by Country 2020 & 2033
- Table 19: United Kingdom Voltage Controlled Attenuators Revenue (undefined) Forecast, by Application 2020 & 2033
- Table 20: Germany Voltage Controlled Attenuators Revenue (undefined) Forecast, by Application 2020 & 2033
- Table 21: France Voltage Controlled Attenuators Revenue (undefined) Forecast, by Application 2020 & 2033
- Table 22: Italy Voltage Controlled Attenuators Revenue (undefined) Forecast, by Application 2020 & 2033
- Table 23: Spain Voltage Controlled Attenuators Revenue (undefined) Forecast, by Application 2020 & 2033
- Table 24: Russia Voltage Controlled Attenuators Revenue (undefined) Forecast, by Application 2020 & 2033
- Table 25: Benelux Voltage Controlled Attenuators Revenue (undefined) Forecast, by Application 2020 & 2033
- Table 26: Nordics Voltage Controlled Attenuators Revenue (undefined) Forecast, by Application 2020 & 2033
- Table 27: Rest of Europe Voltage Controlled Attenuators Revenue (undefined) Forecast, by Application 2020 & 2033
- Table 28: Global Voltage Controlled Attenuators Revenue undefined Forecast, by Application 2020 & 2033
- Table 29: Global Voltage Controlled Attenuators Revenue undefined Forecast, by Type 2020 & 2033
- Table 30: Global Voltage Controlled Attenuators Revenue undefined Forecast, by Country 2020 & 2033
- Table 31: Turkey Voltage Controlled Attenuators Revenue (undefined) Forecast, by Application 2020 & 2033
- Table 32: Israel Voltage Controlled Attenuators Revenue (undefined) Forecast, by Application 2020 & 2033
- Table 33: GCC Voltage Controlled Attenuators Revenue (undefined) Forecast, by Application 2020 & 2033
- Table 34: North Africa Voltage Controlled Attenuators Revenue (undefined) Forecast, by Application 2020 & 2033
- Table 35: South Africa Voltage Controlled Attenuators Revenue (undefined) Forecast, by Application 2020 & 2033
- Table 36: Rest of Middle East & Africa Voltage Controlled Attenuators Revenue (undefined) Forecast, by Application 2020 & 2033
- Table 37: Global Voltage Controlled Attenuators Revenue undefined Forecast, by Application 2020 & 2033
- Table 38: Global Voltage Controlled Attenuators Revenue undefined Forecast, by Type 2020 & 2033
- Table 39: Global Voltage Controlled Attenuators Revenue undefined Forecast, by Country 2020 & 2033
- Table 40: China Voltage Controlled Attenuators Revenue (undefined) Forecast, by Application 2020 & 2033
- Table 41: India Voltage Controlled Attenuators Revenue (undefined) Forecast, by Application 2020 & 2033
- Table 42: Japan Voltage Controlled Attenuators Revenue (undefined) Forecast, by Application 2020 & 2033
- Table 43: South Korea Voltage Controlled Attenuators Revenue (undefined) Forecast, by Application 2020 & 2033
- Table 44: ASEAN Voltage Controlled Attenuators Revenue (undefined) Forecast, by Application 2020 & 2033
- Table 45: Oceania Voltage Controlled Attenuators Revenue (undefined) Forecast, by Application 2020 & 2033
- Table 46: Rest of Asia Pacific Voltage Controlled Attenuators Revenue (undefined) Forecast, by Application 2020 & 2033
Frequently Asked Questions
1. What is the projected Compound Annual Growth Rate (CAGR) of the Voltage Controlled Attenuators?
The projected CAGR is approximately 6.5%.
2. Which companies are prominent players in the Voltage Controlled Attenuators?
Key companies in the market include Analog Devices, Qorvo, Macom, Fairchild Semiconductor, NXP, Teledyne Microwave Solutions, Microsemiconductor, DAICO, NEC Corporation, GT Microwave.
3. What are the main segments of the Voltage Controlled Attenuators?
The market segments include Application, Type.
4. Can you provide details about the market size?
The market size is estimated to be USD XXX N/A as of 2022.
5. What are some drivers contributing to market growth?
N/A
6. What are the notable trends driving market growth?
N/A
7. Are there any restraints impacting market growth?
N/A
8. Can you provide examples of recent developments in the market?
N/A
9. What pricing options are available for accessing the report?
Pricing options include single-user, multi-user, and enterprise licenses priced at USD 2900.00, USD 4350.00, and USD 5800.00 respectively.
10. Is the market size provided in terms of value or volume?
The market size is provided in terms of value, measured in N/A.
11. Are there any specific market keywords associated with the report?
Yes, the market keyword associated with the report is "Voltage Controlled Attenuators," which aids in identifying and referencing the specific market segment covered.
12. How do I determine which pricing option suits my needs best?
The pricing options vary based on user requirements and access needs. Individual users may opt for single-user licenses, while businesses requiring broader access may choose multi-user or enterprise licenses for cost-effective access to the report.
13. Are there any additional resources or data provided in the Voltage Controlled Attenuators report?
While the report offers comprehensive insights, it's advisable to review the specific contents or supplementary materials provided to ascertain if additional resources or data are available.
14. How can I stay updated on further developments or reports in the Voltage Controlled Attenuators?
To stay informed about further developments, trends, and reports in the Voltage Controlled Attenuators, consider subscribing to industry newsletters, following relevant companies and organizations, or regularly checking reputable industry news sources and publications.
Methodology
Step 1 - Identification of Relevant Samples Size from Population Database


Step 2 - Approaches for Defining Global Market Size (Value, Volume* & Price*)

Note*: In applicable scenarios
Step 3 - Data Sources
Primary Research
- Web Analytics
- Survey Reports
- Research Institute
- Latest Research Reports
- Opinion Leaders
Secondary Research
- Annual Reports
- White Paper
- Latest Press Release
- Industry Association
- Paid Database
- Investor Presentations

Step 4 - Data Triangulation
Involves using different sources of information in order to increase the validity of a study
These sources are likely to be stakeholders in a program - participants, other researchers, program staff, other community members, and so on.
Then we put all data in single framework & apply various statistical tools to find out the dynamic on the market.
During the analysis stage, feedback from the stakeholder groups would be compared to determine areas of agreement as well as areas of divergence