

Key Insights
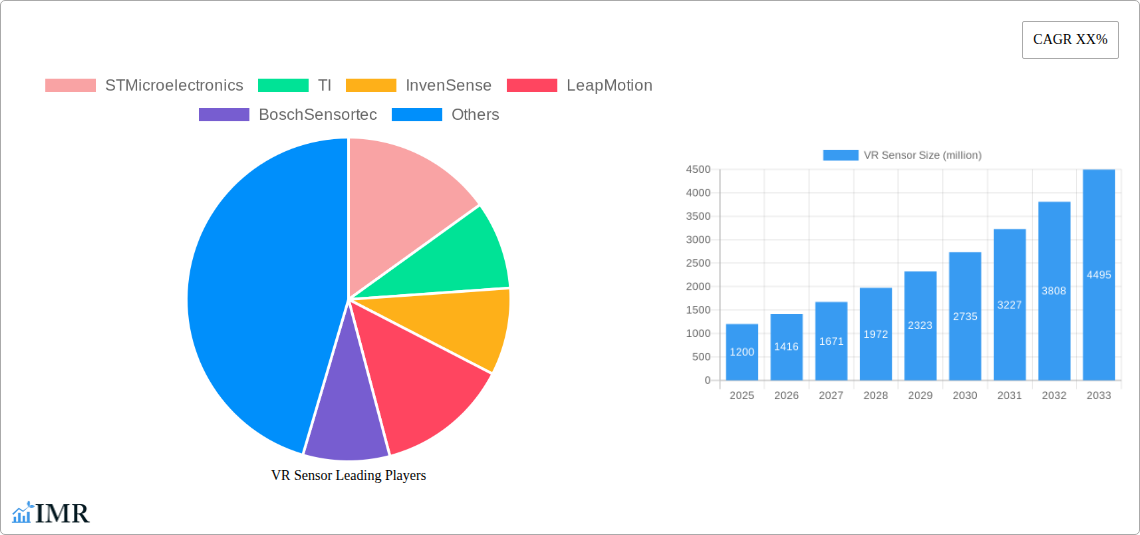
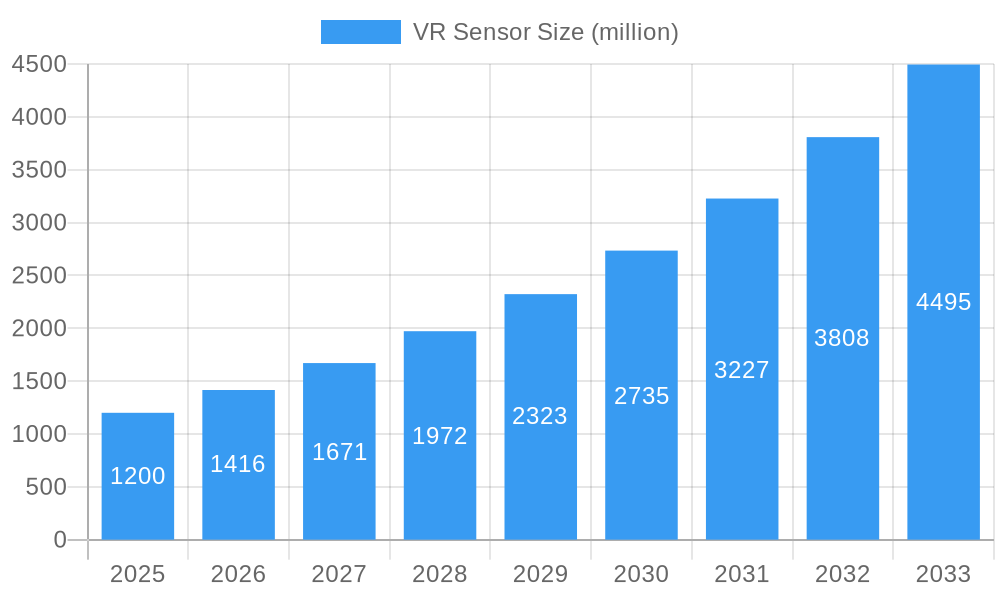
The global VR sensor market is poised for significant expansion, driven by the burgeoning virtual reality ecosystem and its integration across diverse sectors. With an estimated market size of approximately USD 1,200 million and a projected Compound Annual Growth Rate (CAGR) of around 18% over the forecast period (2025-2033), this market is set to witness robust growth. Key drivers include the increasing adoption of VR headsets for gaming, entertainment, and professional training, coupled with advancements in sensor technology that enhance immersion and interactivity. The demand for sophisticated sensors like accelerometers, gyroscopes, and magnetometers is escalating as manufacturers strive to deliver more accurate, responsive, and lag-free VR experiences. Furthermore, the growing interest in augmented reality (AR) applications also contributes to the overall demand for these sensing technologies.
VR Sensor Market Size (In Billion)
The market's growth trajectory is further fueled by emerging trends such as the development of more compact and power-efficient sensors, enabling lighter and more comfortable VR hardware. The increasing capabilities of VR platforms like PlayStation VR and dedicated VR headsets are creating a fertile ground for sensor innovation. While the market enjoys strong growth, potential restraints include the high cost of advanced VR systems, which can limit mass adoption, and the ongoing need for standardization in VR sensor interfaces and data processing. However, the strategic presence of key players like STMicroelectronics, Texas Instruments, and InvenSense, alongside the rapid development in regions like North America and Asia Pacific, particularly China and Japan, indicates a dynamic and promising future for the VR sensor market, with applications expanding beyond gaming into areas like healthcare simulation, architectural visualization, and remote collaboration.
VR Sensor Company Market Share
VR Sensor Market Report: Unlocking Immersive Experiences (2019-2033)
This comprehensive report offers an in-depth analysis of the global VR Sensor market, encompassing its dynamics, growth trends, regional dominance, product landscape, key drivers, challenges, emerging opportunities, and the influential players shaping its future. With a study period from 2019 to 2033, and a base and estimated year of 2025, this report provides critical insights for industry professionals seeking to navigate the rapidly evolving virtual reality sensor ecosystem. We leverage advanced market intelligence to deliver actionable data, presented in millions of units for key quantitative metrics.
VR Sensor Market Dynamics & Structure
The VR Sensor market exhibits a moderate to high degree of concentration, driven by a few key players and specialized component manufacturers. Technological innovation remains the paramount driver, with continuous advancements in sensor accuracy, miniaturization, power efficiency, and haptic feedback capabilities pushing the boundaries of immersive experiences. Regulatory frameworks, while still nascent in some regions concerning data privacy and safety standards for VR devices, are gradually taking shape, influencing product development and market entry. Competitive product substitutes are emerging, particularly from advancements in AI-driven gesture recognition and eye-tracking technologies, which can supplement or, in some applications, reduce the reliance on traditional motion sensors. End-user demographics are broadening beyond hardcore gamers to include enterprise users for training, simulation, and remote collaboration, as well as consumers for entertainment and social VR. Mergers and acquisitions (M&A) trends are notable, with larger technology firms acquiring promising sensor startups to bolster their VR capabilities and secure intellectual property.
- Market Concentration: Dominated by key sensor manufacturers and integrated VR headset providers.
- Technological Innovation: Driven by demand for higher fidelity, lower latency, and enhanced user interaction.
- Regulatory Influence: Growing focus on data privacy, safety, and interoperability standards.
- Competitive Landscape: Emerging AI-driven alternatives and advancements in alternative sensing modalities.
- End-User Expansion: Beyond gaming to enterprise, education, healthcare, and social applications.
- M&A Activity: Strategic acquisitions to gain technological expertise and market share.
VR Sensor Growth Trends & Insights
The VR Sensor market is poised for significant expansion, driven by increasing adoption of virtual reality technology across various sectors. Market size is projected to witness a robust Compound Annual Growth Rate (CAGR) of xx% from 2025 to 2033. The adoption rate of VR headsets, a primary application for VR sensors, is escalating as device costs decrease and the content library diversifies. Technological disruptions, such as the development of more sophisticated optical sensors, advanced inertial measurement units (IMUs), and novel biometric sensors, are enhancing the realism and interactivity of VR experiences. Consumer behavior shifts are characterized by a growing demand for more immersive and engaging entertainment, as well as an increasing willingness to utilize VR for productivity and social interaction. The market penetration of VR sensors is expected to surge, reaching xx% of the total VR device market by 2033. The evolution of wearable technology and the potential integration of VR sensors into augmented reality (AR) devices further fuel this growth trajectory. The increasing investment from major tech corporations in VR development and the growing ecosystem of VR content creators are critical enablers of this market's upward momentum. Furthermore, advancements in sensor fusion algorithms are improving the accuracy and responsiveness of VR tracking systems, leading to more seamless and intuitive user experiences.
Dominant Regions, Countries, or Segments in VR Sensor
North America currently holds a dominant position in the VR Sensor market, driven by its early adoption of VR technology, significant investment in research and development, and the presence of major VR hardware manufacturers. The United States, in particular, leads in terms of market share and growth potential. The application segment of VR Headsets is the primary driver of this dominance, accounting for an estimated xx% of the total VR Sensor market value in 2025. This is closely followed by the VR Playstation segment, benefiting from the popularity of Sony's gaming console and its integrated VR offerings.
- Key Drivers in North America:
- High disposable income and consumer willingness to adopt new technologies.
- Strong presence of leading VR technology companies and startups.
- Robust gaming industry and a large base of avid gamers.
- Significant government and private investment in AR/VR research and development.
- Increasing enterprise adoption for training, simulation, and design.
The types of sensors contributing most significantly to market growth in this region are Accelerometer Sensors and Gyroscope Sensors, which are fundamental for motion tracking in VR headsets and controllers. Magnetometer sensors also play a crucial role in orientation tracking, complementing the data from accelerometers and gyroscopes. The "Others" category, which includes advanced optical sensors, depth sensors, and even eye-tracking modules, is also experiencing rapid growth as manufacturers seek to enhance immersion and user interaction.
Beyond North America, Asia-Pacific is emerging as a critical growth region, fueled by a rapidly expanding middle class, increasing smartphone penetration, and a burgeoning gaming market. Countries like China and South Korea are making substantial strides in VR hardware manufacturing and content development, contributing to a significant surge in VR Sensor demand. Europe also represents a substantial market, with strong consumer interest and a growing number of enterprise applications for VR.
VR Sensor Product Landscape
The VR Sensor product landscape is characterized by continuous innovation aimed at delivering more precise, responsive, and compact sensing solutions. Key product innovations include the development of low-power, high-resolution accelerometers and gyroscopes for enhanced motion tracking, enabling more realistic avatar movements and interaction within virtual environments. Magnetometers are being refined for improved magnetic field sensing, crucial for absolute orientation and reducing drift. Beyond traditional IMUs, advancements in optical sensors, such as LiDAR and time-of-flight sensors, are improving spatial mapping and depth perception within VR. The integration of these sensors into smaller, more ergonomic form factors is also a significant trend, leading to lighter and more comfortable VR headsets.
Key Drivers, Barriers & Challenges in VR Sensor
Key Drivers:
- Technological Advancements: Miniaturization, improved accuracy, lower power consumption, and enhanced sensor fusion capabilities.
- Growing VR Ecosystem: Increased availability of VR content, games, and enterprise applications.
- Declining VR Hardware Costs: Making VR more accessible to a broader consumer base.
- Enterprise Adoption: Use in training, simulation, design, and remote collaboration.
- Consumer Demand for Immersive Entertainment: Driving adoption of VR for gaming and virtual experiences.
Barriers & Challenges:
- High Cost of Advanced Sensors: Early adoption of cutting-edge sensors can be prohibitively expensive for some manufacturers.
- Motion Sickness and User Discomfort: Remains a barrier to prolonged VR usage for a segment of the population.
- Lack of Standardization: Interoperability issues between different VR platforms and sensor technologies can hinder widespread adoption.
- Supply Chain Disruptions: Geopolitical events and manufacturing complexities can impact sensor availability and pricing.
- Regulatory Uncertainty: Evolving data privacy and safety regulations may introduce compliance challenges.
- Competitive Pressures: Intense competition among sensor manufacturers and VR hardware providers can affect profit margins.
Emerging Opportunities in VR Sensor
Emerging opportunities in the VR Sensor market lie in the untapped potential of haptic feedback integration, enabling users to "feel" virtual objects and environments. The development of highly sensitive and nuanced haptic sensors will be crucial for creating truly immersive experiences. Another significant opportunity is the application of VR sensors in the medical field for rehabilitation, surgical training, and diagnostic tools, where precise motion tracking and sensory feedback are paramount. Furthermore, the convergence of VR and AI, particularly in areas like natural language processing and emotional recognition through biosensors, opens new avenues for more intuitive and personalized VR interactions. The growth of the metaverse concept also presents a vast, long-term opportunity for advanced VR sensors to power diverse virtual experiences and economies.
Growth Accelerators in the VR Sensor Industry
The VR Sensor industry's growth is being significantly accelerated by strategic partnerships between sensor manufacturers and leading VR headset developers, ensuring seamless integration and optimized performance. Technological breakthroughs in materials science are enabling the creation of more durable and flexible sensors, paving the way for novel wearable VR devices. Market expansion strategies, particularly into emerging economies with rapidly growing consumer markets, are also acting as powerful growth catalysts. The continuous refinement of sensor fusion algorithms, allowing for the combination of data from multiple sensor types for superior accuracy and responsiveness, is a critical factor in enhancing user experience and driving wider adoption.
Key Players Shaping the VR Sensor Market
- STMicroelectronics
- TI
- InvenSense
- LeapMotion
- Bosch Sensortec
- PrimeSense
- PS Move
- Kinect
- Vii
Notable Milestones in VR Sensor Sector
- 2019: Introduction of advanced IMUs with improved noise reduction and power efficiency in consumer VR headsets.
- 2020: Significant advancements in optical tracking technology, enhancing positional accuracy and reducing reliance on external sensors.
- 2021: Leap Motion's acquisition by Ultraleap signals increased focus on hand-tracking technology for VR and AR.
- 2022: Growing adoption of depth sensors and LiDAR in VR headsets for better environmental mapping and occlusion handling.
- 2023: Increased integration of biometric sensors (e.g., heart rate, galvanic skin response) into VR devices to personalize experiences and gather user data.
- 2024: Further miniaturization and cost reduction of high-performance sensors, making VR more accessible.
- 2025 (Projected): Enhanced sensor fusion algorithms offering near-perfect motion tracking and reducing latency to imperceptible levels.
- 2026-2033 (Projected): Widespread integration of advanced haptic feedback sensors and sophisticated AI-driven gesture recognition systems.
In-Depth VR Sensor Market Outlook
The future outlook for the VR Sensor market is exceptionally promising, driven by sustained technological innovation and expanding application frontiers. Growth accelerators such as the relentless pursuit of ultra-low latency and high-fidelity motion tracking, coupled with the increasing demand for more intuitive user interfaces, will continue to propel market expansion. The ongoing integration of VR sensors into augmented reality devices and the burgeoning development of the metaverse will unlock unprecedented market potential. Strategic investments in research and development, particularly in areas like advanced materials for flexible sensors and sophisticated AI algorithms for sensor data interpretation, will be crucial for capitalizing on these future opportunities. The market is poised to witness a transformative period, where VR sensors become indispensable components enabling truly immersive and interactive digital experiences across a multitude of industries.
VR Sensor Segmentation
-
1. Application
- 1.1. VR Headsets
- 1.2. VR Playstation
- 1.3. Others
-
2. Types
- 2.1. Accelerometer Sensor
- 2.2. Gyroscope Sensor
- 2.3. Magnetometer Sensor
- 2.4. Others
VR Sensor Segmentation By Geography
-
1. North America
- 1.1. United States
- 1.2. Canada
- 1.3. Mexico
-
2. South America
- 2.1. Brazil
- 2.2. Argentina
- 2.3. Rest of South America
-
3. Europe
- 3.1. United Kingdom
- 3.2. Germany
- 3.3. France
- 3.4. Italy
- 3.5. Spain
- 3.6. Russia
- 3.7. Benelux
- 3.8. Nordics
- 3.9. Rest of Europe
-
4. Middle East & Africa
- 4.1. Turkey
- 4.2. Israel
- 4.3. GCC
- 4.4. North Africa
- 4.5. South Africa
- 4.6. Rest of Middle East & Africa
-
5. Asia Pacific
- 5.1. China
- 5.2. India
- 5.3. Japan
- 5.4. South Korea
- 5.5. ASEAN
- 5.6. Oceania
- 5.7. Rest of Asia Pacific
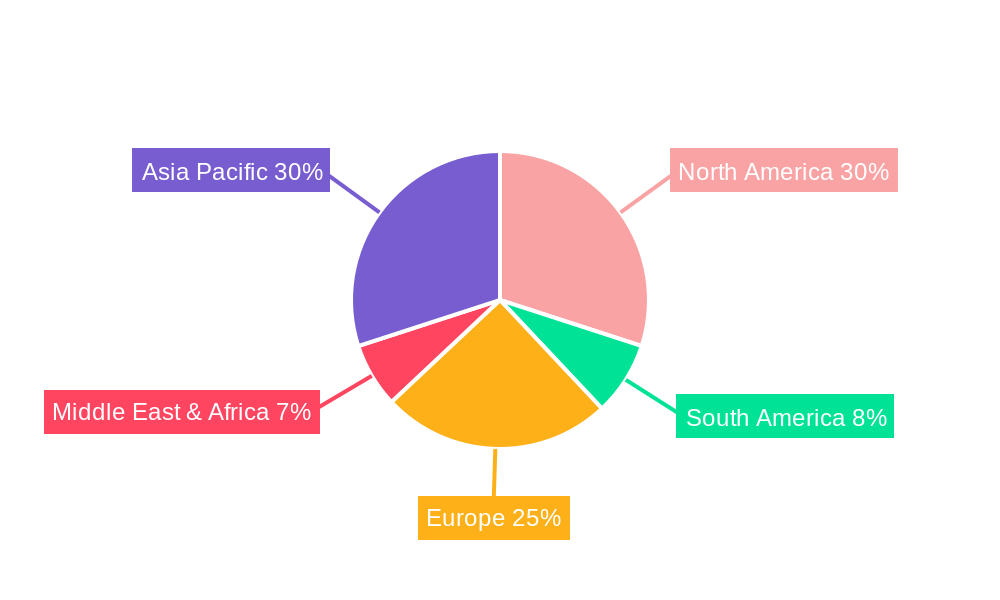
VR Sensor Regional Market Share
Geographic Coverage of VR Sensor
VR Sensor REPORT HIGHLIGHTS
| Aspects | Details |
|---|---|
| Study Period | 2020-2034 |
| Base Year | 2025 |
| Estimated Year | 2026 |
| Forecast Period | 2026-2034 |
| Historical Period | 2020-2025 |
| Growth Rate | CAGR of 18.31% from 2020-2034 |
| Segmentation |
|
Table of Contents
- 1. Introduction
- 1.1. Research Scope
- 1.2. Market Segmentation
- 1.3. Research Objective
- 1.4. Definitions and Assumptions
- 2. Executive Summary
- 2.1. Market Snapshot
- 3. Market Dynamics
- 3.1. Market Drivers
- 3.2. Market Restrains
- 3.3. Market Trends
- 3.4. Market Opportunities
- 4. Market Factor Analysis
- 4.1. Porters Five Forces
- 4.1.1. Bargaining Power of Suppliers
- 4.1.2. Bargaining Power of Buyers
- 4.1.3. Threat of New Entrants
- 4.1.4. Threat of Substitutes
- 4.1.5. Competitive Rivalry
- 4.2. PESTEL analysis
- 4.3. BCG Analysis
- 4.3.1. Stars (High Growth, High Market Share)
- 4.3.2. Cash Cows (Low Growth, High Market Share)
- 4.3.3. Question Mark (High Growth, Low Market Share)
- 4.3.4. Dogs (Low Growth, Low Market Share)
- 4.4. Ansoff Matrix Analysis
- 4.5. Supply Chain Analysis
- 4.6. Regulatory Landscape
- 4.7. Current Market Potential and Opportunity Assessment (TAM–SAM–SOM Framework)
- 4.8. IMR Analyst Note
- 4.1. Porters Five Forces
- 5. Market Analysis, Insights and Forecast 2021-2033
- 5.1. Market Analysis, Insights and Forecast - by Application
- 5.1.1. VR Headsets
- 5.1.2. VR Playstation
- 5.1.3. Others
- 5.2. Market Analysis, Insights and Forecast - by Types
- 5.2.1. Accelerometer Sensor
- 5.2.2. Gyroscope Sensor
- 5.2.3. Magnetometer Sensor
- 5.2.4. Others
- 5.3. Market Analysis, Insights and Forecast - by Region
- 5.3.1. North America
- 5.3.2. South America
- 5.3.3. Europe
- 5.3.4. Middle East & Africa
- 5.3.5. Asia Pacific
- 5.1. Market Analysis, Insights and Forecast - by Application
- 6. Global VR Sensor Analysis, Insights and Forecast, 2021-2033
- 6.1. Market Analysis, Insights and Forecast - by Application
- 6.1.1. VR Headsets
- 6.1.2. VR Playstation
- 6.1.3. Others
- 6.2. Market Analysis, Insights and Forecast - by Types
- 6.2.1. Accelerometer Sensor
- 6.2.2. Gyroscope Sensor
- 6.2.3. Magnetometer Sensor
- 6.2.4. Others
- 6.1. Market Analysis, Insights and Forecast - by Application
- 7. North America VR Sensor Analysis, Insights and Forecast, 2020-2032
- 7.1. Market Analysis, Insights and Forecast - by Application
- 7.1.1. VR Headsets
- 7.1.2. VR Playstation
- 7.1.3. Others
- 7.2. Market Analysis, Insights and Forecast - by Types
- 7.2.1. Accelerometer Sensor
- 7.2.2. Gyroscope Sensor
- 7.2.3. Magnetometer Sensor
- 7.2.4. Others
- 7.1. Market Analysis, Insights and Forecast - by Application
- 8. South America VR Sensor Analysis, Insights and Forecast, 2020-2032
- 8.1. Market Analysis, Insights and Forecast - by Application
- 8.1.1. VR Headsets
- 8.1.2. VR Playstation
- 8.1.3. Others
- 8.2. Market Analysis, Insights and Forecast - by Types
- 8.2.1. Accelerometer Sensor
- 8.2.2. Gyroscope Sensor
- 8.2.3. Magnetometer Sensor
- 8.2.4. Others
- 8.1. Market Analysis, Insights and Forecast - by Application
- 9. Europe VR Sensor Analysis, Insights and Forecast, 2020-2032
- 9.1. Market Analysis, Insights and Forecast - by Application
- 9.1.1. VR Headsets
- 9.1.2. VR Playstation
- 9.1.3. Others
- 9.2. Market Analysis, Insights and Forecast - by Types
- 9.2.1. Accelerometer Sensor
- 9.2.2. Gyroscope Sensor
- 9.2.3. Magnetometer Sensor
- 9.2.4. Others
- 9.1. Market Analysis, Insights and Forecast - by Application
- 10. Middle East & Africa VR Sensor Analysis, Insights and Forecast, 2020-2032
- 10.1. Market Analysis, Insights and Forecast - by Application
- 10.1.1. VR Headsets
- 10.1.2. VR Playstation
- 10.1.3. Others
- 10.2. Market Analysis, Insights and Forecast - by Types
- 10.2.1. Accelerometer Sensor
- 10.2.2. Gyroscope Sensor
- 10.2.3. Magnetometer Sensor
- 10.2.4. Others
- 10.1. Market Analysis, Insights and Forecast - by Application
- 11. Asia Pacific VR Sensor Analysis, Insights and Forecast, 2020-2032
- 11.1. Market Analysis, Insights and Forecast - by Application
- 11.1.1. VR Headsets
- 11.1.2. VR Playstation
- 11.1.3. Others
- 11.2. Market Analysis, Insights and Forecast - by Types
- 11.2.1. Accelerometer Sensor
- 11.2.2. Gyroscope Sensor
- 11.2.3. Magnetometer Sensor
- 11.2.4. Others
- 11.1. Market Analysis, Insights and Forecast - by Application
- 12. Competitive Analysis
- 12.1. Company Profiles
- 12.1.1 STMicroelectronics
- 12.1.1.1. Company Overview
- 12.1.1.2. Products
- 12.1.1.3. Company Financials
- 12.1.1.4. SWOT Analysis
- 12.1.2 TI
- 12.1.2.1. Company Overview
- 12.1.2.2. Products
- 12.1.2.3. Company Financials
- 12.1.2.4. SWOT Analysis
- 12.1.3 InvenSense
- 12.1.3.1. Company Overview
- 12.1.3.2. Products
- 12.1.3.3. Company Financials
- 12.1.3.4. SWOT Analysis
- 12.1.4 LeapMotion
- 12.1.4.1. Company Overview
- 12.1.4.2. Products
- 12.1.4.3. Company Financials
- 12.1.4.4. SWOT Analysis
- 12.1.5 BoschSensortec
- 12.1.5.1. Company Overview
- 12.1.5.2. Products
- 12.1.5.3. Company Financials
- 12.1.5.4. SWOT Analysis
- 12.1.6 PrimeSense
- 12.1.6.1. Company Overview
- 12.1.6.2. Products
- 12.1.6.3. Company Financials
- 12.1.6.4. SWOT Analysis
- 12.1.7 PS Move
- 12.1.7.1. Company Overview
- 12.1.7.2. Products
- 12.1.7.3. Company Financials
- 12.1.7.4. SWOT Analysis
- 12.1.8 Kinect
- 12.1.8.1. Company Overview
- 12.1.8.2. Products
- 12.1.8.3. Company Financials
- 12.1.8.4. SWOT Analysis
- 12.1.9 Vii
- 12.1.9.1. Company Overview
- 12.1.9.2. Products
- 12.1.9.3. Company Financials
- 12.1.9.4. SWOT Analysis
- 12.1.1 STMicroelectronics
- 12.2. Market Entropy
- 12.2.1 Company's Key Areas Served
- 12.2.2 Recent Developments
- 12.3. Company Market Share Analysis 2025
- 12.3.1 Top 5 Companies Market Share Analysis
- 12.3.2 Top 3 Companies Market Share Analysis
- 12.4. List of Potential Customers
- 13. Research Methodology
List of Figures
- Figure 1: Global VR Sensor Revenue Breakdown (billion, %) by Region 2025 & 2033
- Figure 2: North America VR Sensor Revenue (billion), by Application 2025 & 2033
- Figure 3: North America VR Sensor Revenue Share (%), by Application 2025 & 2033
- Figure 4: North America VR Sensor Revenue (billion), by Types 2025 & 2033
- Figure 5: North America VR Sensor Revenue Share (%), by Types 2025 & 2033
- Figure 6: North America VR Sensor Revenue (billion), by Country 2025 & 2033
- Figure 7: North America VR Sensor Revenue Share (%), by Country 2025 & 2033
- Figure 8: South America VR Sensor Revenue (billion), by Application 2025 & 2033
- Figure 9: South America VR Sensor Revenue Share (%), by Application 2025 & 2033
- Figure 10: South America VR Sensor Revenue (billion), by Types 2025 & 2033
- Figure 11: South America VR Sensor Revenue Share (%), by Types 2025 & 2033
- Figure 12: South America VR Sensor Revenue (billion), by Country 2025 & 2033
- Figure 13: South America VR Sensor Revenue Share (%), by Country 2025 & 2033
- Figure 14: Europe VR Sensor Revenue (billion), by Application 2025 & 2033
- Figure 15: Europe VR Sensor Revenue Share (%), by Application 2025 & 2033
- Figure 16: Europe VR Sensor Revenue (billion), by Types 2025 & 2033
- Figure 17: Europe VR Sensor Revenue Share (%), by Types 2025 & 2033
- Figure 18: Europe VR Sensor Revenue (billion), by Country 2025 & 2033
- Figure 19: Europe VR Sensor Revenue Share (%), by Country 2025 & 2033
- Figure 20: Middle East & Africa VR Sensor Revenue (billion), by Application 2025 & 2033
- Figure 21: Middle East & Africa VR Sensor Revenue Share (%), by Application 2025 & 2033
- Figure 22: Middle East & Africa VR Sensor Revenue (billion), by Types 2025 & 2033
- Figure 23: Middle East & Africa VR Sensor Revenue Share (%), by Types 2025 & 2033
- Figure 24: Middle East & Africa VR Sensor Revenue (billion), by Country 2025 & 2033
- Figure 25: Middle East & Africa VR Sensor Revenue Share (%), by Country 2025 & 2033
- Figure 26: Asia Pacific VR Sensor Revenue (billion), by Application 2025 & 2033
- Figure 27: Asia Pacific VR Sensor Revenue Share (%), by Application 2025 & 2033
- Figure 28: Asia Pacific VR Sensor Revenue (billion), by Types 2025 & 2033
- Figure 29: Asia Pacific VR Sensor Revenue Share (%), by Types 2025 & 2033
- Figure 30: Asia Pacific VR Sensor Revenue (billion), by Country 2025 & 2033
- Figure 31: Asia Pacific VR Sensor Revenue Share (%), by Country 2025 & 2033
List of Tables
- Table 1: Global VR Sensor Revenue billion Forecast, by Application 2020 & 2033
- Table 2: Global VR Sensor Revenue billion Forecast, by Types 2020 & 2033
- Table 3: Global VR Sensor Revenue billion Forecast, by Region 2020 & 2033
- Table 4: Global VR Sensor Revenue billion Forecast, by Application 2020 & 2033
- Table 5: Global VR Sensor Revenue billion Forecast, by Types 2020 & 2033
- Table 6: Global VR Sensor Revenue billion Forecast, by Country 2020 & 2033
- Table 7: United States VR Sensor Revenue (billion) Forecast, by Application 2020 & 2033
- Table 8: Canada VR Sensor Revenue (billion) Forecast, by Application 2020 & 2033
- Table 9: Mexico VR Sensor Revenue (billion) Forecast, by Application 2020 & 2033
- Table 10: Global VR Sensor Revenue billion Forecast, by Application 2020 & 2033
- Table 11: Global VR Sensor Revenue billion Forecast, by Types 2020 & 2033
- Table 12: Global VR Sensor Revenue billion Forecast, by Country 2020 & 2033
- Table 13: Brazil VR Sensor Revenue (billion) Forecast, by Application 2020 & 2033
- Table 14: Argentina VR Sensor Revenue (billion) Forecast, by Application 2020 & 2033
- Table 15: Rest of South America VR Sensor Revenue (billion) Forecast, by Application 2020 & 2033
- Table 16: Global VR Sensor Revenue billion Forecast, by Application 2020 & 2033
- Table 17: Global VR Sensor Revenue billion Forecast, by Types 2020 & 2033
- Table 18: Global VR Sensor Revenue billion Forecast, by Country 2020 & 2033
- Table 19: United Kingdom VR Sensor Revenue (billion) Forecast, by Application 2020 & 2033
- Table 20: Germany VR Sensor Revenue (billion) Forecast, by Application 2020 & 2033
- Table 21: France VR Sensor Revenue (billion) Forecast, by Application 2020 & 2033
- Table 22: Italy VR Sensor Revenue (billion) Forecast, by Application 2020 & 2033
- Table 23: Spain VR Sensor Revenue (billion) Forecast, by Application 2020 & 2033
- Table 24: Russia VR Sensor Revenue (billion) Forecast, by Application 2020 & 2033
- Table 25: Benelux VR Sensor Revenue (billion) Forecast, by Application 2020 & 2033
- Table 26: Nordics VR Sensor Revenue (billion) Forecast, by Application 2020 & 2033
- Table 27: Rest of Europe VR Sensor Revenue (billion) Forecast, by Application 2020 & 2033
- Table 28: Global VR Sensor Revenue billion Forecast, by Application 2020 & 2033
- Table 29: Global VR Sensor Revenue billion Forecast, by Types 2020 & 2033
- Table 30: Global VR Sensor Revenue billion Forecast, by Country 2020 & 2033
- Table 31: Turkey VR Sensor Revenue (billion) Forecast, by Application 2020 & 2033
- Table 32: Israel VR Sensor Revenue (billion) Forecast, by Application 2020 & 2033
- Table 33: GCC VR Sensor Revenue (billion) Forecast, by Application 2020 & 2033
- Table 34: North Africa VR Sensor Revenue (billion) Forecast, by Application 2020 & 2033
- Table 35: South Africa VR Sensor Revenue (billion) Forecast, by Application 2020 & 2033
- Table 36: Rest of Middle East & Africa VR Sensor Revenue (billion) Forecast, by Application 2020 & 2033
- Table 37: Global VR Sensor Revenue billion Forecast, by Application 2020 & 2033
- Table 38: Global VR Sensor Revenue billion Forecast, by Types 2020 & 2033
- Table 39: Global VR Sensor Revenue billion Forecast, by Country 2020 & 2033
- Table 40: China VR Sensor Revenue (billion) Forecast, by Application 2020 & 2033
- Table 41: India VR Sensor Revenue (billion) Forecast, by Application 2020 & 2033
- Table 42: Japan VR Sensor Revenue (billion) Forecast, by Application 2020 & 2033
- Table 43: South Korea VR Sensor Revenue (billion) Forecast, by Application 2020 & 2033
- Table 44: ASEAN VR Sensor Revenue (billion) Forecast, by Application 2020 & 2033
- Table 45: Oceania VR Sensor Revenue (billion) Forecast, by Application 2020 & 2033
- Table 46: Rest of Asia Pacific VR Sensor Revenue (billion) Forecast, by Application 2020 & 2033
Frequently Asked Questions
1. What is the projected Compound Annual Growth Rate (CAGR) of the VR Sensor?
The projected CAGR is approximately 18.31%.
2. Which companies are prominent players in the VR Sensor?
Key companies in the market include STMicroelectronics, TI, InvenSense, LeapMotion, BoschSensortec, PrimeSense, PS Move, Kinect, Vii.
3. What are the main segments of the VR Sensor?
The market segments include Application, Types.
4. Can you provide details about the market size?
The market size is estimated to be USD 7.28 billion as of 2022.
5. What are some drivers contributing to market growth?
N/A
6. What are the notable trends driving market growth?
N/A
7. Are there any restraints impacting market growth?
N/A
8. Can you provide examples of recent developments in the market?
N/A
9. What pricing options are available for accessing the report?
Pricing options include single-user, multi-user, and enterprise licenses priced at USD 2900.00, USD 4350.00, and USD 5800.00 respectively.
10. Is the market size provided in terms of value or volume?
The market size is provided in terms of value, measured in billion.
11. Are there any specific market keywords associated with the report?
Yes, the market keyword associated with the report is "VR Sensor," which aids in identifying and referencing the specific market segment covered.
12. How do I determine which pricing option suits my needs best?
The pricing options vary based on user requirements and access needs. Individual users may opt for single-user licenses, while businesses requiring broader access may choose multi-user or enterprise licenses for cost-effective access to the report.
13. Are there any additional resources or data provided in the VR Sensor report?
While the report offers comprehensive insights, it's advisable to review the specific contents or supplementary materials provided to ascertain if additional resources or data are available.
14. How can I stay updated on further developments or reports in the VR Sensor?
To stay informed about further developments, trends, and reports in the VR Sensor, consider subscribing to industry newsletters, following relevant companies and organizations, or regularly checking reputable industry news sources and publications.
Methodology
Step 1 - Identification of Relevant Samples Size from Population Database


Step 2 - Approaches for Defining Global Market Size (Value, Volume* & Price*)

Note*: In applicable scenarios
Step 3 - Data Sources
Primary Research
- Web Analytics
- Survey Reports
- Research Institute
- Latest Research Reports
- Opinion Leaders
Secondary Research
- Annual Reports
- White Paper
- Latest Press Release
- Industry Association
- Paid Database
- Investor Presentations

Step 4 - Data Triangulation
Involves using different sources of information in order to increase the validity of a study
These sources are likely to be stakeholders in a program - participants, other researchers, program staff, other community members, and so on.
Then we put all data in single framework & apply various statistical tools to find out the dynamic on the market.
During the analysis stage, feedback from the stakeholder groups would be compared to determine areas of agreement as well as areas of divergence