

Key Insights into the 3d Sensing Technology Market
The global 3d Sensing Technology Market is currently valued at $2,958 million, demonstrating robust expansion driven by pervasive integration across diverse industries. Projections indicate a substantial ascent, with the market expected to reach approximately $7,329 million by 2032, exhibiting an impressive Compound Annual Growth Rate (CAGR) of 12% from the base year. This significant growth trajectory is underpinned by critical demand drivers, including the escalating adoption of 3D sensing solutions in consumer electronics, automotive safety systems, and sophisticated industrial automation applications.
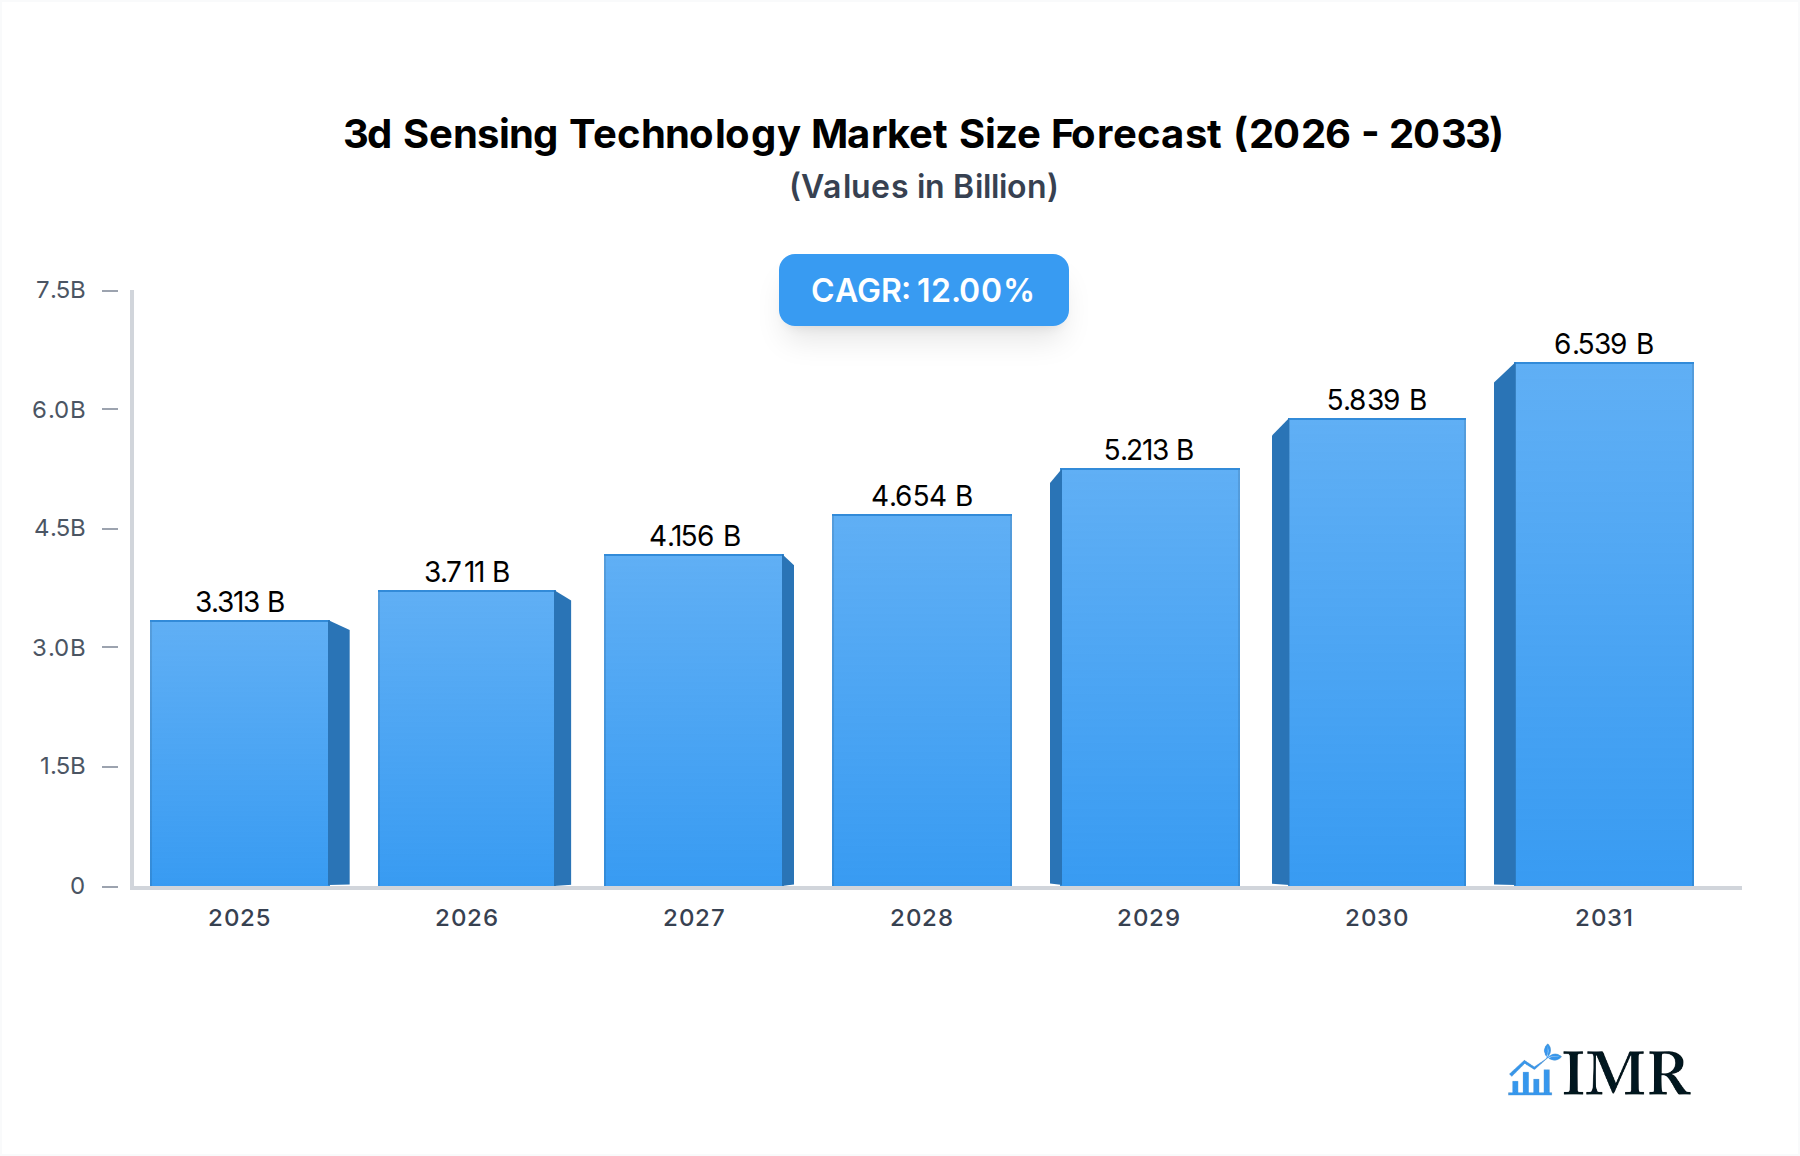
3d Sensing Technology Market Size (In Billion)
Technological advancements, particularly in Time-of-Flight (ToF) and Structured Light techniques, are enhancing depth perception accuracy and computational efficiency, making 3D sensing indispensable for next-generation devices. The pervasive nature of facial recognition and gesture recognition capabilities in smartphones and other personal devices continues to fuel demand within the Consumer Electronics Market. Similarly, the imperative for advanced driver-assistance systems (ADAS) and autonomous vehicles is propelling the demand for high-fidelity 3D sensors in the Automotive Electronics Market, enabling superior environmental perception and obstacle detection. Furthermore, the Industry 4.0 paradigm shift is catalyzing the uptake of 3D sensing for quality inspection, robotic navigation, and precision manufacturing processes within the Industrial Automation Market, thereby optimizing operational efficiencies and reducing human error.

3d Sensing Technology Company Market Share
Macro tailwinds such as the continuous miniaturization of sensor components, the increasing computational power of edge devices, and the symbiotic integration with Artificial Intelligence Market algorithms are expanding the addressable market. The burgeoning Augmented Reality Market and virtual reality ecosystems are also heavily reliant on accurate 3D spatial data for immersive user experiences and environmental mapping. Geographically, Asia Pacific is anticipated to maintain its dominance, driven by extensive manufacturing capabilities and a vast consumer base, while North America and Europe continue to be hubs for innovation and high-value application adoption. The competitive landscape is characterized by a blend of established semiconductor giants, specialized optical solution providers, and emerging startups, all vying for market share through continuous innovation in sensor design, software integration, and application-specific solutions. The forward-looking outlook remains highly optimistic, with continuous R&D investments expected to unlock new capabilities and extend 3D sensing technology into an even broader array of professional and commercial services.
The Dominance of Consumer Electronics in 3d Sensing Technology Market
The Consumer Electronics Market represents the single largest end-user segment within the global 3d Sensing Technology Market, consistently commanding the predominant revenue share. Its unparalleled dominance stems primarily from the widespread integration of 3D sensing capabilities into smartphones, tablets, and a burgeoning array of smart home devices and AR/VR headsets. This segment's sheer volume and rapid innovation cycles have made it the primary accelerator for 3D sensing technology adoption and cost reduction. The pivotal moment arrived with the mass-market introduction of facial recognition systems, such as Apple's Face ID, which utilized structured light technology for secure biometric authentication. This application alone necessitated the deployment of millions of 3D sensor modules annually, driving economies of scale for manufacturers.
The demand within the Consumer Electronics Market extends beyond security, encompassing gesture recognition for intuitive user interfaces, enhanced photography and videography through advanced depth mapping (e.g., portrait mode, augmented reality overlays), and sophisticated gaming experiences. The continuous quest for improved user experience and feature differentiation among device manufacturers ensures sustained investment in 3D sensing R&D. Key players, including Apple Inc., Sony Group Corporation, and Samsung, are instrumental in driving this segment's growth. Apple, for instance, has been a trailblazer in integrating advanced Structured Light Technology Market and, more recently, LiDAR (a form of ToF) into its premium devices, setting a benchmark for the industry. Sony Group Corporation, on the other hand, is a leading supplier of Time-of-Flight Sensor Market modules, particularly for smartphone camera systems, enabling precise depth measurement and low-light performance.
The segment's market share is not only dominant but also continues to grow, albeit with potential shifts in the underlying technology mix. While structured light remains critical for specific applications like facial recognition, the versatility and range capabilities of Time-of-Flight (ToF) sensors are increasingly being explored for rear-facing camera applications, Augmented Reality Market features, and smaller form factor devices. The competition among sensor suppliers, combined with the fierce rivalry among consumer electronics brands, has spurred rapid advancements in sensor miniaturization, power efficiency, and cost-effectiveness. This dynamic environment has led to consolidation among some component providers but has simultaneously expanded the overall market for 3D sensing solutions by making them more accessible and feature-rich for a broader range of consumer devices. As the Consumer Electronics Market evolves towards more immersive and intelligent experiences, its role as the primary driver of the 3d Sensing Technology Market is expected to remain unchallenged, continually pushing the boundaries of what these technologies can achieve.
Core Market Drivers and Technological Advancements in 3d Sensing Technology Market
The 3d Sensing Technology Market's trajectory is primarily shaped by several potent drivers and continuous technological advancements. The confluence of these factors is accelerating adoption across diverse sectors, transforming capabilities from consumer devices to heavy industry.
Firstly, the ubiquitous integration into consumer electronics stands as a pivotal driver. The mass-market adoption of smartphones featuring 3D sensing for facial recognition, exemplified by technologies like Apple's Face ID utilizing Structured Light Technology Market, has profoundly impacted market scale. This has led to high-volume manufacturing, driving down unit costs and fostering innovation. Beyond security, 3D sensing enhances camera capabilities (e.g., depth effects, AR applications) and enables intuitive gesture recognition, bolstering the Consumer Electronics Market's demand for sophisticated human-machine interfaces.
Secondly, the escalating demand from the automotive sector for advanced driver-assistance systems (ADAS) and fully autonomous vehicles is a significant catalyst. 3D sensors, including LiDAR, radar, and stereoscopic vision systems, provide crucial environmental perception, enabling obstacle detection, lane keeping, and adaptive cruise control. This imperative for enhanced safety and navigation capabilities is fueling substantial investment and integration within the Automotive Electronics Market, with OEMs targeting zero-accident objectives.
Thirdly, the expansion in industrial automation and robotics is revolutionizing manufacturing processes. 3D vision systems are critical for precision tasks such as robotic guidance, quality inspection, bin picking, and sophisticated object manipulation. By providing accurate spatial data, these sensors significantly improve efficiency, reduce defects, and enable complex automated workflows, thereby propelling growth in the Industrial Automation Market and supporting the Industry 4.0 paradigm.
Fourthly, the emergence and growth of augmented and virtual reality (AR/VR) applications are creating new avenues for 3D sensing. AR/VR devices heavily rely on accurate 3D sensing for environmental mapping, simultaneous localization and mapping (SLAM), object tracking, and realistic interaction within digital overlays. As the Augmented Reality Market matures and becomes more mainstream, the demand for compact, high-performance 3D sensors will surge, enabling more immersive and interactive user experiences.
Lastly, continuous miniaturization and cost reduction in the Semiconductor Device Market play a foundational role. Advancements in sensor fabrication, optical component design, and signal processing result in smaller, more power-efficient, and economically viable 3D sensors. This technological evolution allows for broader integration into a wider array of devices and applications, expanding the overall market potential for 3d sensing technologies.
Competitive Ecosystem of 3d Sensing Technology Market
The competitive landscape of the 3d Sensing Technology Market is characterized by a blend of established technology giants, specialized sensor manufacturers, and innovative component providers. These entities are actively engaged in R&D, strategic partnerships, and product launches to maintain and expand their market presence.
- Sony Group Corporation: A global leader in Image Sensor Market technology, Sony is a significant player in the 3D sensing space, particularly renowned for its Time-of-Flight (ToF) sensors used in smartphones and other consumer devices, driving innovation in depth sensing and mobile photography.
- Apple Inc.: A key innovator and end-user, Apple has driven mass adoption of 3D sensing through its Face ID technology, utilizing structured light for secure biometric authentication, and more recently, LiDAR for advanced augmented reality applications in its high-end devices.
- Intel Corporation: Known for its RealSense™ depth and tracking cameras, Intel provides versatile 3D sensing solutions for various applications, including robotics, drones, and virtual reality, focusing on advanced perception capabilities.
- Infineon Technologies AG: A prominent semiconductor company, Infineon offers a range of 3D Time-of-Flight (ToF) sensors, which are widely adopted in automotive, industrial, and consumer applications for accurate distance measurement and gesture control.
- STMicroelectronics: This global semiconductor leader supplies microcontrollers, mixed-signal, and advanced sensing solutions, including Time-of-Flight sensors that are crucial for depth mapping, autofocus, and proximity detection in various consumer and industrial products.
- Texas Instruments Incorporated: A diverse semiconductor manufacturer, Texas Instruments provides a broad portfolio of components vital for 3D sensing systems, including DLP technology for structured light systems and power management ICs for sensor integration.
- Microsoft Corporation: Through its Azure Kinect DK, Microsoft offers advanced 3D sensing hardware and software development kits, empowering developers to create sophisticated AI-powered applications across healthcare, retail, and robotics sectors.
- OmniVision Technologies, Inc.: A developer of advanced digital imaging solutions, OmniVision offers various Image Sensor Market technologies, including those adapted for 3D sensing applications, focusing on compact and high-performance solutions for mobile and automotive industries.
- Lumentum Holdings Inc.: A leading provider of optical and photonic products, Lumentum is a key supplier of VCSEL (Vertical Cavity Surface Emitting Laser) arrays, which are critical components for 3D sensing modules used in consumer electronics, particularly for structured light and ToF systems.
- Basler AG: Specializing in high-quality industrial cameras and vision components, Basler provides 3D camera solutions based on Time-of-Flight and stereo vision, catering primarily to machine vision, industrial automation, and logistics applications.
- Cognex Corporation: A global leader in machine vision systems, Cognex offers advanced 3D vision systems and sensors for automated inspection, measurement, and guidance tasks in manufacturing and logistics, enhancing precision and efficiency.
- Teledyne Technologies Incorporated: Through its various subsidiaries, Teledyne offers a comprehensive range of advanced Image Sensor Market and sophisticated instrumentation, including high-performance 3D imaging solutions for aerospace, defense, scientific, and industrial markets.
Recent Developments & Milestones in 3d Sensing Technology Market
The 3d Sensing Technology Market is a rapidly evolving sector, characterized by continuous innovation, strategic collaborations, and product enhancements designed to expand capabilities and application areas. Recent milestones reflect a concerted effort to improve sensor performance, reduce costs, and integrate these technologies into emerging platforms.
- Q4 2023: A prominent semiconductor firm unveiled a new generation of Time-of-Flight Sensor Market arrays, significantly improving accuracy and range while reducing power consumption, specifically targeting next-gen smartphone and AR device integration. This development aims to further cement 3D sensing within the Consumer Electronics Market.
- Q3 2023: Major automotive OEMs announced partnerships with leading LiDAR manufacturers to integrate long-range, high-resolution 3D sensing systems into their 2026 model autonomous vehicle platforms, marking a critical step towards Level 3 and Level 4 self-driving capabilities in the Automotive Electronics Market.
- Q2 2024: A new Structured Light Technology Market module was launched, designed with enhanced robustness and faster acquisition rates, specifically tailored for demanding industrial environments and high-speed quality inspection lines in the Industrial Automation Market.
- Q1 2024: Leading tech companies revealed substantial R&D investments aimed at developing ultra-compact and lightweight 3D sensing solutions for the burgeoning Augmented Reality Market, focusing on seamless integration into smart glasses and head-mounted displays for a more pervasive user experience.
- Q4 2022: Researchers demonstrated significant breakthroughs in integrating 3D sensor data with advanced machine learning algorithms, leading to a 20% improvement in real-time object detection and gesture recognition accuracy, thereby advancing capabilities for the Artificial Intelligence Market in perception systems.
- Q3 2022: A consortium of Semiconductor Device Market manufacturers and academic institutions announced a collaborative initiative to explore novel materials and fabrication processes for 3D sensors, aiming to achieve further miniaturization and cost reductions while maintaining performance benchmarks.
Regional Market Breakdown for 3d Sensing Technology Market
The global 3d Sensing Technology Market exhibits diverse growth patterns and adoption rates across key regions, influenced by economic development, technological infrastructure, and industry-specific demand.
Asia Pacific: This region is the dominant force in the 3d Sensing Technology Market, holding the largest revenue share, primarily driven by its robust manufacturing base for consumer electronics and a vast consumer population. Countries like China, South Korea, and Japan are at the forefront of smartphone production and adoption, heavily integrating 3D sensing for facial recognition and augmented reality features. The region also sees significant investments in industrial automation and smart cities, further bolstering demand. With its strong focus on technological innovation and rapid industrialization, Asia Pacific is also poised to be the fastest-growing region, with an estimated regional CAGR potentially exceeding the global average, fueled by the expanding Consumer Electronics Market and Industrial Automation Market segments.
North America: This region commands a substantial market share, second only to Asia Pacific, characterized by high R&D investments, the presence of major technology giants (Apple, Microsoft, Intel), and early adoption of advanced technologies. The demand here is driven by innovation in the Augmented Reality Market, high-end automotive applications (ADAS, autonomous driving), and advanced healthcare solutions. The sophisticated Automotive Electronics Market and the burgeoning data center industry also contribute significantly to the demand for specialized 3D sensing solutions. The region experiences steady, high-value growth.
Europe: Europe represents a mature but consistently growing market for 3D sensing technology. Countries like Germany, France, and the UK lead in industrial automation and automotive manufacturing, driving demand for precision 3D sensors in factories and vehicles. The region's strong emphasis on Industry 4.0 initiatives and advanced medical technology fuels the adoption of high-performance 3D vision systems for quality control, robotics, and surgical guidance. Europe maintains a stable growth trajectory, underpinned by its established industrial base and regulatory pushes for automotive safety.
Middle East & Africa (MEA) / South America: These emerging markets collectively hold a smaller current share of the 3d Sensing Technology Market but present significant growth potential. Increasing disposable incomes, improving digital infrastructure, and a growing emphasis on industrial modernization are key demand drivers. While still nascent, the adoption of smartphones and the gradual development of smart city initiatives are contributing to market expansion. The demand is often for readily available and cost-effective solutions, with potential for strong CAGRs as these regions catch up in technological adoption, particularly in segments like consumer electronics and basic industrial automation.
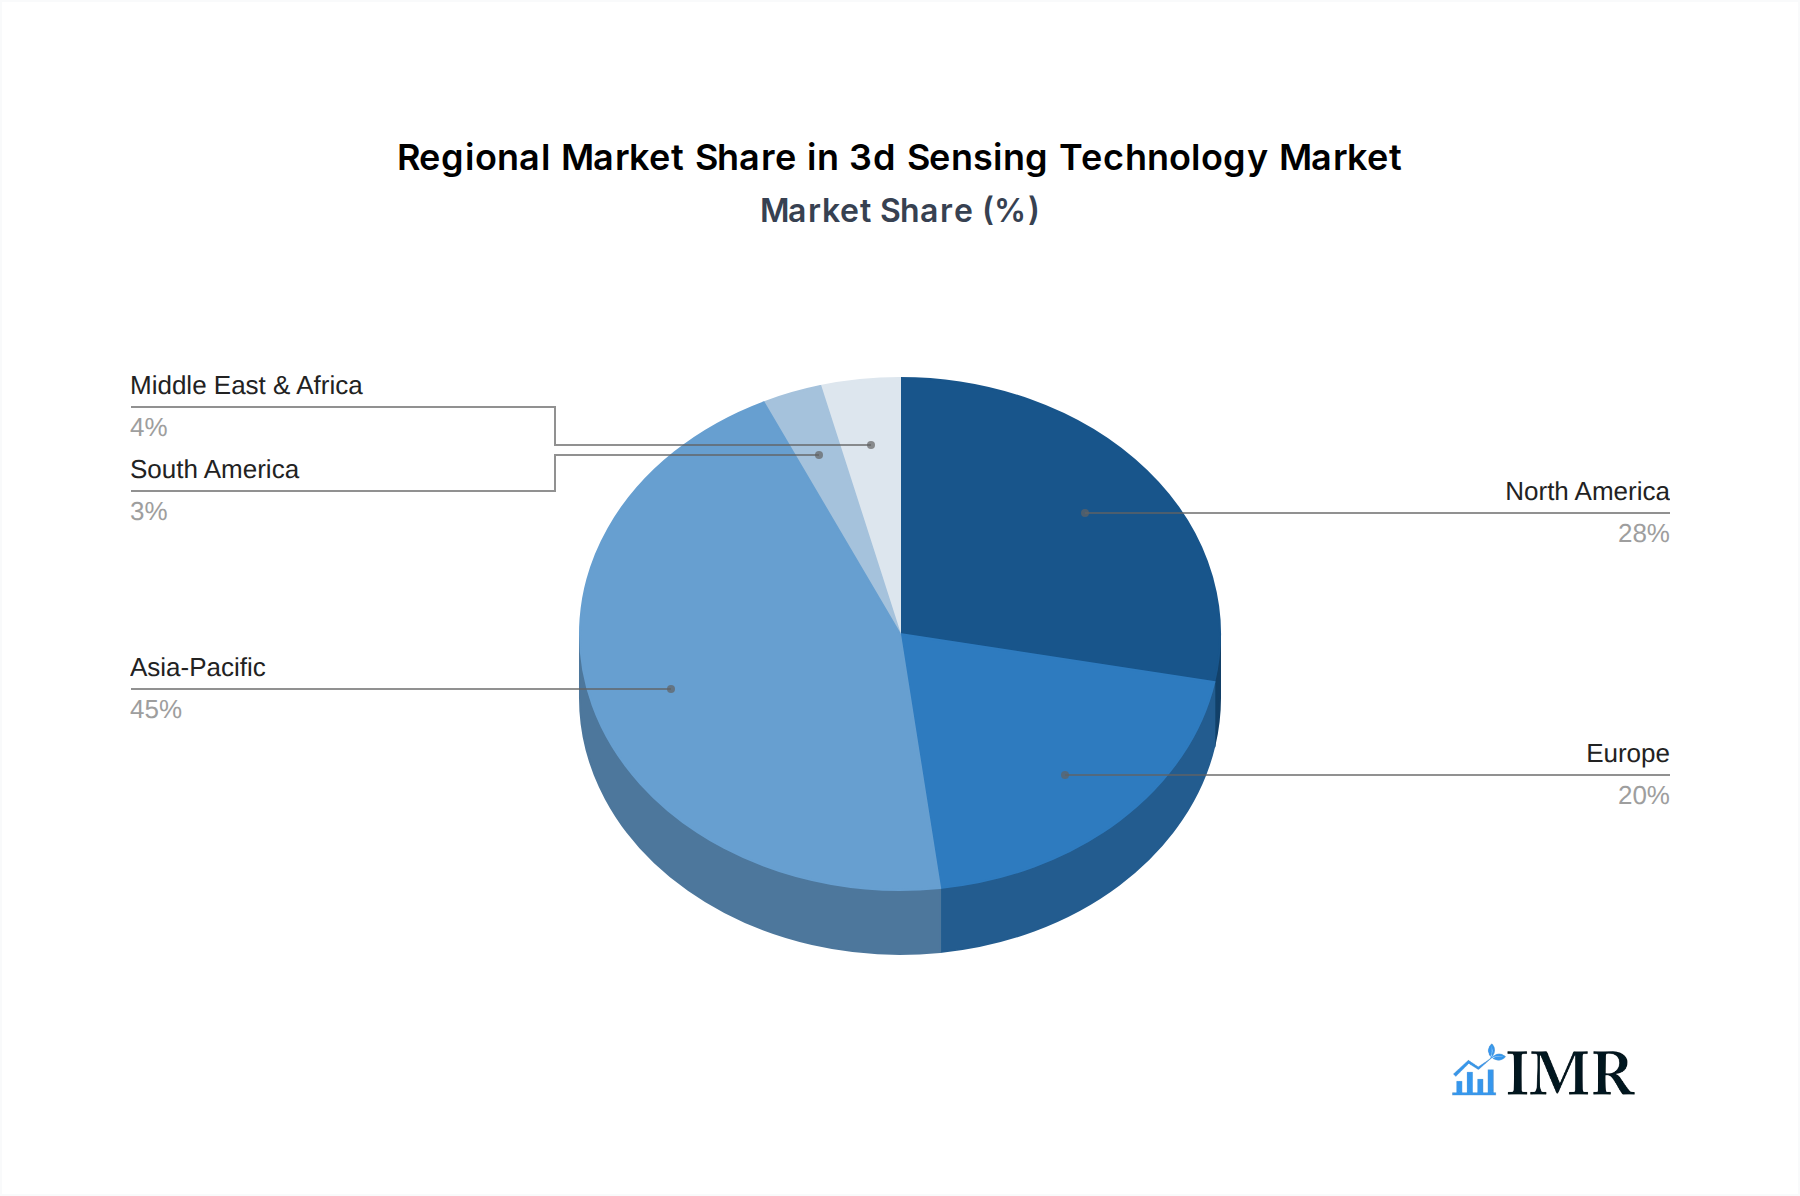
3d Sensing Technology Regional Market Share
Export, Trade Flow & Tariff Impact on 3d Sensing Technology Market
The global 3d Sensing Technology Market is intrinsically linked to complex international trade flows, given its intricate supply chain involving semiconductor components, optical modules, and integrated systems. Major trade corridors facilitate the movement of these specialized products from manufacturing hubs to end-use markets.
Major Trade Corridors: The primary corridors for 3D sensing components and finished devices typically flow from East Asia (China, South Korea, Japan, Taiwan) to North America and Europe. East Asia dominates the fabrication of specialized Semiconductor Device Market components, Image Sensor Market arrays, and VCSELs, which are crucial for 3D depth cameras. Finished consumer electronics products, such as smartphones and AR/VR headsets, also follow these routes, often assembled in China and then exported globally.
Leading Exporting Nations: China, South Korea, and Japan are leading exporters of 3D sensing components and integrated modules due to their advanced manufacturing capabilities and technological leadership. Germany and the United States also contribute significantly, particularly in high-precision industrial and specialized automotive 3D sensor systems, leveraging their strong R&D ecosystems.
Leading Importing Nations: The United States and countries within the European Union are major importers, driven by robust demand from their Consumer Electronics Market, Automotive Electronics Market, and Industrial Automation Market sectors. Developing economies in Southeast Asia, Latin America, and parts of the Middle East are also increasingly importing finished 3D-sensing-enabled products and components for local assembly.
Tariff and Non-Tariff Barriers: Recent years have seen trade policies, such as the US-China trade tensions, impose tariffs of up to 25% on certain electronic components, including some critical to 3D sensing. These tariffs have necessitated supply chain diversification and stimulated some reshoring or nearshoring efforts, impacting cross-border volume and increasing manufacturing costs for affected players. Non-tariff barriers, such as complex regulatory approvals, export controls on dual-use technologies, and differing data privacy standards (e.g., for facial recognition data), also influence market access and trade dynamics, adding layers of complexity to market entry and expansion strategies.
Pricing Dynamics & Margin Pressure in 3d Sensing Technology Market
The pricing dynamics within the 3d Sensing Technology Market are highly heterogeneous, reflecting the diverse range of applications and performance requirements. This heterogeneity leads to varying average selling prices (ASPs) and margin structures across the value chain, constantly influenced by technological maturity, competitive intensity, and cost levers.
Average Selling Price (ASP) Trends: For consumer-grade 3D sensors, particularly those integrated into smartphones (e.g., for facial recognition or rear-camera depth sensing), ASPs have experienced a significant downward trend. This decline is a direct consequence of economies of scale achieved through high-volume production in the Consumer Electronics Market and intense competition among module suppliers. Conversely, ASPs for industrial-grade, automotive-grade (e.g., LiDAR), and high-precision medical 3D sensors remain substantially higher and exhibit more stability. These segments prioritize performance, reliability, and specific environmental tolerances over cost, justifying premium pricing.
Margin Structures: Margins tend to be thinner for manufacturers of basic, undifferentiated sensor components within the Semiconductor Device Market. However, higher margins are typically found in specialized sensor modules, custom optical components, and the software/firmware layers that process and interpret 3D data. Companies offering integrated solutions, proprietary algorithms for Artificial Intelligence Market applications, or comprehensive system integration services often command better pricing power due to the added value and intellectual property involved. The market for Augmented Reality Market applications is also fostering higher margins for innovative, compact 3D sensing solutions.
Key Cost Levers: The primary cost levers in the 3d Sensing Technology Market include wafer fabrication costs for the image and depth sensors, precision optical component manufacturing (e.g., VCSELs, diffractive optical elements), packaging costs, and the significant R&D expenditures required for continuous innovation. Materials, such as Gallium Arsenide for VCSELs, can fluctuate in price, although their impact on overall sensor costs is often secondary to manufacturing complexity and yield rates. Software development and integration are also substantial cost components, especially for advanced applications like Gesture Recognition Market or object detection.
Competitive Intensity and Pricing Power: The Consumer Electronics Market segment experiences intense competitive pressure, leading to aggressive pricing strategies and continuous feature upgrades at stable or declining prices. This fierce competition puts significant margin pressure on component suppliers. In contrast, the industrial, automotive, and healthcare segments, characterized by stringent qualification processes and longer design cycles, exhibit lower competitive intensity. Suppliers in these sectors often have more pricing power due to specialized expertise, proprietary technology, and the high cost of failure, which justifies higher-priced, robust solutions.
3d Sensing Technology Segmentation
-
1. Technology
- 1.1. Time-of-Flight (ToF)
- 1.2. Structured Light
- 1.3. Stereoscopic Vision
- 1.4. Ultrasound
- 1.5. Others
-
2. Sensor Type
- 2.1. Image Sensors
- 2.2. Position Sensors
- 2.3. Proximity Sensors
- 2.4. Acoustic Sensors
- 2.5. Accelerometers/Gyroscopes
- 2.6. Others
-
3. Connectivity
- 3.1. Wired
- 3.2. Wireless
-
4. Application
- 4.1. Facial Recognition
- 4.2. Gesture Recognition
- 4.3. Object Detection
- 4.4. Quality Inspection
- 4.5. Mapping & Navigation
- 4.6. Others
-
5. End User
- 5.1. Consumer Electronics
- 5.2. Automotive
- 5.3. Industrial
- 5.4. Healthcare
- 5.5. Aerospace & Defense
- 5.6. Others
3d Sensing Technology Segmentation By Geography
-
1. North America
- 1.1. United States
- 1.2. Canada
- 1.3. Mexico
-
2. South America
- 2.1. Brazil
- 2.2. Argentina
- 2.3. Rest of South America
-
3. Europe
- 3.1. United Kingdom
- 3.2. Germany
- 3.3. France
- 3.4. Italy
- 3.5. Spain
- 3.6. Russia
- 3.7. Benelux
- 3.8. Nordics
- 3.9. Rest of Europe
-
4. Middle East & Africa
- 4.1. Turkey
- 4.2. Israel
- 4.3. GCC
- 4.4. North Africa
- 4.5. South Africa
- 4.6. Rest of Middle East & Africa
-
5. Asia Pacific
- 5.1. China
- 5.2. India
- 5.3. Japan
- 5.4. South Korea
- 5.5. ASEAN
- 5.6. Oceania
- 5.7. Rest of Asia Pacific
3d Sensing Technology Regional Market Share
Geographic Coverage of 3d Sensing Technology
3d Sensing Technology REPORT HIGHLIGHTS
| Aspects | Details |
|---|---|
| Study Period | 2020-2034 |
| Base Year | 2025 |
| Estimated Year | 2026 |
| Forecast Period | 2026-2034 |
| Historical Period | 2020-2025 |
| Growth Rate | CAGR of 12% from 2020-2034 |
| Segmentation |
|
Table of Contents
- 1. Introduction
- 1.1. Research Scope
- 1.2. Market Segmentation
- 1.3. Research Objective
- 1.4. Definitions and Assumptions
- 2. Executive Summary
- 2.1. Market Snapshot
- 3. Market Dynamics
- 3.1. Market Drivers
- 3.2. Market Restrains
- 3.3. Market Trends
- 3.4. Market Opportunities
- 4. Market Factor Analysis
- 4.1. Porters Five Forces
- 4.1.1. Bargaining Power of Suppliers
- 4.1.2. Bargaining Power of Buyers
- 4.1.3. Threat of New Entrants
- 4.1.4. Threat of Substitutes
- 4.1.5. Competitive Rivalry
- 4.2. PESTEL analysis
- 4.3. BCG Analysis
- 4.3.1. Stars (High Growth, High Market Share)
- 4.3.2. Cash Cows (Low Growth, High Market Share)
- 4.3.3. Question Mark (High Growth, Low Market Share)
- 4.3.4. Dogs (Low Growth, Low Market Share)
- 4.4. Ansoff Matrix Analysis
- 4.5. Supply Chain Analysis
- 4.6. Regulatory Landscape
- 4.7. Current Market Potential and Opportunity Assessment (TAM–SAM–SOM Framework)
- 4.8. IMR Analyst Note
- 4.1. Porters Five Forces
- 5. Market Analysis, Insights and Forecast 2021-2033
- 5.1. Market Analysis, Insights and Forecast - by Technology
- 5.1.1. Time-of-Flight (ToF)
- 5.1.2. Structured Light
- 5.1.3. Stereoscopic Vision
- 5.1.4. Ultrasound
- 5.1.5. Others
- 5.2. Market Analysis, Insights and Forecast - by Sensor Type
- 5.2.1. Image Sensors
- 5.2.2. Position Sensors
- 5.2.3. Proximity Sensors
- 5.2.4. Acoustic Sensors
- 5.2.5. Accelerometers/Gyroscopes
- 5.2.6. Others
- 5.3. Market Analysis, Insights and Forecast - by Connectivity
- 5.3.1. Wired
- 5.3.2. Wireless
- 5.4. Market Analysis, Insights and Forecast - by Application
- 5.4.1. Facial Recognition
- 5.4.2. Gesture Recognition
- 5.4.3. Object Detection
- 5.4.4. Quality Inspection
- 5.4.5. Mapping & Navigation
- 5.4.6. Others
- 5.5. Market Analysis, Insights and Forecast - by End User
- 5.5.1. Consumer Electronics
- 5.5.2. Automotive
- 5.5.3. Industrial
- 5.5.4. Healthcare
- 5.5.5. Aerospace & Defense
- 5.5.6. Others
- 5.6. Market Analysis, Insights and Forecast - by Region
- 5.6.1. North America
- 5.6.2. South America
- 5.6.3. Europe
- 5.6.4. Middle East & Africa
- 5.6.5. Asia Pacific
- 5.1. Market Analysis, Insights and Forecast - by Technology
- 6. Global 3d Sensing Technology Analysis, Insights and Forecast, 2021-2033
- 6.1. Market Analysis, Insights and Forecast - by Technology
- 6.1.1. Time-of-Flight (ToF)
- 6.1.2. Structured Light
- 6.1.3. Stereoscopic Vision
- 6.1.4. Ultrasound
- 6.1.5. Others
- 6.2. Market Analysis, Insights and Forecast - by Sensor Type
- 6.2.1. Image Sensors
- 6.2.2. Position Sensors
- 6.2.3. Proximity Sensors
- 6.2.4. Acoustic Sensors
- 6.2.5. Accelerometers/Gyroscopes
- 6.2.6. Others
- 6.3. Market Analysis, Insights and Forecast - by Connectivity
- 6.3.1. Wired
- 6.3.2. Wireless
- 6.4. Market Analysis, Insights and Forecast - by Application
- 6.4.1. Facial Recognition
- 6.4.2. Gesture Recognition
- 6.4.3. Object Detection
- 6.4.4. Quality Inspection
- 6.4.5. Mapping & Navigation
- 6.4.6. Others
- 6.5. Market Analysis, Insights and Forecast - by End User
- 6.5.1. Consumer Electronics
- 6.5.2. Automotive
- 6.5.3. Industrial
- 6.5.4. Healthcare
- 6.5.5. Aerospace & Defense
- 6.5.6. Others
- 6.1. Market Analysis, Insights and Forecast - by Technology
- 7. North America 3d Sensing Technology Analysis, Insights and Forecast, 2020-2032
- 7.1. Market Analysis, Insights and Forecast - by Technology
- 7.1.1. Time-of-Flight (ToF)
- 7.1.2. Structured Light
- 7.1.3. Stereoscopic Vision
- 7.1.4. Ultrasound
- 7.1.5. Others
- 7.2. Market Analysis, Insights and Forecast - by Sensor Type
- 7.2.1. Image Sensors
- 7.2.2. Position Sensors
- 7.2.3. Proximity Sensors
- 7.2.4. Acoustic Sensors
- 7.2.5. Accelerometers/Gyroscopes
- 7.2.6. Others
- 7.3. Market Analysis, Insights and Forecast - by Connectivity
- 7.3.1. Wired
- 7.3.2. Wireless
- 7.4. Market Analysis, Insights and Forecast - by Application
- 7.4.1. Facial Recognition
- 7.4.2. Gesture Recognition
- 7.4.3. Object Detection
- 7.4.4. Quality Inspection
- 7.4.5. Mapping & Navigation
- 7.4.6. Others
- 7.5. Market Analysis, Insights and Forecast - by End User
- 7.5.1. Consumer Electronics
- 7.5.2. Automotive
- 7.5.3. Industrial
- 7.5.4. Healthcare
- 7.5.5. Aerospace & Defense
- 7.5.6. Others
- 7.1. Market Analysis, Insights and Forecast - by Technology
- 8. South America 3d Sensing Technology Analysis, Insights and Forecast, 2020-2032
- 8.1. Market Analysis, Insights and Forecast - by Technology
- 8.1.1. Time-of-Flight (ToF)
- 8.1.2. Structured Light
- 8.1.3. Stereoscopic Vision
- 8.1.4. Ultrasound
- 8.1.5. Others
- 8.2. Market Analysis, Insights and Forecast - by Sensor Type
- 8.2.1. Image Sensors
- 8.2.2. Position Sensors
- 8.2.3. Proximity Sensors
- 8.2.4. Acoustic Sensors
- 8.2.5. Accelerometers/Gyroscopes
- 8.2.6. Others
- 8.3. Market Analysis, Insights and Forecast - by Connectivity
- 8.3.1. Wired
- 8.3.2. Wireless
- 8.4. Market Analysis, Insights and Forecast - by Application
- 8.4.1. Facial Recognition
- 8.4.2. Gesture Recognition
- 8.4.3. Object Detection
- 8.4.4. Quality Inspection
- 8.4.5. Mapping & Navigation
- 8.4.6. Others
- 8.5. Market Analysis, Insights and Forecast - by End User
- 8.5.1. Consumer Electronics
- 8.5.2. Automotive
- 8.5.3. Industrial
- 8.5.4. Healthcare
- 8.5.5. Aerospace & Defense
- 8.5.6. Others
- 8.1. Market Analysis, Insights and Forecast - by Technology
- 9. Europe 3d Sensing Technology Analysis, Insights and Forecast, 2020-2032
- 9.1. Market Analysis, Insights and Forecast - by Technology
- 9.1.1. Time-of-Flight (ToF)
- 9.1.2. Structured Light
- 9.1.3. Stereoscopic Vision
- 9.1.4. Ultrasound
- 9.1.5. Others
- 9.2. Market Analysis, Insights and Forecast - by Sensor Type
- 9.2.1. Image Sensors
- 9.2.2. Position Sensors
- 9.2.3. Proximity Sensors
- 9.2.4. Acoustic Sensors
- 9.2.5. Accelerometers/Gyroscopes
- 9.2.6. Others
- 9.3. Market Analysis, Insights and Forecast - by Connectivity
- 9.3.1. Wired
- 9.3.2. Wireless
- 9.4. Market Analysis, Insights and Forecast - by Application
- 9.4.1. Facial Recognition
- 9.4.2. Gesture Recognition
- 9.4.3. Object Detection
- 9.4.4. Quality Inspection
- 9.4.5. Mapping & Navigation
- 9.4.6. Others
- 9.5. Market Analysis, Insights and Forecast - by End User
- 9.5.1. Consumer Electronics
- 9.5.2. Automotive
- 9.5.3. Industrial
- 9.5.4. Healthcare
- 9.5.5. Aerospace & Defense
- 9.5.6. Others
- 9.1. Market Analysis, Insights and Forecast - by Technology
- 10. Middle East & Africa 3d Sensing Technology Analysis, Insights and Forecast, 2020-2032
- 10.1. Market Analysis, Insights and Forecast - by Technology
- 10.1.1. Time-of-Flight (ToF)
- 10.1.2. Structured Light
- 10.1.3. Stereoscopic Vision
- 10.1.4. Ultrasound
- 10.1.5. Others
- 10.2. Market Analysis, Insights and Forecast - by Sensor Type
- 10.2.1. Image Sensors
- 10.2.2. Position Sensors
- 10.2.3. Proximity Sensors
- 10.2.4. Acoustic Sensors
- 10.2.5. Accelerometers/Gyroscopes
- 10.2.6. Others
- 10.3. Market Analysis, Insights and Forecast - by Connectivity
- 10.3.1. Wired
- 10.3.2. Wireless
- 10.4. Market Analysis, Insights and Forecast - by Application
- 10.4.1. Facial Recognition
- 10.4.2. Gesture Recognition
- 10.4.3. Object Detection
- 10.4.4. Quality Inspection
- 10.4.5. Mapping & Navigation
- 10.4.6. Others
- 10.5. Market Analysis, Insights and Forecast - by End User
- 10.5.1. Consumer Electronics
- 10.5.2. Automotive
- 10.5.3. Industrial
- 10.5.4. Healthcare
- 10.5.5. Aerospace & Defense
- 10.5.6. Others
- 10.1. Market Analysis, Insights and Forecast - by Technology
- 11. Asia Pacific 3d Sensing Technology Analysis, Insights and Forecast, 2020-2032
- 11.1. Market Analysis, Insights and Forecast - by Technology
- 11.1.1. Time-of-Flight (ToF)
- 11.1.2. Structured Light
- 11.1.3. Stereoscopic Vision
- 11.1.4. Ultrasound
- 11.1.5. Others
- 11.2. Market Analysis, Insights and Forecast - by Sensor Type
- 11.2.1. Image Sensors
- 11.2.2. Position Sensors
- 11.2.3. Proximity Sensors
- 11.2.4. Acoustic Sensors
- 11.2.5. Accelerometers/Gyroscopes
- 11.2.6. Others
- 11.3. Market Analysis, Insights and Forecast - by Connectivity
- 11.3.1. Wired
- 11.3.2. Wireless
- 11.4. Market Analysis, Insights and Forecast - by Application
- 11.4.1. Facial Recognition
- 11.4.2. Gesture Recognition
- 11.4.3. Object Detection
- 11.4.4. Quality Inspection
- 11.4.5. Mapping & Navigation
- 11.4.6. Others
- 11.5. Market Analysis, Insights and Forecast - by End User
- 11.5.1. Consumer Electronics
- 11.5.2. Automotive
- 11.5.3. Industrial
- 11.5.4. Healthcare
- 11.5.5. Aerospace & Defense
- 11.5.6. Others
- 11.1. Market Analysis, Insights and Forecast - by Technology
- 12. Competitive Analysis
- 12.1. Company Profiles
- 12.1.1 Sony Group Corporation
- 12.1.1.1. Company Overview
- 12.1.1.2. Products
- 12.1.1.3. Company Financials
- 12.1.1.4. SWOT Analysis
- 12.1.2 Apple Inc.
- 12.1.2.1. Company Overview
- 12.1.2.2. Products
- 12.1.2.3. Company Financials
- 12.1.2.4. SWOT Analysis
- 12.1.3 Intel Corporation
- 12.1.3.1. Company Overview
- 12.1.3.2. Products
- 12.1.3.3. Company Financials
- 12.1.3.4. SWOT Analysis
- 12.1.4 Infineon Technologies AG
- 12.1.4.1. Company Overview
- 12.1.4.2. Products
- 12.1.4.3. Company Financials
- 12.1.4.4. SWOT Analysis
- 12.1.5 STMicroelectronics
- 12.1.5.1. Company Overview
- 12.1.5.2. Products
- 12.1.5.3. Company Financials
- 12.1.5.4. SWOT Analysis
- 12.1.6 Texas Instruments Incorporated
- 12.1.6.1. Company Overview
- 12.1.6.2. Products
- 12.1.6.3. Company Financials
- 12.1.6.4. SWOT Analysis
- 12.1.7 Microsoft Corporation
- 12.1.7.1. Company Overview
- 12.1.7.2. Products
- 12.1.7.3. Company Financials
- 12.1.7.4. SWOT Analysis
- 12.1.8 OmniVision Technologies Inc.
- 12.1.8.1. Company Overview
- 12.1.8.2. Products
- 12.1.8.3. Company Financials
- 12.1.8.4. SWOT Analysis
- 12.1.9 Lumentum Holdings Inc.
- 12.1.9.1. Company Overview
- 12.1.9.2. Products
- 12.1.9.3. Company Financials
- 12.1.9.4. SWOT Analysis
- 12.1.10 Basler AG
- 12.1.10.1. Company Overview
- 12.1.10.2. Products
- 12.1.10.3. Company Financials
- 12.1.10.4. SWOT Analysis
- 12.1.11 Cognex Corporation
- 12.1.11.1. Company Overview
- 12.1.11.2. Products
- 12.1.11.3. Company Financials
- 12.1.11.4. SWOT Analysis
- 12.1.12 Teledyne Technologies Incorporated
- 12.1.12.1. Company Overview
- 12.1.12.2. Products
- 12.1.12.3. Company Financials
- 12.1.12.4. SWOT Analysis
- 12.1.13
- 12.1.13.1. Company Overview
- 12.1.13.2. Products
- 12.1.13.3. Company Financials
- 12.1.13.4. SWOT Analysis
- 12.1.1 Sony Group Corporation
- 12.2. Market Entropy
- 12.2.1 Company's Key Areas Served
- 12.2.2 Recent Developments
- 12.3. Company Market Share Analysis 2025
- 12.3.1 Top 5 Companies Market Share Analysis
- 12.3.2 Top 3 Companies Market Share Analysis
- 12.4. List of Potential Customers
- 13. Research Methodology
List of Figures
- Figure 1: Global 3d Sensing Technology Revenue Breakdown (million, %) by Region 2025 & 2033
- Figure 2: North America 3d Sensing Technology Revenue (million), by Technology 2025 & 2033
- Figure 3: North America 3d Sensing Technology Revenue Share (%), by Technology 2025 & 2033
- Figure 4: North America 3d Sensing Technology Revenue (million), by Sensor Type 2025 & 2033
- Figure 5: North America 3d Sensing Technology Revenue Share (%), by Sensor Type 2025 & 2033
- Figure 6: North America 3d Sensing Technology Revenue (million), by Connectivity 2025 & 2033
- Figure 7: North America 3d Sensing Technology Revenue Share (%), by Connectivity 2025 & 2033
- Figure 8: North America 3d Sensing Technology Revenue (million), by Application 2025 & 2033
- Figure 9: North America 3d Sensing Technology Revenue Share (%), by Application 2025 & 2033
- Figure 10: North America 3d Sensing Technology Revenue (million), by End User 2025 & 2033
- Figure 11: North America 3d Sensing Technology Revenue Share (%), by End User 2025 & 2033
- Figure 12: North America 3d Sensing Technology Revenue (million), by Country 2025 & 2033
- Figure 13: North America 3d Sensing Technology Revenue Share (%), by Country 2025 & 2033
- Figure 14: South America 3d Sensing Technology Revenue (million), by Technology 2025 & 2033
- Figure 15: South America 3d Sensing Technology Revenue Share (%), by Technology 2025 & 2033
- Figure 16: South America 3d Sensing Technology Revenue (million), by Sensor Type 2025 & 2033
- Figure 17: South America 3d Sensing Technology Revenue Share (%), by Sensor Type 2025 & 2033
- Figure 18: South America 3d Sensing Technology Revenue (million), by Connectivity 2025 & 2033
- Figure 19: South America 3d Sensing Technology Revenue Share (%), by Connectivity 2025 & 2033
- Figure 20: South America 3d Sensing Technology Revenue (million), by Application 2025 & 2033
- Figure 21: South America 3d Sensing Technology Revenue Share (%), by Application 2025 & 2033
- Figure 22: South America 3d Sensing Technology Revenue (million), by End User 2025 & 2033
- Figure 23: South America 3d Sensing Technology Revenue Share (%), by End User 2025 & 2033
- Figure 24: South America 3d Sensing Technology Revenue (million), by Country 2025 & 2033
- Figure 25: South America 3d Sensing Technology Revenue Share (%), by Country 2025 & 2033
- Figure 26: Europe 3d Sensing Technology Revenue (million), by Technology 2025 & 2033
- Figure 27: Europe 3d Sensing Technology Revenue Share (%), by Technology 2025 & 2033
- Figure 28: Europe 3d Sensing Technology Revenue (million), by Sensor Type 2025 & 2033
- Figure 29: Europe 3d Sensing Technology Revenue Share (%), by Sensor Type 2025 & 2033
- Figure 30: Europe 3d Sensing Technology Revenue (million), by Connectivity 2025 & 2033
- Figure 31: Europe 3d Sensing Technology Revenue Share (%), by Connectivity 2025 & 2033
- Figure 32: Europe 3d Sensing Technology Revenue (million), by Application 2025 & 2033
- Figure 33: Europe 3d Sensing Technology Revenue Share (%), by Application 2025 & 2033
- Figure 34: Europe 3d Sensing Technology Revenue (million), by End User 2025 & 2033
- Figure 35: Europe 3d Sensing Technology Revenue Share (%), by End User 2025 & 2033
- Figure 36: Europe 3d Sensing Technology Revenue (million), by Country 2025 & 2033
- Figure 37: Europe 3d Sensing Technology Revenue Share (%), by Country 2025 & 2033
- Figure 38: Middle East & Africa 3d Sensing Technology Revenue (million), by Technology 2025 & 2033
- Figure 39: Middle East & Africa 3d Sensing Technology Revenue Share (%), by Technology 2025 & 2033
- Figure 40: Middle East & Africa 3d Sensing Technology Revenue (million), by Sensor Type 2025 & 2033
- Figure 41: Middle East & Africa 3d Sensing Technology Revenue Share (%), by Sensor Type 2025 & 2033
- Figure 42: Middle East & Africa 3d Sensing Technology Revenue (million), by Connectivity 2025 & 2033
- Figure 43: Middle East & Africa 3d Sensing Technology Revenue Share (%), by Connectivity 2025 & 2033
- Figure 44: Middle East & Africa 3d Sensing Technology Revenue (million), by Application 2025 & 2033
- Figure 45: Middle East & Africa 3d Sensing Technology Revenue Share (%), by Application 2025 & 2033
- Figure 46: Middle East & Africa 3d Sensing Technology Revenue (million), by End User 2025 & 2033
- Figure 47: Middle East & Africa 3d Sensing Technology Revenue Share (%), by End User 2025 & 2033
- Figure 48: Middle East & Africa 3d Sensing Technology Revenue (million), by Country 2025 & 2033
- Figure 49: Middle East & Africa 3d Sensing Technology Revenue Share (%), by Country 2025 & 2033
- Figure 50: Asia Pacific 3d Sensing Technology Revenue (million), by Technology 2025 & 2033
- Figure 51: Asia Pacific 3d Sensing Technology Revenue Share (%), by Technology 2025 & 2033
- Figure 52: Asia Pacific 3d Sensing Technology Revenue (million), by Sensor Type 2025 & 2033
- Figure 53: Asia Pacific 3d Sensing Technology Revenue Share (%), by Sensor Type 2025 & 2033
- Figure 54: Asia Pacific 3d Sensing Technology Revenue (million), by Connectivity 2025 & 2033
- Figure 55: Asia Pacific 3d Sensing Technology Revenue Share (%), by Connectivity 2025 & 2033
- Figure 56: Asia Pacific 3d Sensing Technology Revenue (million), by Application 2025 & 2033
- Figure 57: Asia Pacific 3d Sensing Technology Revenue Share (%), by Application 2025 & 2033
- Figure 58: Asia Pacific 3d Sensing Technology Revenue (million), by End User 2025 & 2033
- Figure 59: Asia Pacific 3d Sensing Technology Revenue Share (%), by End User 2025 & 2033
- Figure 60: Asia Pacific 3d Sensing Technology Revenue (million), by Country 2025 & 2033
- Figure 61: Asia Pacific 3d Sensing Technology Revenue Share (%), by Country 2025 & 2033
List of Tables
- Table 1: Global 3d Sensing Technology Revenue million Forecast, by Technology 2020 & 2033
- Table 2: Global 3d Sensing Technology Revenue million Forecast, by Sensor Type 2020 & 2033
- Table 3: Global 3d Sensing Technology Revenue million Forecast, by Connectivity 2020 & 2033
- Table 4: Global 3d Sensing Technology Revenue million Forecast, by Application 2020 & 2033
- Table 5: Global 3d Sensing Technology Revenue million Forecast, by End User 2020 & 2033
- Table 6: Global 3d Sensing Technology Revenue million Forecast, by Region 2020 & 2033
- Table 7: Global 3d Sensing Technology Revenue million Forecast, by Technology 2020 & 2033
- Table 8: Global 3d Sensing Technology Revenue million Forecast, by Sensor Type 2020 & 2033
- Table 9: Global 3d Sensing Technology Revenue million Forecast, by Connectivity 2020 & 2033
- Table 10: Global 3d Sensing Technology Revenue million Forecast, by Application 2020 & 2033
- Table 11: Global 3d Sensing Technology Revenue million Forecast, by End User 2020 & 2033
- Table 12: Global 3d Sensing Technology Revenue million Forecast, by Country 2020 & 2033
- Table 13: United States 3d Sensing Technology Revenue (million) Forecast, by Application 2020 & 2033
- Table 14: Canada 3d Sensing Technology Revenue (million) Forecast, by Application 2020 & 2033
- Table 15: Mexico 3d Sensing Technology Revenue (million) Forecast, by Application 2020 & 2033
- Table 16: Global 3d Sensing Technology Revenue million Forecast, by Technology 2020 & 2033
- Table 17: Global 3d Sensing Technology Revenue million Forecast, by Sensor Type 2020 & 2033
- Table 18: Global 3d Sensing Technology Revenue million Forecast, by Connectivity 2020 & 2033
- Table 19: Global 3d Sensing Technology Revenue million Forecast, by Application 2020 & 2033
- Table 20: Global 3d Sensing Technology Revenue million Forecast, by End User 2020 & 2033
- Table 21: Global 3d Sensing Technology Revenue million Forecast, by Country 2020 & 2033
- Table 22: Brazil 3d Sensing Technology Revenue (million) Forecast, by Application 2020 & 2033
- Table 23: Argentina 3d Sensing Technology Revenue (million) Forecast, by Application 2020 & 2033
- Table 24: Rest of South America 3d Sensing Technology Revenue (million) Forecast, by Application 2020 & 2033
- Table 25: Global 3d Sensing Technology Revenue million Forecast, by Technology 2020 & 2033
- Table 26: Global 3d Sensing Technology Revenue million Forecast, by Sensor Type 2020 & 2033
- Table 27: Global 3d Sensing Technology Revenue million Forecast, by Connectivity 2020 & 2033
- Table 28: Global 3d Sensing Technology Revenue million Forecast, by Application 2020 & 2033
- Table 29: Global 3d Sensing Technology Revenue million Forecast, by End User 2020 & 2033
- Table 30: Global 3d Sensing Technology Revenue million Forecast, by Country 2020 & 2033
- Table 31: United Kingdom 3d Sensing Technology Revenue (million) Forecast, by Application 2020 & 2033
- Table 32: Germany 3d Sensing Technology Revenue (million) Forecast, by Application 2020 & 2033
- Table 33: France 3d Sensing Technology Revenue (million) Forecast, by Application 2020 & 2033
- Table 34: Italy 3d Sensing Technology Revenue (million) Forecast, by Application 2020 & 2033
- Table 35: Spain 3d Sensing Technology Revenue (million) Forecast, by Application 2020 & 2033
- Table 36: Russia 3d Sensing Technology Revenue (million) Forecast, by Application 2020 & 2033
- Table 37: Benelux 3d Sensing Technology Revenue (million) Forecast, by Application 2020 & 2033
- Table 38: Nordics 3d Sensing Technology Revenue (million) Forecast, by Application 2020 & 2033
- Table 39: Rest of Europe 3d Sensing Technology Revenue (million) Forecast, by Application 2020 & 2033
- Table 40: Global 3d Sensing Technology Revenue million Forecast, by Technology 2020 & 2033
- Table 41: Global 3d Sensing Technology Revenue million Forecast, by Sensor Type 2020 & 2033
- Table 42: Global 3d Sensing Technology Revenue million Forecast, by Connectivity 2020 & 2033
- Table 43: Global 3d Sensing Technology Revenue million Forecast, by Application 2020 & 2033
- Table 44: Global 3d Sensing Technology Revenue million Forecast, by End User 2020 & 2033
- Table 45: Global 3d Sensing Technology Revenue million Forecast, by Country 2020 & 2033
- Table 46: Turkey 3d Sensing Technology Revenue (million) Forecast, by Application 2020 & 2033
- Table 47: Israel 3d Sensing Technology Revenue (million) Forecast, by Application 2020 & 2033
- Table 48: GCC 3d Sensing Technology Revenue (million) Forecast, by Application 2020 & 2033
- Table 49: North Africa 3d Sensing Technology Revenue (million) Forecast, by Application 2020 & 2033
- Table 50: South Africa 3d Sensing Technology Revenue (million) Forecast, by Application 2020 & 2033
- Table 51: Rest of Middle East & Africa 3d Sensing Technology Revenue (million) Forecast, by Application 2020 & 2033
- Table 52: Global 3d Sensing Technology Revenue million Forecast, by Technology 2020 & 2033
- Table 53: Global 3d Sensing Technology Revenue million Forecast, by Sensor Type 2020 & 2033
- Table 54: Global 3d Sensing Technology Revenue million Forecast, by Connectivity 2020 & 2033
- Table 55: Global 3d Sensing Technology Revenue million Forecast, by Application 2020 & 2033
- Table 56: Global 3d Sensing Technology Revenue million Forecast, by End User 2020 & 2033
- Table 57: Global 3d Sensing Technology Revenue million Forecast, by Country 2020 & 2033
- Table 58: China 3d Sensing Technology Revenue (million) Forecast, by Application 2020 & 2033
- Table 59: India 3d Sensing Technology Revenue (million) Forecast, by Application 2020 & 2033
- Table 60: Japan 3d Sensing Technology Revenue (million) Forecast, by Application 2020 & 2033
- Table 61: South Korea 3d Sensing Technology Revenue (million) Forecast, by Application 2020 & 2033
- Table 62: ASEAN 3d Sensing Technology Revenue (million) Forecast, by Application 2020 & 2033
- Table 63: Oceania 3d Sensing Technology Revenue (million) Forecast, by Application 2020 & 2033
- Table 64: Rest of Asia Pacific 3d Sensing Technology Revenue (million) Forecast, by Application 2020 & 2033
Frequently Asked Questions
1. What is the projected Compound Annual Growth Rate (CAGR) of the 3d Sensing Technology?
The projected CAGR is approximately 12%.
2. Which companies are prominent players in the 3d Sensing Technology?
Key companies in the market include Sony Group Corporation, Apple Inc., Intel Corporation, Infineon Technologies AG, STMicroelectronics, Texas Instruments Incorporated, Microsoft Corporation, OmniVision Technologies, Inc., Lumentum Holdings Inc., Basler AG, Cognex Corporation, Teledyne Technologies Incorporated, .
3. What are the main segments of the 3d Sensing Technology?
The market segments include Technology, Sensor Type, Connectivity, Application, End User.
4. Can you provide details about the market size?
The market size is estimated to be USD 2958 million as of 2022.
5. What are some drivers contributing to market growth?
N/A
6. What are the notable trends driving market growth?
N/A
7. Are there any restraints impacting market growth?
N/A
8. Can you provide examples of recent developments in the market?
N/A
9. What pricing options are available for accessing the report?
Pricing options include single-user, multi-user, and enterprise licenses priced at USD 2900.00, USD 4350.00, and USD 5800.00 respectively.
10. Is the market size provided in terms of value or volume?
The market size is provided in terms of value, measured in million.
11. Are there any specific market keywords associated with the report?
Yes, the market keyword associated with the report is "3d Sensing Technology," which aids in identifying and referencing the specific market segment covered.
12. How do I determine which pricing option suits my needs best?
The pricing options vary based on user requirements and access needs. Individual users may opt for single-user licenses, while businesses requiring broader access may choose multi-user or enterprise licenses for cost-effective access to the report.
13. Are there any additional resources or data provided in the 3d Sensing Technology report?
While the report offers comprehensive insights, it's advisable to review the specific contents or supplementary materials provided to ascertain if additional resources or data are available.
14. How can I stay updated on further developments or reports in the 3d Sensing Technology?
To stay informed about further developments, trends, and reports in the 3d Sensing Technology, consider subscribing to industry newsletters, following relevant companies and organizations, or regularly checking reputable industry news sources and publications.
Methodology
Step 1 - Identification of Relevant Samples Size from Population Database


Step 2 - Approaches for Defining Global Market Size (Value, Volume* & Price*)

Note*: In applicable scenarios
Step 3 - Data Sources
Primary Research
- Web Analytics
- Survey Reports
- Research Institute
- Latest Research Reports
- Opinion Leaders
Secondary Research
- Annual Reports
- White Paper
- Latest Press Release
- Industry Association
- Paid Database
- Investor Presentations

Step 4 - Data Triangulation
Involves using different sources of information in order to increase the validity of a study
These sources are likely to be stakeholders in a program - participants, other researchers, program staff, other community members, and so on.
Then we put all data in single framework & apply various statistical tools to find out the dynamic on the market.
During the analysis stage, feedback from the stakeholder groups would be compared to determine areas of agreement as well as areas of divergence