

Key Insights
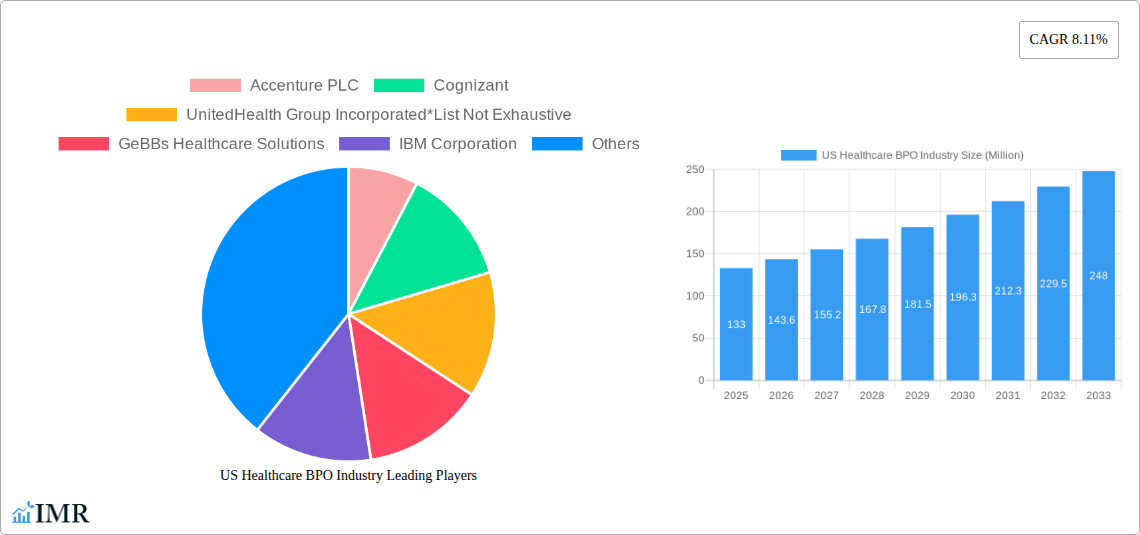
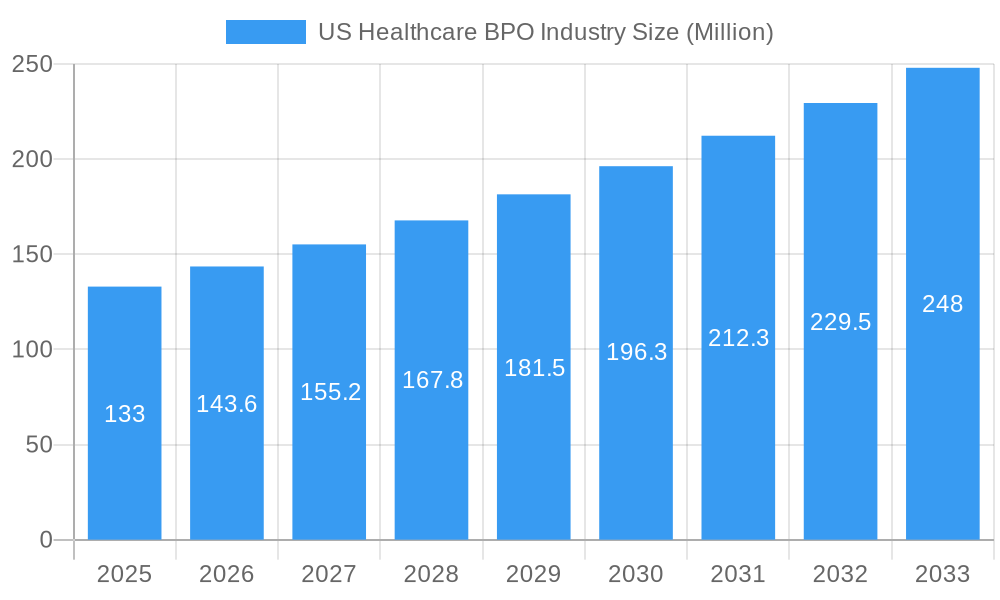
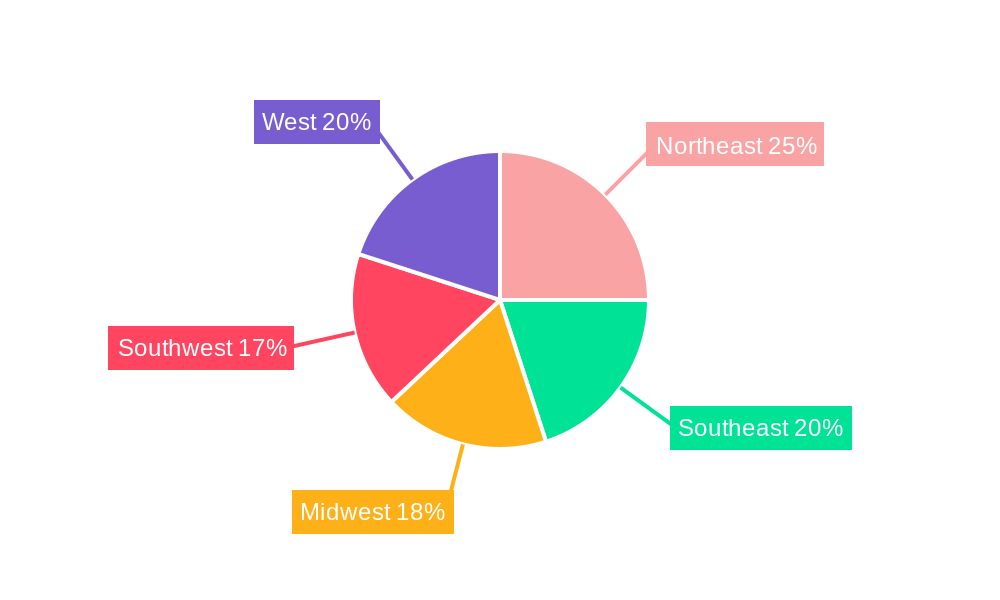
The US healthcare business process outsourcing (BPO) industry is experiencing robust growth, projected to reach a market size of $133 million in 2025, expanding at a compound annual growth rate (CAGR) of 8.11% from 2025 to 2033. This expansion is driven by several key factors. The increasing complexity of healthcare regulations and administrative tasks necessitates outsourcing non-core functions to specialized BPO providers. Simultaneously, the rising demand for improved operational efficiency and cost reduction within healthcare organizations fuels the adoption of BPO services across various segments. Specifically, the segments of patient enrollment, revenue cycle management, and claims management are experiencing particularly strong growth, as healthcare providers and payers seek to optimize their financial performance and patient experience. Technological advancements, such as the increasing adoption of cloud-based solutions and artificial intelligence (AI), further contribute to this growth, enabling BPO providers to offer more sophisticated and cost-effective services. The industry's regional distribution shows a significant concentration in the United States, particularly across various regions including the Northeast, Southeast, Midwest, Southwest, and West, with specific regional growth rates likely influenced by factors such as population density, healthcare infrastructure, and the concentration of healthcare organizations.
US Healthcare BPO Industry Market Size (In Million)
The competitive landscape is characterized by a mix of large multinational corporations and specialized healthcare BPO providers. Major players like Accenture, Cognizant, and UnitedHealth Group are leveraging their scale and expertise to capture significant market share. However, smaller, specialized firms often focus on niche services, offering competitive advantages in specific areas. Future growth will likely be influenced by factors such as the evolving regulatory environment, technological innovation, and the continued emphasis on improving healthcare quality and efficiency. The industry faces potential restraints such as data security concerns and the need for robust compliance measures. Despite these challenges, the long-term outlook for the US healthcare BPO market remains positive, driven by the ongoing need for improved operational efficiency and cost optimization within the healthcare sector. Continued innovation and the adoption of advanced technologies will be crucial for success in this rapidly evolving market.
US Healthcare BPO Industry Company Market Share
US Healthcare BPO Industry Market Report: 2019-2033
This comprehensive report provides an in-depth analysis of the US Healthcare Business Process Outsourcing (BPO) industry, covering market dynamics, growth trends, key players, and future opportunities. With a study period spanning 2019-2033, a base year of 2025, and a forecast period of 2025-2033, this report is an essential resource for industry professionals, investors, and strategic decision-makers. The report analyzes both parent market (Healthcare BPO) and child markets (Provider Services, Pharmaceutical Services, Payer Services) to provide a granular understanding of this dynamic sector. The market size is valued in Millions of US dollars.
US Healthcare BPO Industry Market Dynamics & Structure
The US Healthcare BPO market is characterized by a moderately concentrated landscape with several large players vying for market share. Technological innovation, particularly in AI and automation, is a major driver, alongside stringent regulatory frameworks like HIPAA. Competitive substitutes include in-house solutions, although the cost and efficiency advantages of outsourcing often tip the balance. The end-user demographic encompasses hospitals, clinics, pharmaceutical companies, and health insurance providers. M&A activity has been significant, contributing to market consolidation.
- Market Concentration: The top 5 players hold an estimated xx% market share in 2025.
- Technological Innovation: AI-powered solutions for claims processing and patient engagement are driving growth.
- Regulatory Framework: HIPAA compliance significantly impacts operational costs and strategies.
- M&A Activity: An estimated xx M&A deals occurred between 2019 and 2024, with deal volume expected to increase to xx by 2033.
- Innovation Barriers: High initial investment costs and integration challenges hinder wider adoption of advanced technologies.
US Healthcare BPO Industry Growth Trends & Insights
The US Healthcare BPO market experienced robust growth between 2019 and 2024, with a CAGR of xx%. This growth is attributed to increasing healthcare data volumes, rising demand for cost-effective solutions, and the growing adoption of cloud-based technologies. Technological disruptions, such as AI-driven automation and robotic process automation (RPA), are significantly impacting operational efficiency and accelerating market expansion. Shifting consumer behavior, with a greater emphasis on personalized healthcare and improved patient experience, further fuels the demand for specialized BPO services. Market penetration is expected to reach xx% by 2033, driven by factors such as increasing adoption of value-based care models and the rising prevalence of chronic diseases. The market size is projected to reach xx Million in 2025 and xx Million by 2033.
Dominant Regions, Countries, or Segments in US Healthcare BPO Industry
The Northeast and West Coast regions of the US dominate the Healthcare BPO market due to high concentrations of healthcare providers and technology companies. Within service segments, Revenue Cycle Management (RCM) and Claims Management are the largest and fastest-growing segments within the Payer Services sector, driven by increasing regulatory complexity and the need to optimize reimbursement processes. Provider Services, particularly Patient Enrollment and Strategic Planning, also displays strong growth potential.
- Key Drivers (RCM & Claims Management): Stringent regulatory requirements, increasing complexity of billing and coding, and the need for improved operational efficiency.
- Dominance Factors (Northeast & West Coast): High concentration of healthcare providers and technology infrastructure, coupled with a skilled workforce.
- Growth Potential (Patient Enrollment & Strategic Planning): Rising demand for personalized healthcare and proactive patient engagement strategies.
US Healthcare BPO Industry Product Landscape
The US Healthcare BPO product landscape is evolving rapidly, with a strong emphasis on cloud-based solutions, AI-powered automation, and data analytics. Products are designed to streamline workflows, improve accuracy, reduce costs, and enhance patient experiences. Unique selling propositions often include specialized industry expertise, secure data management, and customizable solutions tailored to client needs. Advancements in predictive analytics are enabling more effective risk stratification and proactive care management.
Key Drivers, Barriers & Challenges in US Healthcare BPO Industry
Key Drivers: Increasing healthcare data volumes, the growing adoption of value-based care models, the need for improved operational efficiency, and the rising demand for cost-effective solutions are key drivers. Technological advancements like AI and automation are further accelerating market growth.
Key Challenges: Stringent regulatory compliance (HIPAA), data security concerns, talent acquisition and retention difficulties, and the integration of legacy systems present significant challenges. Supply chain disruptions can impact the delivery of services.
Emerging Opportunities in US Healthcare BPO Industry
Emerging opportunities lie in the areas of telehealth, remote patient monitoring, and precision medicine. The expansion of value-based care models creates demand for specialized BPO services to manage population health and care coordination. The increasing use of AI-powered chatbots and virtual assistants for patient engagement represents another area of significant growth potential.
Growth Accelerators in the US Healthcare BPO Industry Industry
Strategic partnerships between BPO providers and healthcare organizations are crucial for market expansion. Technological breakthroughs in AI and machine learning are driving efficiency improvements and creating new service offerings. Market expansion into underserved areas and the development of specialized solutions tailored to specific healthcare segments will further accelerate growth.
Key Players Shaping the US Healthcare BPO Industry Market
- Accenture PLC
- Cognizant
- UnitedHealth Group Incorporated
- GeBBs Healthcare Solutions
- IBM Corporation
- Sutherland Healthcare Solutions
- Parexel International
- IQVIA
- Capgemini
- Genpact Limited
Notable Milestones in US Healthcare BPO Industry Sector
- May 2023: Atento recognized as a leader in Frost Radar for Customer Experience and Outsourcing services in Latin America.
- March 2022: CPSI acquires Healthcare Resource Group Inc., expanding its RCM capabilities.
In-Depth US Healthcare BPO Industry Market Outlook
The US Healthcare BPO market is poised for continued robust growth, driven by technological advancements, increasing demand for specialized services, and the expansion of value-based care models. Strategic partnerships and investments in innovation will be key factors in shaping the future competitive landscape. The market’s potential for expansion is significant, particularly in the areas of telehealth, remote patient monitoring, and precision medicine.
US Healthcare BPO Industry Segmentation
-
1. Payer Service
- 1.1. Human Resource Management
- 1.2. Claims Management
- 1.3. Customer Relationship Management (CRM)
- 1.4. Operational/Administrative Management
- 1.5. Care Management
- 1.6. Provider Management
- 1.7. Other Payer Services
-
2. Pharmaceutical Service
- 2.1. Research and Development
- 2.2. Manufacturing
-
2.3. Non-clinical Services
- 2.3.1. Supply Chain Management and Logistics
- 2.3.2. Sales and Marketing Services
- 2.3.3. Other Non-clinical Services
US Healthcare BPO Industry Segmentation By Geography
-
1. North America
- 1.1. United States
- 1.2. Canada
- 1.3. Mexico
-
2. South America
- 2.1. Brazil
- 2.2. Argentina
- 2.3. Rest of South America
-
3. Europe
- 3.1. United Kingdom
- 3.2. Germany
- 3.3. France
- 3.4. Italy
- 3.5. Spain
- 3.6. Russia
- 3.7. Benelux
- 3.8. Nordics
- 3.9. Rest of Europe
-
4. Middle East & Africa
- 4.1. Turkey
- 4.2. Israel
- 4.3. GCC
- 4.4. North Africa
- 4.5. South Africa
- 4.6. Rest of Middle East & Africa
-
5. Asia Pacific
- 5.1. China
- 5.2. India
- 5.3. Japan
- 5.4. South Korea
- 5.5. ASEAN
- 5.6. Oceania
- 5.7. Rest of Asia Pacific
US Healthcare BPO Industry Regional Market Share
Geographic Coverage of US Healthcare BPO Industry
US Healthcare BPO Industry REPORT HIGHLIGHTS
| Aspects | Details |
|---|---|
| Study Period | 2020-2034 |
| Base Year | 2025 |
| Estimated Year | 2026 |
| Forecast Period | 2026-2034 |
| Historical Period | 2020-2025 |
| Growth Rate | CAGR of 8.11% from 2020-2034 |
| Segmentation |
|
Table of Contents
- 1. Introduction
- 1.1. Research Scope
- 1.2. Market Segmentation
- 1.3. Research Objective
- 1.4. Definitions and Assumptions
- 2. Executive Summary
- 2.1. Market Snapshot
- 3. Market Dynamics
- 3.1. Market Drivers
- 3.2. Market Restrains
- 3.3. Market Trends
- 3.4. Market Opportunities
- 4. Market Factor Analysis
- 4.1. Porters Five Forces
- 4.1.1. Bargaining Power of Suppliers
- 4.1.2. Bargaining Power of Buyers
- 4.1.3. Threat of New Entrants
- 4.1.4. Threat of Substitutes
- 4.1.5. Competitive Rivalry
- 4.2. PESTEL analysis
- 4.3. BCG Analysis
- 4.3.1. Stars (High Growth, High Market Share)
- 4.3.2. Cash Cows (Low Growth, High Market Share)
- 4.3.3. Question Mark (High Growth, Low Market Share)
- 4.3.4. Dogs (Low Growth, Low Market Share)
- 4.4. Ansoff Matrix Analysis
- 4.5. Supply Chain Analysis
- 4.6. Regulatory Landscape
- 4.7. Current Market Potential and Opportunity Assessment (TAM–SAM–SOM Framework)
- 4.8. IMR Analyst Note
- 4.1. Porters Five Forces
- 5. Market Analysis, Insights and Forecast 2021-2033
- 5.1. Market Analysis, Insights and Forecast - by Payer Service
- 5.1.1. Human Resource Management
- 5.1.2. Claims Management
- 5.1.3. Customer Relationship Management (CRM)
- 5.1.4. Operational/Administrative Management
- 5.1.5. Care Management
- 5.1.6. Provider Management
- 5.1.7. Other Payer Services
- 5.2. Market Analysis, Insights and Forecast - by Pharmaceutical Service
- 5.2.1. Research and Development
- 5.2.2. Manufacturing
- 5.2.3. Non-clinical Services
- 5.2.3.1. Supply Chain Management and Logistics
- 5.2.3.2. Sales and Marketing Services
- 5.2.3.3. Other Non-clinical Services
- 5.3. Market Analysis, Insights and Forecast - by Region
- 5.3.1. North America
- 5.3.2. South America
- 5.3.3. Europe
- 5.3.4. Middle East & Africa
- 5.3.5. Asia Pacific
- 5.1. Market Analysis, Insights and Forecast - by Payer Service
- 6. Global US Healthcare BPO Industry Analysis, Insights and Forecast, 2021-2033
- 6.1. Market Analysis, Insights and Forecast - by Payer Service
- 6.1.1. Human Resource Management
- 6.1.2. Claims Management
- 6.1.3. Customer Relationship Management (CRM)
- 6.1.4. Operational/Administrative Management
- 6.1.5. Care Management
- 6.1.6. Provider Management
- 6.1.7. Other Payer Services
- 6.2. Market Analysis, Insights and Forecast - by Pharmaceutical Service
- 6.2.1. Research and Development
- 6.2.2. Manufacturing
- 6.2.3. Non-clinical Services
- 6.2.3.1. Supply Chain Management and Logistics
- 6.2.3.2. Sales and Marketing Services
- 6.2.3.3. Other Non-clinical Services
- 6.1. Market Analysis, Insights and Forecast - by Payer Service
- 7. North America US Healthcare BPO Industry Analysis, Insights and Forecast, 2020-2032
- 7.1. Market Analysis, Insights and Forecast - by Payer Service
- 7.1.1. Human Resource Management
- 7.1.2. Claims Management
- 7.1.3. Customer Relationship Management (CRM)
- 7.1.4. Operational/Administrative Management
- 7.1.5. Care Management
- 7.1.6. Provider Management
- 7.1.7. Other Payer Services
- 7.2. Market Analysis, Insights and Forecast - by Pharmaceutical Service
- 7.2.1. Research and Development
- 7.2.2. Manufacturing
- 7.2.3. Non-clinical Services
- 7.2.3.1. Supply Chain Management and Logistics
- 7.2.3.2. Sales and Marketing Services
- 7.2.3.3. Other Non-clinical Services
- 7.1. Market Analysis, Insights and Forecast - by Payer Service
- 8. South America US Healthcare BPO Industry Analysis, Insights and Forecast, 2020-2032
- 8.1. Market Analysis, Insights and Forecast - by Payer Service
- 8.1.1. Human Resource Management
- 8.1.2. Claims Management
- 8.1.3. Customer Relationship Management (CRM)
- 8.1.4. Operational/Administrative Management
- 8.1.5. Care Management
- 8.1.6. Provider Management
- 8.1.7. Other Payer Services
- 8.2. Market Analysis, Insights and Forecast - by Pharmaceutical Service
- 8.2.1. Research and Development
- 8.2.2. Manufacturing
- 8.2.3. Non-clinical Services
- 8.2.3.1. Supply Chain Management and Logistics
- 8.2.3.2. Sales and Marketing Services
- 8.2.3.3. Other Non-clinical Services
- 8.1. Market Analysis, Insights and Forecast - by Payer Service
- 9. Europe US Healthcare BPO Industry Analysis, Insights and Forecast, 2020-2032
- 9.1. Market Analysis, Insights and Forecast - by Payer Service
- 9.1.1. Human Resource Management
- 9.1.2. Claims Management
- 9.1.3. Customer Relationship Management (CRM)
- 9.1.4. Operational/Administrative Management
- 9.1.5. Care Management
- 9.1.6. Provider Management
- 9.1.7. Other Payer Services
- 9.2. Market Analysis, Insights and Forecast - by Pharmaceutical Service
- 9.2.1. Research and Development
- 9.2.2. Manufacturing
- 9.2.3. Non-clinical Services
- 9.2.3.1. Supply Chain Management and Logistics
- 9.2.3.2. Sales and Marketing Services
- 9.2.3.3. Other Non-clinical Services
- 9.1. Market Analysis, Insights and Forecast - by Payer Service
- 10. Middle East & Africa US Healthcare BPO Industry Analysis, Insights and Forecast, 2020-2032
- 10.1. Market Analysis, Insights and Forecast - by Payer Service
- 10.1.1. Human Resource Management
- 10.1.2. Claims Management
- 10.1.3. Customer Relationship Management (CRM)
- 10.1.4. Operational/Administrative Management
- 10.1.5. Care Management
- 10.1.6. Provider Management
- 10.1.7. Other Payer Services
- 10.2. Market Analysis, Insights and Forecast - by Pharmaceutical Service
- 10.2.1. Research and Development
- 10.2.2. Manufacturing
- 10.2.3. Non-clinical Services
- 10.2.3.1. Supply Chain Management and Logistics
- 10.2.3.2. Sales and Marketing Services
- 10.2.3.3. Other Non-clinical Services
- 10.1. Market Analysis, Insights and Forecast - by Payer Service
- 11. Asia Pacific US Healthcare BPO Industry Analysis, Insights and Forecast, 2020-2032
- 11.1. Market Analysis, Insights and Forecast - by Payer Service
- 11.1.1. Human Resource Management
- 11.1.2. Claims Management
- 11.1.3. Customer Relationship Management (CRM)
- 11.1.4. Operational/Administrative Management
- 11.1.5. Care Management
- 11.1.6. Provider Management
- 11.1.7. Other Payer Services
- 11.2. Market Analysis, Insights and Forecast - by Pharmaceutical Service
- 11.2.1. Research and Development
- 11.2.2. Manufacturing
- 11.2.3. Non-clinical Services
- 11.2.3.1. Supply Chain Management and Logistics
- 11.2.3.2. Sales and Marketing Services
- 11.2.3.3. Other Non-clinical Services
- 11.1. Market Analysis, Insights and Forecast - by Payer Service
- 12. Competitive Analysis
- 12.1. Company Profiles
- 12.1.1 Accenture PLC
- 12.1.1.1. Company Overview
- 12.1.1.2. Products
- 12.1.1.3. Company Financials
- 12.1.1.4. SWOT Analysis
- 12.1.2 Cognizant
- 12.1.2.1. Company Overview
- 12.1.2.2. Products
- 12.1.2.3. Company Financials
- 12.1.2.4. SWOT Analysis
- 12.1.3 UnitedHealth Group Incorporated*List Not Exhaustive
- 12.1.3.1. Company Overview
- 12.1.3.2. Products
- 12.1.3.3. Company Financials
- 12.1.3.4. SWOT Analysis
- 12.1.4 GeBBs Healthcare Solutions
- 12.1.4.1. Company Overview
- 12.1.4.2. Products
- 12.1.4.3. Company Financials
- 12.1.4.4. SWOT Analysis
- 12.1.5 IBM Corporation
- 12.1.5.1. Company Overview
- 12.1.5.2. Products
- 12.1.5.3. Company Financials
- 12.1.5.4. SWOT Analysis
- 12.1.6 Sutherland Healthcare Solutions
- 12.1.6.1. Company Overview
- 12.1.6.2. Products
- 12.1.6.3. Company Financials
- 12.1.6.4. SWOT Analysis
- 12.1.7 Parexel International
- 12.1.7.1. Company Overview
- 12.1.7.2. Products
- 12.1.7.3. Company Financials
- 12.1.7.4. SWOT Analysis
- 12.1.8 IQVIA
- 12.1.8.1. Company Overview
- 12.1.8.2. Products
- 12.1.8.3. Company Financials
- 12.1.8.4. SWOT Analysis
- 12.1.9 Capgemini
- 12.1.9.1. Company Overview
- 12.1.9.2. Products
- 12.1.9.3. Company Financials
- 12.1.9.4. SWOT Analysis
- 12.1.10 Genpact Limited
- 12.1.10.1. Company Overview
- 12.1.10.2. Products
- 12.1.10.3. Company Financials
- 12.1.10.4. SWOT Analysis
- 12.1.1 Accenture PLC
- 12.2. Market Entropy
- 12.2.1 Company's Key Areas Served
- 12.2.2 Recent Developments
- 12.3. Company Market Share Analysis 2025
- 12.3.1 Top 5 Companies Market Share Analysis
- 12.3.2 Top 3 Companies Market Share Analysis
- 12.4. List of Potential Customers
- 13. Research Methodology
List of Figures
- Figure 1: Global US Healthcare BPO Industry Revenue Breakdown (Million, %) by Region 2025 & 2033
- Figure 2: North America US Healthcare BPO Industry Revenue (Million), by Payer Service 2025 & 2033
- Figure 3: North America US Healthcare BPO Industry Revenue Share (%), by Payer Service 2025 & 2033
- Figure 4: North America US Healthcare BPO Industry Revenue (Million), by Pharmaceutical Service 2025 & 2033
- Figure 5: North America US Healthcare BPO Industry Revenue Share (%), by Pharmaceutical Service 2025 & 2033
- Figure 6: North America US Healthcare BPO Industry Revenue (Million), by Country 2025 & 2033
- Figure 7: North America US Healthcare BPO Industry Revenue Share (%), by Country 2025 & 2033
- Figure 8: South America US Healthcare BPO Industry Revenue (Million), by Payer Service 2025 & 2033
- Figure 9: South America US Healthcare BPO Industry Revenue Share (%), by Payer Service 2025 & 2033
- Figure 10: South America US Healthcare BPO Industry Revenue (Million), by Pharmaceutical Service 2025 & 2033
- Figure 11: South America US Healthcare BPO Industry Revenue Share (%), by Pharmaceutical Service 2025 & 2033
- Figure 12: South America US Healthcare BPO Industry Revenue (Million), by Country 2025 & 2033
- Figure 13: South America US Healthcare BPO Industry Revenue Share (%), by Country 2025 & 2033
- Figure 14: Europe US Healthcare BPO Industry Revenue (Million), by Payer Service 2025 & 2033
- Figure 15: Europe US Healthcare BPO Industry Revenue Share (%), by Payer Service 2025 & 2033
- Figure 16: Europe US Healthcare BPO Industry Revenue (Million), by Pharmaceutical Service 2025 & 2033
- Figure 17: Europe US Healthcare BPO Industry Revenue Share (%), by Pharmaceutical Service 2025 & 2033
- Figure 18: Europe US Healthcare BPO Industry Revenue (Million), by Country 2025 & 2033
- Figure 19: Europe US Healthcare BPO Industry Revenue Share (%), by Country 2025 & 2033
- Figure 20: Middle East & Africa US Healthcare BPO Industry Revenue (Million), by Payer Service 2025 & 2033
- Figure 21: Middle East & Africa US Healthcare BPO Industry Revenue Share (%), by Payer Service 2025 & 2033
- Figure 22: Middle East & Africa US Healthcare BPO Industry Revenue (Million), by Pharmaceutical Service 2025 & 2033
- Figure 23: Middle East & Africa US Healthcare BPO Industry Revenue Share (%), by Pharmaceutical Service 2025 & 2033
- Figure 24: Middle East & Africa US Healthcare BPO Industry Revenue (Million), by Country 2025 & 2033
- Figure 25: Middle East & Africa US Healthcare BPO Industry Revenue Share (%), by Country 2025 & 2033
- Figure 26: Asia Pacific US Healthcare BPO Industry Revenue (Million), by Payer Service 2025 & 2033
- Figure 27: Asia Pacific US Healthcare BPO Industry Revenue Share (%), by Payer Service 2025 & 2033
- Figure 28: Asia Pacific US Healthcare BPO Industry Revenue (Million), by Pharmaceutical Service 2025 & 2033
- Figure 29: Asia Pacific US Healthcare BPO Industry Revenue Share (%), by Pharmaceutical Service 2025 & 2033
- Figure 30: Asia Pacific US Healthcare BPO Industry Revenue (Million), by Country 2025 & 2033
- Figure 31: Asia Pacific US Healthcare BPO Industry Revenue Share (%), by Country 2025 & 2033
List of Tables
- Table 1: Global US Healthcare BPO Industry Revenue Million Forecast, by Payer Service 2020 & 2033
- Table 2: Global US Healthcare BPO Industry Revenue Million Forecast, by Pharmaceutical Service 2020 & 2033
- Table 3: Global US Healthcare BPO Industry Revenue Million Forecast, by Region 2020 & 2033
- Table 4: Global US Healthcare BPO Industry Revenue Million Forecast, by Payer Service 2020 & 2033
- Table 5: Global US Healthcare BPO Industry Revenue Million Forecast, by Pharmaceutical Service 2020 & 2033
- Table 6: Global US Healthcare BPO Industry Revenue Million Forecast, by Country 2020 & 2033
- Table 7: United States US Healthcare BPO Industry Revenue (Million) Forecast, by Application 2020 & 2033
- Table 8: Canada US Healthcare BPO Industry Revenue (Million) Forecast, by Application 2020 & 2033
- Table 9: Mexico US Healthcare BPO Industry Revenue (Million) Forecast, by Application 2020 & 2033
- Table 10: Global US Healthcare BPO Industry Revenue Million Forecast, by Payer Service 2020 & 2033
- Table 11: Global US Healthcare BPO Industry Revenue Million Forecast, by Pharmaceutical Service 2020 & 2033
- Table 12: Global US Healthcare BPO Industry Revenue Million Forecast, by Country 2020 & 2033
- Table 13: Brazil US Healthcare BPO Industry Revenue (Million) Forecast, by Application 2020 & 2033
- Table 14: Argentina US Healthcare BPO Industry Revenue (Million) Forecast, by Application 2020 & 2033
- Table 15: Rest of South America US Healthcare BPO Industry Revenue (Million) Forecast, by Application 2020 & 2033
- Table 16: Global US Healthcare BPO Industry Revenue Million Forecast, by Payer Service 2020 & 2033
- Table 17: Global US Healthcare BPO Industry Revenue Million Forecast, by Pharmaceutical Service 2020 & 2033
- Table 18: Global US Healthcare BPO Industry Revenue Million Forecast, by Country 2020 & 2033
- Table 19: United Kingdom US Healthcare BPO Industry Revenue (Million) Forecast, by Application 2020 & 2033
- Table 20: Germany US Healthcare BPO Industry Revenue (Million) Forecast, by Application 2020 & 2033
- Table 21: France US Healthcare BPO Industry Revenue (Million) Forecast, by Application 2020 & 2033
- Table 22: Italy US Healthcare BPO Industry Revenue (Million) Forecast, by Application 2020 & 2033
- Table 23: Spain US Healthcare BPO Industry Revenue (Million) Forecast, by Application 2020 & 2033
- Table 24: Russia US Healthcare BPO Industry Revenue (Million) Forecast, by Application 2020 & 2033
- Table 25: Benelux US Healthcare BPO Industry Revenue (Million) Forecast, by Application 2020 & 2033
- Table 26: Nordics US Healthcare BPO Industry Revenue (Million) Forecast, by Application 2020 & 2033
- Table 27: Rest of Europe US Healthcare BPO Industry Revenue (Million) Forecast, by Application 2020 & 2033
- Table 28: Global US Healthcare BPO Industry Revenue Million Forecast, by Payer Service 2020 & 2033
- Table 29: Global US Healthcare BPO Industry Revenue Million Forecast, by Pharmaceutical Service 2020 & 2033
- Table 30: Global US Healthcare BPO Industry Revenue Million Forecast, by Country 2020 & 2033
- Table 31: Turkey US Healthcare BPO Industry Revenue (Million) Forecast, by Application 2020 & 2033
- Table 32: Israel US Healthcare BPO Industry Revenue (Million) Forecast, by Application 2020 & 2033
- Table 33: GCC US Healthcare BPO Industry Revenue (Million) Forecast, by Application 2020 & 2033
- Table 34: North Africa US Healthcare BPO Industry Revenue (Million) Forecast, by Application 2020 & 2033
- Table 35: South Africa US Healthcare BPO Industry Revenue (Million) Forecast, by Application 2020 & 2033
- Table 36: Rest of Middle East & Africa US Healthcare BPO Industry Revenue (Million) Forecast, by Application 2020 & 2033
- Table 37: Global US Healthcare BPO Industry Revenue Million Forecast, by Payer Service 2020 & 2033
- Table 38: Global US Healthcare BPO Industry Revenue Million Forecast, by Pharmaceutical Service 2020 & 2033
- Table 39: Global US Healthcare BPO Industry Revenue Million Forecast, by Country 2020 & 2033
- Table 40: China US Healthcare BPO Industry Revenue (Million) Forecast, by Application 2020 & 2033
- Table 41: India US Healthcare BPO Industry Revenue (Million) Forecast, by Application 2020 & 2033
- Table 42: Japan US Healthcare BPO Industry Revenue (Million) Forecast, by Application 2020 & 2033
- Table 43: South Korea US Healthcare BPO Industry Revenue (Million) Forecast, by Application 2020 & 2033
- Table 44: ASEAN US Healthcare BPO Industry Revenue (Million) Forecast, by Application 2020 & 2033
- Table 45: Oceania US Healthcare BPO Industry Revenue (Million) Forecast, by Application 2020 & 2033
- Table 46: Rest of Asia Pacific US Healthcare BPO Industry Revenue (Million) Forecast, by Application 2020 & 2033
Frequently Asked Questions
1. What is the projected Compound Annual Growth Rate (CAGR) of the US Healthcare BPO Industry?
The projected CAGR is approximately 8.11%.
2. Which companies are prominent players in the US Healthcare BPO Industry?
Key companies in the market include Accenture PLC, Cognizant, UnitedHealth Group Incorporated*List Not Exhaustive, GeBBs Healthcare Solutions, IBM Corporation, Sutherland Healthcare Solutions, Parexel International, IQVIA, Capgemini, Genpact Limited.
3. What are the main segments of the US Healthcare BPO Industry?
The market segments include Payer Service, Pharmaceutical Service.
4. Can you provide details about the market size?
The market size is estimated to be USD 133 Million as of 2022.
5. What are some drivers contributing to market growth?
Rapid Increase in Clinical Process Outsourcing (CPO); Increasing R&D in the Healthcare Industry.
6. What are the notable trends driving market growth?
Claims Management is Expected to Grow with High CAGR in the Forecast Period.
7. Are there any restraints impacting market growth?
Data Integrity and Confidentiality.
8. Can you provide examples of recent developments in the market?
May 2023: Atento, a major provider of customer relationship and business process outsourcing (CRM/BPO) services, reported that Frost & Sullivan recognized it as a leader in the Frost Radar for Customer Experience and Outsourcing services in Latin America for 2022.
9. What pricing options are available for accessing the report?
Pricing options include single-user, multi-user, and enterprise licenses priced at USD 3800, USD 4500, and USD 5800 respectively.
10. Is the market size provided in terms of value or volume?
The market size is provided in terms of value, measured in Million.
11. Are there any specific market keywords associated with the report?
Yes, the market keyword associated with the report is "US Healthcare BPO Industry," which aids in identifying and referencing the specific market segment covered.
12. How do I determine which pricing option suits my needs best?
The pricing options vary based on user requirements and access needs. Individual users may opt for single-user licenses, while businesses requiring broader access may choose multi-user or enterprise licenses for cost-effective access to the report.
13. Are there any additional resources or data provided in the US Healthcare BPO Industry report?
While the report offers comprehensive insights, it's advisable to review the specific contents or supplementary materials provided to ascertain if additional resources or data are available.
14. How can I stay updated on further developments or reports in the US Healthcare BPO Industry?
To stay informed about further developments, trends, and reports in the US Healthcare BPO Industry, consider subscribing to industry newsletters, following relevant companies and organizations, or regularly checking reputable industry news sources and publications.
Methodology
Step 1 - Identification of Relevant Samples Size from Population Database


Step 2 - Approaches for Defining Global Market Size (Value, Volume* & Price*)

Note*: In applicable scenarios
Step 3 - Data Sources
Primary Research
- Web Analytics
- Survey Reports
- Research Institute
- Latest Research Reports
- Opinion Leaders
Secondary Research
- Annual Reports
- White Paper
- Latest Press Release
- Industry Association
- Paid Database
- Investor Presentations

Step 4 - Data Triangulation
Involves using different sources of information in order to increase the validity of a study
These sources are likely to be stakeholders in a program - participants, other researchers, program staff, other community members, and so on.
Then we put all data in single framework & apply various statistical tools to find out the dynamic on the market.
During the analysis stage, feedback from the stakeholder groups would be compared to determine areas of agreement as well as areas of divergence