

Key Insights
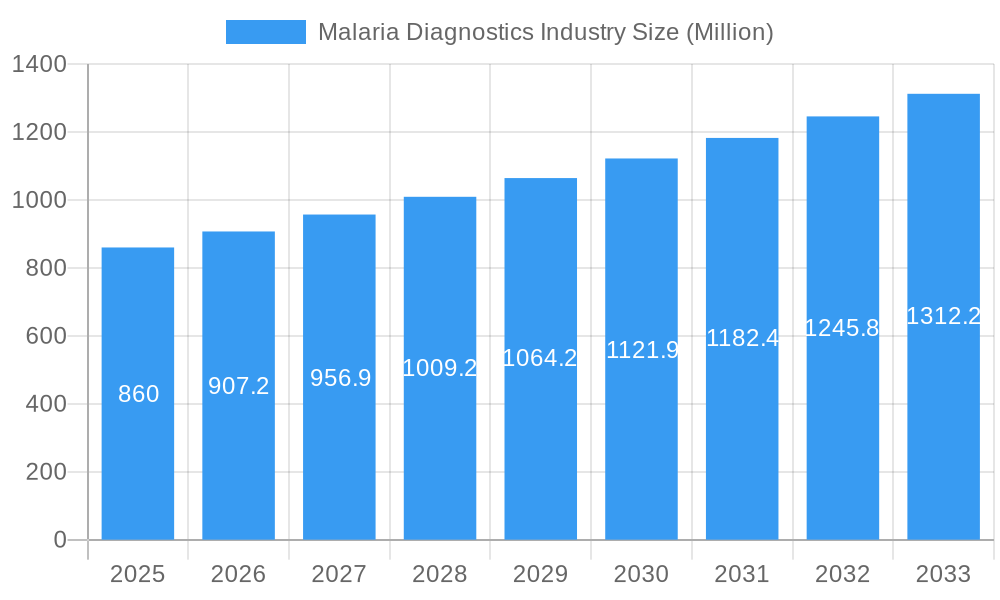
The malaria diagnostics market, valued at $0.86 billion in 2025, is projected to experience robust growth, driven by increasing malaria prevalence in endemic regions, heightened government initiatives for disease eradication, and advancements in diagnostic technologies. The 5.23% CAGR from 2025 to 2033 indicates a significant expansion, fueled by the rising adoption of rapid diagnostic tests (RDTs) due to their ease of use, portability, and cost-effectiveness, particularly in resource-limited settings. Molecular diagnostics, while more expensive, are gaining traction due to their higher sensitivity and specificity, enabling early detection and improved treatment outcomes. The market is segmented by technology (clinical diagnostics, microscopic diagnostics, RDTs, molecular diagnostics, and others), with RDTs currently holding a significant market share. Geographic growth is expected to be diverse, with a strong focus on regions with high malaria burden, such as sub-Saharan Africa and parts of Asia. While challenges remain, such as the emergence of drug-resistant strains and the need for improved infrastructure in some regions, the overall market outlook remains positive, driven by continued technological advancements and sustained public health efforts.
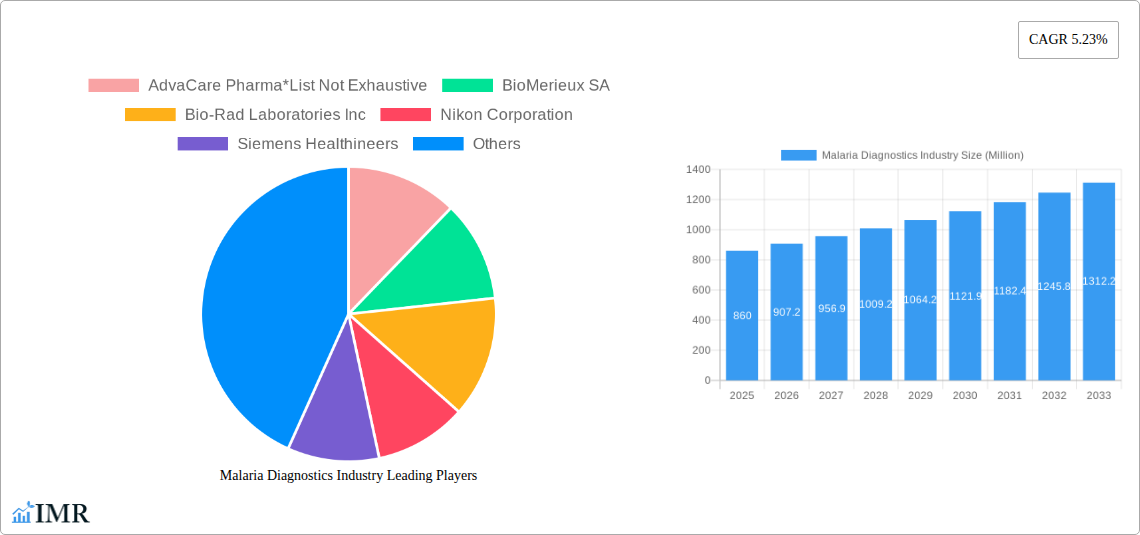
Malaria Diagnostics Industry Market Size (In Million)
The competitive landscape includes both established players like Abbott Laboratories, BioMérieux SA, and Thermo Fisher Scientific, and smaller, specialized companies. These companies are investing in R&D to improve diagnostic accuracy, speed, and affordability. The market is also witnessing the emergence of point-of-care diagnostics, facilitating faster diagnosis and treatment in remote areas. Expansion into new markets and strategic collaborations are key strategies adopted by major players to capitalize on market opportunities. Ongoing research in developing more sensitive and specific diagnostic tools, along with improved healthcare infrastructure, will be critical factors influencing market growth in the coming years. The demand for reliable and accessible diagnostic tools is expected to drive innovation and expansion within the malaria diagnostics market.
Malaria Diagnostics Industry Company Market Share
Malaria Diagnostics Industry Market Report: 2019-2033
This comprehensive report provides a detailed analysis of the Malaria Diagnostics Industry, encompassing market dynamics, growth trends, regional insights, product landscape, challenges, opportunities, and key players. The study period spans 2019-2033, with 2025 as the base and estimated year. The report leverages extensive data analysis to offer actionable insights for industry professionals, investors, and stakeholders. Market values are presented in millions of units.
Malaria Diagnostics Industry Market Dynamics & Structure
This section analyzes the market's competitive landscape, technological advancements, regulatory influences, and market consolidation trends within the malaria diagnostics market (parent market) and its sub-segments (child markets) like RDTs and molecular diagnostics. The analysis covers the period 2019-2024 and projects trends through 2033.
- Market Concentration: The malaria diagnostics market exhibits a moderately concentrated structure, with a few large multinational corporations holding significant market share. However, the presence of numerous smaller players, particularly in the RDT segment, contributes to a dynamic competitive landscape. xx% of the market is controlled by the top 5 players in 2024, projected to be xx% by 2033.
- Technological Innovation: Continuous innovation in rapid diagnostic tests (RDTs), molecular diagnostics, and clinical diagnostics are key drivers. The development of more sensitive, accurate, and affordable tests is crucial in combating malaria effectively.
- Regulatory Frameworks: Stringent regulatory approvals and quality control standards impact market entry and product adoption. Harmonization of regulatory requirements across regions could stimulate market growth.
- Competitive Product Substitutes: The absence of effective substitutes for accurate and rapid malaria diagnostics reinforces the market's resilience. However, the development of alternative diagnostic technologies may pose a potential long-term threat.
- End-User Demographics: The primary end-users are healthcare providers (hospitals, clinics), public health organizations, and research institutions. The increasing focus on malaria eradication programs in endemic regions fuels demand.
- M&A Trends: The market has witnessed several mergers and acquisitions (M&As) aimed at expanding product portfolios and geographical reach. An estimated xx M&A deals occurred between 2019-2024, with a projected increase in the forecast period. These deals often center around enhancing technological capabilities and broadening market access. Innovation barriers include high R&D costs, stringent regulatory approvals, and challenges in securing intellectual property rights.
Malaria Diagnostics Industry Growth Trends & Insights
This section provides a detailed analysis of the malaria diagnostics market size, adoption rates, technological advancements, and evolving consumer behaviors, supported by data from 2019 to 2024 and projections through 2033. The analysis leverages [Source of data - XXX] to provide comprehensive insights into market evolution.
The global malaria diagnostics market witnessed a CAGR of xx% during the historical period (2019-2024) and is projected to grow at a CAGR of xx% during the forecast period (2025-2033), reaching a market size of xx Million by 2033. The increasing prevalence of malaria in certain regions, coupled with the growing adoption of advanced diagnostic techniques, is driving market growth. Market penetration of RDTs is increasing steadily, with significant growth projected in regions with limited access to advanced diagnostic infrastructure. Technological disruptions, such as the development of point-of-care diagnostics, are transforming the industry, enabling faster and more efficient testing. Shifting consumer behaviors, including increased awareness of malaria prevention and control, are further contributing to market expansion. The analysis considers factors such as government initiatives, disease prevalence rates, economic development, and healthcare infrastructure to arrive at the projected market size. This analysis also considers the potential impact of new technologies such as AI-powered diagnostic tools on market growth.
Dominant Regions, Countries, or Segments in Malaria Diagnostics Industry
This section identifies the leading regions, countries, and market segments driving market growth within the malaria diagnostics industry. The analysis considers factors such as market share, growth potential, economic policies, and healthcare infrastructure development.
- Leading Regions: Sub-Saharan Africa continues to be the dominant region due to high malaria prevalence. Other regions with significant growth potential include South Asia and parts of Latin America.
- Leading Countries: Nigeria, Democratic Republic of Congo, and India are among the leading countries due to high disease burden and ongoing public health initiatives.
- Leading Segments: Rapid Diagnostic Tests (RDTs) dominate the market due to their ease of use, affordability, and portability, particularly in resource-constrained settings. Molecular diagnostics is also growing rapidly, driven by increasing demand for higher accuracy and sensitivity. The clinical diagnostics segment demonstrates significant market presence due to its established infrastructure and well-defined workflows.
Key Drivers:
- Increased government funding for malaria control programs
- Growing awareness among healthcare providers and populations
- Improved healthcare infrastructure in certain regions
- Technological advancements leading to higher accuracy and sensitivity
Dominance Factors:
- High malaria prevalence: Countries with high malaria burden naturally drive higher demand.
- Government initiatives: Robust government programs aimed at malaria eradication bolster market growth.
- Healthcare infrastructure: Regions with better healthcare access generally show higher adoption rates.
- Economic development: Increased disposable income and improved healthcare spending contribute to market expansion.
Malaria Diagnostics Industry Product Landscape
The malaria diagnostics market offers a diverse range of products, including RDTs, microscopic diagnostics, molecular diagnostics, and other technologies. RDTs are the most prevalent, offering rapid results and ease of use, particularly in remote settings. Microscopic diagnostics remain important for confirmation and parasite identification. Molecular diagnostics provides higher sensitivity and specificity, but typically requires specialized equipment and trained personnel. Recent innovations focus on enhancing test accuracy, reducing costs, and developing point-of-care diagnostic tools that require minimal training to use. These advancements have significantly improved diagnostic capabilities and accessibility in resource-limited settings. The unique selling propositions often center around speed, accuracy, cost-effectiveness, and ease of use, tailored to the specific needs of different healthcare settings.
Key Drivers, Barriers & Challenges in Malaria Diagnostics Industry
Key Drivers:
- The increasing prevalence of malaria in several regions globally creates substantial demand for effective diagnostic tools.
- Government initiatives and funding for malaria eradication programs significantly propel market expansion.
- Technological advancements, such as improved RDTs and molecular diagnostic techniques, enhance diagnostic accuracy and efficiency, driving adoption.
- The growing awareness among healthcare professionals and the public regarding the importance of early detection and treatment fosters market growth.
Key Challenges and Restraints:
- The high cost of advanced diagnostic technologies, such as molecular diagnostics, can limit accessibility in resource-constrained settings.
- The complexities associated with supply chain management in remote areas can pose logistical challenges, impacting product availability.
- Stringent regulatory requirements and quality control standards necessitate considerable investment, potentially delaying market entry for new players.
- Intense competition among established and emerging players can put pressure on pricing and profitability margins. The estimated impact of supply chain disruptions on market growth is xx%.
Emerging Opportunities in Malaria Diagnostics Industry
- Untapped markets: Expanding access to diagnostic tools in underserved regions presents significant opportunities.
- Innovative applications: Developing point-of-care diagnostics tailored for remote areas and integration with telemedicine platforms has high potential.
- Evolving consumer preferences: The increasing demand for user-friendly, accurate, and affordable diagnostic tools drives opportunities for innovative product development.
- Artificial Intelligence (AI) in Diagnostics: AI-powered tools for image analysis and automated diagnostics could revolutionize the sector.
Growth Accelerators in the Malaria Diagnostics Industry
Technological breakthroughs, particularly in RDTs and molecular diagnostics, are crucial growth catalysts. Strategic partnerships between public health organizations, research institutions, and private companies accelerate product development and market access. Expansion strategies that focus on providing affordable and accessible diagnostic solutions in underserved regions will fuel long-term growth. Furthermore, investments in research and development are fundamental for discovering improved diagnostics, further driving market expansion.
Key Players Shaping the Malaria Diagnostics Industry Market
- AdvaCare Pharma
- BioMerieux SA
- Bio-Rad Laboratories Inc
- Nikon Corporation
- Siemens Healthineers
- Abbott Laboratories
- Ortho Clinical Diagnostics
- Premier Medical Corporation Pvt Ltd
- Advy Chemical Pvt Ltd
- Zephyr Biomedicals
- Access Bio Inc
- Thermo Fisher Scientific
Notable Milestones in Malaria Diagnostics Industry Sector
- June 2022: SC Johnson and the Global Fund partnered to eradicate malaria. The Global Fund's substantial investment (USD 16 billion+) highlights its commitment to malaria control.
- February 2022: The Kenya Medical Research Institute (KEMRI) launched the Plasmochek diagnostic kit, enhancing diagnostic capabilities in Kenya.
In-Depth Malaria Diagnostics Industry Market Outlook
The malaria diagnostics market exhibits strong growth potential driven by continuous technological advancements, increasing government funding for malaria control initiatives, and expanding access to healthcare in underserved regions. Strategic opportunities exist in developing innovative, affordable, and accessible diagnostic solutions, particularly point-of-care technologies. The market's future growth hinges on collaborative efforts between public health organizations, research institutions, and private companies to combat malaria effectively. Strategic partnerships and investments in R&D will be instrumental in realizing the market's full potential.
Malaria Diagnostics Industry Segmentation
-
1. Technology
- 1.1. Clinical Diagnostics
- 1.2. Microscopic Diagnostics
- 1.3. Rapid Diagnostic Tests (RDTs)
- 1.4. Molecular Diagnostics
- 1.5. Other Technologies
Malaria Diagnostics Industry Segmentation By Geography
-
1. Americas
- 1.1. Venezuela
- 1.2. Brazil
- 1.3. Colombia
- 1.4. Rest of the Americas
-
2. Europe
- 2.1. Germany
- 2.2. United Kingdom
- 2.3. France
- 2.4. Turkey
- 2.5. Spain
- 2.6. Rest of Europe
- 3. Asia Pacific
-
4. India
- 4.1. Myanmar
- 4.2. Indonesia
- 4.3. Pakistan
- 4.4. China
- 4.5. Papua New Guinea
- 4.6. Cambodia
- 4.7. Rest of Asia Pacific
-
5. Africa
- 5.1. Democratic Republic of Congo
- 5.2. Nigeria
- 5.3. Uganda
- 5.4. Rest of Africa
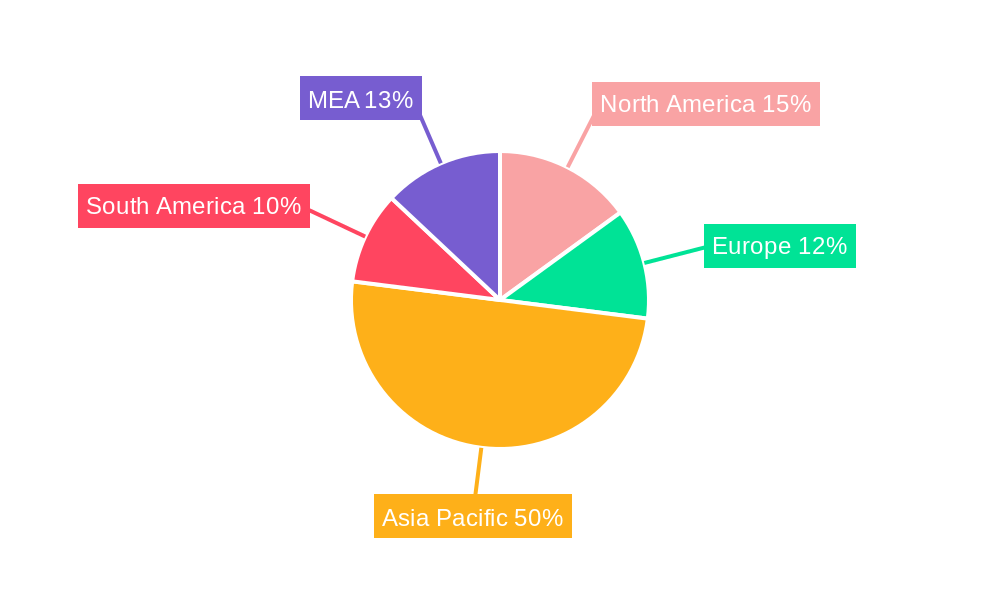
Malaria Diagnostics Industry Regional Market Share
Geographic Coverage of Malaria Diagnostics Industry
Malaria Diagnostics Industry REPORT HIGHLIGHTS
| Aspects | Details |
|---|---|
| Study Period | 2020-2034 |
| Base Year | 2025 |
| Estimated Year | 2026 |
| Forecast Period | 2026-2034 |
| Historical Period | 2020-2025 |
| Growth Rate | CAGR of 5.23% from 2020-2034 |
| Segmentation |
|
Table of Contents
- 1. Introduction
- 1.1. Research Scope
- 1.2. Market Segmentation
- 1.3. Research Objective
- 1.4. Definitions and Assumptions
- 2. Executive Summary
- 2.1. Market Snapshot
- 3. Market Dynamics
- 3.1. Market Drivers
- 3.2. Market Restrains
- 3.3. Market Trends
- 3.4. Market Opportunities
- 4. Market Factor Analysis
- 4.1. Porters Five Forces
- 4.1.1. Bargaining Power of Suppliers
- 4.1.2. Bargaining Power of Buyers
- 4.1.3. Threat of New Entrants
- 4.1.4. Threat of Substitutes
- 4.1.5. Competitive Rivalry
- 4.2. PESTEL analysis
- 4.3. BCG Analysis
- 4.3.1. Stars (High Growth, High Market Share)
- 4.3.2. Cash Cows (Low Growth, High Market Share)
- 4.3.3. Question Mark (High Growth, Low Market Share)
- 4.3.4. Dogs (Low Growth, Low Market Share)
- 4.4. Ansoff Matrix Analysis
- 4.5. Supply Chain Analysis
- 4.6. Regulatory Landscape
- 4.7. Current Market Potential and Opportunity Assessment (TAM–SAM–SOM Framework)
- 4.8. IMR Analyst Note
- 4.1. Porters Five Forces
- 5. Market Analysis, Insights and Forecast 2021-2033
- 5.1. Market Analysis, Insights and Forecast - by Technology
- 5.1.1. Clinical Diagnostics
- 5.1.2. Microscopic Diagnostics
- 5.1.3. Rapid Diagnostic Tests (RDTs)
- 5.1.4. Molecular Diagnostics
- 5.1.5. Other Technologies
- 5.2. Market Analysis, Insights and Forecast - by Region
- 5.2.1. Americas
- 5.2.2. Europe
- 5.2.3. Asia Pacific
- 5.2.4. India
- 5.2.5. Africa
- 5.1. Market Analysis, Insights and Forecast - by Technology
- 6. Global Malaria Diagnostics Industry Analysis, Insights and Forecast, 2021-2033
- 6.1. Market Analysis, Insights and Forecast - by Technology
- 6.1.1. Clinical Diagnostics
- 6.1.2. Microscopic Diagnostics
- 6.1.3. Rapid Diagnostic Tests (RDTs)
- 6.1.4. Molecular Diagnostics
- 6.1.5. Other Technologies
- 6.1. Market Analysis, Insights and Forecast - by Technology
- 7. Americas Malaria Diagnostics Industry Analysis, Insights and Forecast, 2020-2032
- 7.1. Market Analysis, Insights and Forecast - by Technology
- 7.1.1. Clinical Diagnostics
- 7.1.2. Microscopic Diagnostics
- 7.1.3. Rapid Diagnostic Tests (RDTs)
- 7.1.4. Molecular Diagnostics
- 7.1.5. Other Technologies
- 7.1. Market Analysis, Insights and Forecast - by Technology
- 8. Europe Malaria Diagnostics Industry Analysis, Insights and Forecast, 2020-2032
- 8.1. Market Analysis, Insights and Forecast - by Technology
- 8.1.1. Clinical Diagnostics
- 8.1.2. Microscopic Diagnostics
- 8.1.3. Rapid Diagnostic Tests (RDTs)
- 8.1.4. Molecular Diagnostics
- 8.1.5. Other Technologies
- 8.1. Market Analysis, Insights and Forecast - by Technology
- 9. Asia Pacific Malaria Diagnostics Industry Analysis, Insights and Forecast, 2020-2032
- 9.1. Market Analysis, Insights and Forecast - by Technology
- 9.1.1. Clinical Diagnostics
- 9.1.2. Microscopic Diagnostics
- 9.1.3. Rapid Diagnostic Tests (RDTs)
- 9.1.4. Molecular Diagnostics
- 9.1.5. Other Technologies
- 9.1. Market Analysis, Insights and Forecast - by Technology
- 10. India Malaria Diagnostics Industry Analysis, Insights and Forecast, 2020-2032
- 10.1. Market Analysis, Insights and Forecast - by Technology
- 10.1.1. Clinical Diagnostics
- 10.1.2. Microscopic Diagnostics
- 10.1.3. Rapid Diagnostic Tests (RDTs)
- 10.1.4. Molecular Diagnostics
- 10.1.5. Other Technologies
- 10.1. Market Analysis, Insights and Forecast - by Technology
- 11. Africa Malaria Diagnostics Industry Analysis, Insights and Forecast, 2020-2032
- 11.1. Market Analysis, Insights and Forecast - by Technology
- 11.1.1. Clinical Diagnostics
- 11.1.2. Microscopic Diagnostics
- 11.1.3. Rapid Diagnostic Tests (RDTs)
- 11.1.4. Molecular Diagnostics
- 11.1.5. Other Technologies
- 11.1. Market Analysis, Insights and Forecast - by Technology
- 12. Competitive Analysis
- 12.1. Company Profiles
- 12.1.1 AdvaCare Pharma*List Not Exhaustive
- 12.1.1.1. Company Overview
- 12.1.1.2. Products
- 12.1.1.3. Company Financials
- 12.1.1.4. SWOT Analysis
- 12.1.2 BioMerieux SA
- 12.1.2.1. Company Overview
- 12.1.2.2. Products
- 12.1.2.3. Company Financials
- 12.1.2.4. SWOT Analysis
- 12.1.3 Bio-Rad Laboratories Inc
- 12.1.3.1. Company Overview
- 12.1.3.2. Products
- 12.1.3.3. Company Financials
- 12.1.3.4. SWOT Analysis
- 12.1.4 Nikon Corporation
- 12.1.4.1. Company Overview
- 12.1.4.2. Products
- 12.1.4.3. Company Financials
- 12.1.4.4. SWOT Analysis
- 12.1.5 Siemens Healthineers
- 12.1.5.1. Company Overview
- 12.1.5.2. Products
- 12.1.5.3. Company Financials
- 12.1.5.4. SWOT Analysis
- 12.1.6 Abbott Laboratories
- 12.1.6.1. Company Overview
- 12.1.6.2. Products
- 12.1.6.3. Company Financials
- 12.1.6.4. SWOT Analysis
- 12.1.7 Ortho Clinical Diagnostics
- 12.1.7.1. Company Overview
- 12.1.7.2. Products
- 12.1.7.3. Company Financials
- 12.1.7.4. SWOT Analysis
- 12.1.8 Premier Medical Corporation Pvt Ltd
- 12.1.8.1. Company Overview
- 12.1.8.2. Products
- 12.1.8.3. Company Financials
- 12.1.8.4. SWOT Analysis
- 12.1.9 Advy Chemical Pvt Ltd
- 12.1.9.1. Company Overview
- 12.1.9.2. Products
- 12.1.9.3. Company Financials
- 12.1.9.4. SWOT Analysis
- 12.1.10 Zephyr Biomedicals
- 12.1.10.1. Company Overview
- 12.1.10.2. Products
- 12.1.10.3. Company Financials
- 12.1.10.4. SWOT Analysis
- 12.1.11 Access Bio Inc
- 12.1.11.1. Company Overview
- 12.1.11.2. Products
- 12.1.11.3. Company Financials
- 12.1.11.4. SWOT Analysis
- 12.1.12 Thermo Fisher Scientific
- 12.1.12.1. Company Overview
- 12.1.12.2. Products
- 12.1.12.3. Company Financials
- 12.1.12.4. SWOT Analysis
- 12.1.1 AdvaCare Pharma*List Not Exhaustive
- 12.2. Market Entropy
- 12.2.1 Company's Key Areas Served
- 12.2.2 Recent Developments
- 12.3. Company Market Share Analysis 2025
- 12.3.1 Top 5 Companies Market Share Analysis
- 12.3.2 Top 3 Companies Market Share Analysis
- 12.4. List of Potential Customers
- 13. Research Methodology
List of Figures
- Figure 1: Global Malaria Diagnostics Industry Revenue Breakdown (Million, %) by Region 2025 & 2033
- Figure 2: Americas Malaria Diagnostics Industry Revenue (Million), by Technology 2025 & 2033
- Figure 3: Americas Malaria Diagnostics Industry Revenue Share (%), by Technology 2025 & 2033
- Figure 4: Americas Malaria Diagnostics Industry Revenue (Million), by Country 2025 & 2033
- Figure 5: Americas Malaria Diagnostics Industry Revenue Share (%), by Country 2025 & 2033
- Figure 6: Europe Malaria Diagnostics Industry Revenue (Million), by Technology 2025 & 2033
- Figure 7: Europe Malaria Diagnostics Industry Revenue Share (%), by Technology 2025 & 2033
- Figure 8: Europe Malaria Diagnostics Industry Revenue (Million), by Country 2025 & 2033
- Figure 9: Europe Malaria Diagnostics Industry Revenue Share (%), by Country 2025 & 2033
- Figure 10: Asia Pacific Malaria Diagnostics Industry Revenue (Million), by Technology 2025 & 2033
- Figure 11: Asia Pacific Malaria Diagnostics Industry Revenue Share (%), by Technology 2025 & 2033
- Figure 12: Asia Pacific Malaria Diagnostics Industry Revenue (Million), by Country 2025 & 2033
- Figure 13: Asia Pacific Malaria Diagnostics Industry Revenue Share (%), by Country 2025 & 2033
- Figure 14: India Malaria Diagnostics Industry Revenue (Million), by Technology 2025 & 2033
- Figure 15: India Malaria Diagnostics Industry Revenue Share (%), by Technology 2025 & 2033
- Figure 16: India Malaria Diagnostics Industry Revenue (Million), by Country 2025 & 2033
- Figure 17: India Malaria Diagnostics Industry Revenue Share (%), by Country 2025 & 2033
- Figure 18: Africa Malaria Diagnostics Industry Revenue (Million), by Technology 2025 & 2033
- Figure 19: Africa Malaria Diagnostics Industry Revenue Share (%), by Technology 2025 & 2033
- Figure 20: Africa Malaria Diagnostics Industry Revenue (Million), by Country 2025 & 2033
- Figure 21: Africa Malaria Diagnostics Industry Revenue Share (%), by Country 2025 & 2033
List of Tables
- Table 1: Global Malaria Diagnostics Industry Revenue Million Forecast, by Technology 2020 & 2033
- Table 2: Global Malaria Diagnostics Industry Revenue Million Forecast, by Region 2020 & 2033
- Table 3: Global Malaria Diagnostics Industry Revenue Million Forecast, by Technology 2020 & 2033
- Table 4: Global Malaria Diagnostics Industry Revenue Million Forecast, by Country 2020 & 2033
- Table 5: Venezuela Malaria Diagnostics Industry Revenue (Million) Forecast, by Application 2020 & 2033
- Table 6: Brazil Malaria Diagnostics Industry Revenue (Million) Forecast, by Application 2020 & 2033
- Table 7: Colombia Malaria Diagnostics Industry Revenue (Million) Forecast, by Application 2020 & 2033
- Table 8: Rest of the Americas Malaria Diagnostics Industry Revenue (Million) Forecast, by Application 2020 & 2033
- Table 9: Global Malaria Diagnostics Industry Revenue Million Forecast, by Technology 2020 & 2033
- Table 10: Global Malaria Diagnostics Industry Revenue Million Forecast, by Country 2020 & 2033
- Table 11: Germany Malaria Diagnostics Industry Revenue (Million) Forecast, by Application 2020 & 2033
- Table 12: United Kingdom Malaria Diagnostics Industry Revenue (Million) Forecast, by Application 2020 & 2033
- Table 13: France Malaria Diagnostics Industry Revenue (Million) Forecast, by Application 2020 & 2033
- Table 14: Turkey Malaria Diagnostics Industry Revenue (Million) Forecast, by Application 2020 & 2033
- Table 15: Spain Malaria Diagnostics Industry Revenue (Million) Forecast, by Application 2020 & 2033
- Table 16: Rest of Europe Malaria Diagnostics Industry Revenue (Million) Forecast, by Application 2020 & 2033
- Table 17: Global Malaria Diagnostics Industry Revenue Million Forecast, by Technology 2020 & 2033
- Table 18: Global Malaria Diagnostics Industry Revenue Million Forecast, by Country 2020 & 2033
- Table 19: Global Malaria Diagnostics Industry Revenue Million Forecast, by Technology 2020 & 2033
- Table 20: Global Malaria Diagnostics Industry Revenue Million Forecast, by Country 2020 & 2033
- Table 21: Myanmar Malaria Diagnostics Industry Revenue (Million) Forecast, by Application 2020 & 2033
- Table 22: Indonesia Malaria Diagnostics Industry Revenue (Million) Forecast, by Application 2020 & 2033
- Table 23: Pakistan Malaria Diagnostics Industry Revenue (Million) Forecast, by Application 2020 & 2033
- Table 24: China Malaria Diagnostics Industry Revenue (Million) Forecast, by Application 2020 & 2033
- Table 25: Papua New Guinea Malaria Diagnostics Industry Revenue (Million) Forecast, by Application 2020 & 2033
- Table 26: Cambodia Malaria Diagnostics Industry Revenue (Million) Forecast, by Application 2020 & 2033
- Table 27: Rest of Asia Pacific Malaria Diagnostics Industry Revenue (Million) Forecast, by Application 2020 & 2033
- Table 28: Global Malaria Diagnostics Industry Revenue Million Forecast, by Technology 2020 & 2033
- Table 29: Global Malaria Diagnostics Industry Revenue Million Forecast, by Country 2020 & 2033
- Table 30: Democratic Republic of Congo Malaria Diagnostics Industry Revenue (Million) Forecast, by Application 2020 & 2033
- Table 31: Nigeria Malaria Diagnostics Industry Revenue (Million) Forecast, by Application 2020 & 2033
- Table 32: Uganda Malaria Diagnostics Industry Revenue (Million) Forecast, by Application 2020 & 2033
- Table 33: Rest of Africa Malaria Diagnostics Industry Revenue (Million) Forecast, by Application 2020 & 2033
Frequently Asked Questions
1. What is the projected Compound Annual Growth Rate (CAGR) of the Malaria Diagnostics Industry?
The projected CAGR is approximately 5.23%.
2. Which companies are prominent players in the Malaria Diagnostics Industry?
Key companies in the market include AdvaCare Pharma*List Not Exhaustive, BioMerieux SA, Bio-Rad Laboratories Inc, Nikon Corporation, Siemens Healthineers, Abbott Laboratories, Ortho Clinical Diagnostics, Premier Medical Corporation Pvt Ltd, Advy Chemical Pvt Ltd, Zephyr Biomedicals, Access Bio Inc, Thermo Fisher Scientific.
3. What are the main segments of the Malaria Diagnostics Industry?
The market segments include Technology.
4. Can you provide details about the market size?
The market size is estimated to be USD 0.86 Million as of 2022.
5. What are some drivers contributing to market growth?
Growing Demand for Diagnostic Tools in Malaria-endemic Regions; Increasing Technological Advancements and Efficient Diagnostics; Scale-up of Rapid Diagnostic Tests and Universal Access to Diagnosis.
6. What are the notable trends driving market growth?
Microscopic Diagnostics is Expected to Hold the Highest Market Share in the Technology Segment.
7. Are there any restraints impacting market growth?
Increasing Number of Malaria-free Countries; Rising Demand for Low-cost Diagnostic Tools.
8. Can you provide examples of recent developments in the market?
In June 2022, SC Johnson and Global Fund partnered to eradicate malaria. The Global Fund provides 56% of all international financing for malaria programs (39% of total available resources) and invested more than USD 16 billion in malaria control programs to date.
9. What pricing options are available for accessing the report?
Pricing options include single-user, multi-user, and enterprise licenses priced at USD 4750, USD 5250, and USD 8750 respectively.
10. Is the market size provided in terms of value or volume?
The market size is provided in terms of value, measured in Million.
11. Are there any specific market keywords associated with the report?
Yes, the market keyword associated with the report is "Malaria Diagnostics Industry," which aids in identifying and referencing the specific market segment covered.
12. How do I determine which pricing option suits my needs best?
The pricing options vary based on user requirements and access needs. Individual users may opt for single-user licenses, while businesses requiring broader access may choose multi-user or enterprise licenses for cost-effective access to the report.
13. Are there any additional resources or data provided in the Malaria Diagnostics Industry report?
While the report offers comprehensive insights, it's advisable to review the specific contents or supplementary materials provided to ascertain if additional resources or data are available.
14. How can I stay updated on further developments or reports in the Malaria Diagnostics Industry?
To stay informed about further developments, trends, and reports in the Malaria Diagnostics Industry, consider subscribing to industry newsletters, following relevant companies and organizations, or regularly checking reputable industry news sources and publications.
Methodology
Step 1 - Identification of Relevant Samples Size from Population Database


Step 2 - Approaches for Defining Global Market Size (Value, Volume* & Price*)

Note*: In applicable scenarios
Step 3 - Data Sources
Primary Research
- Web Analytics
- Survey Reports
- Research Institute
- Latest Research Reports
- Opinion Leaders
Secondary Research
- Annual Reports
- White Paper
- Latest Press Release
- Industry Association
- Paid Database
- Investor Presentations

Step 4 - Data Triangulation
Involves using different sources of information in order to increase the validity of a study
These sources are likely to be stakeholders in a program - participants, other researchers, program staff, other community members, and so on.
Then we put all data in single framework & apply various statistical tools to find out the dynamic on the market.
During the analysis stage, feedback from the stakeholder groups would be compared to determine areas of agreement as well as areas of divergence