

Key Insights
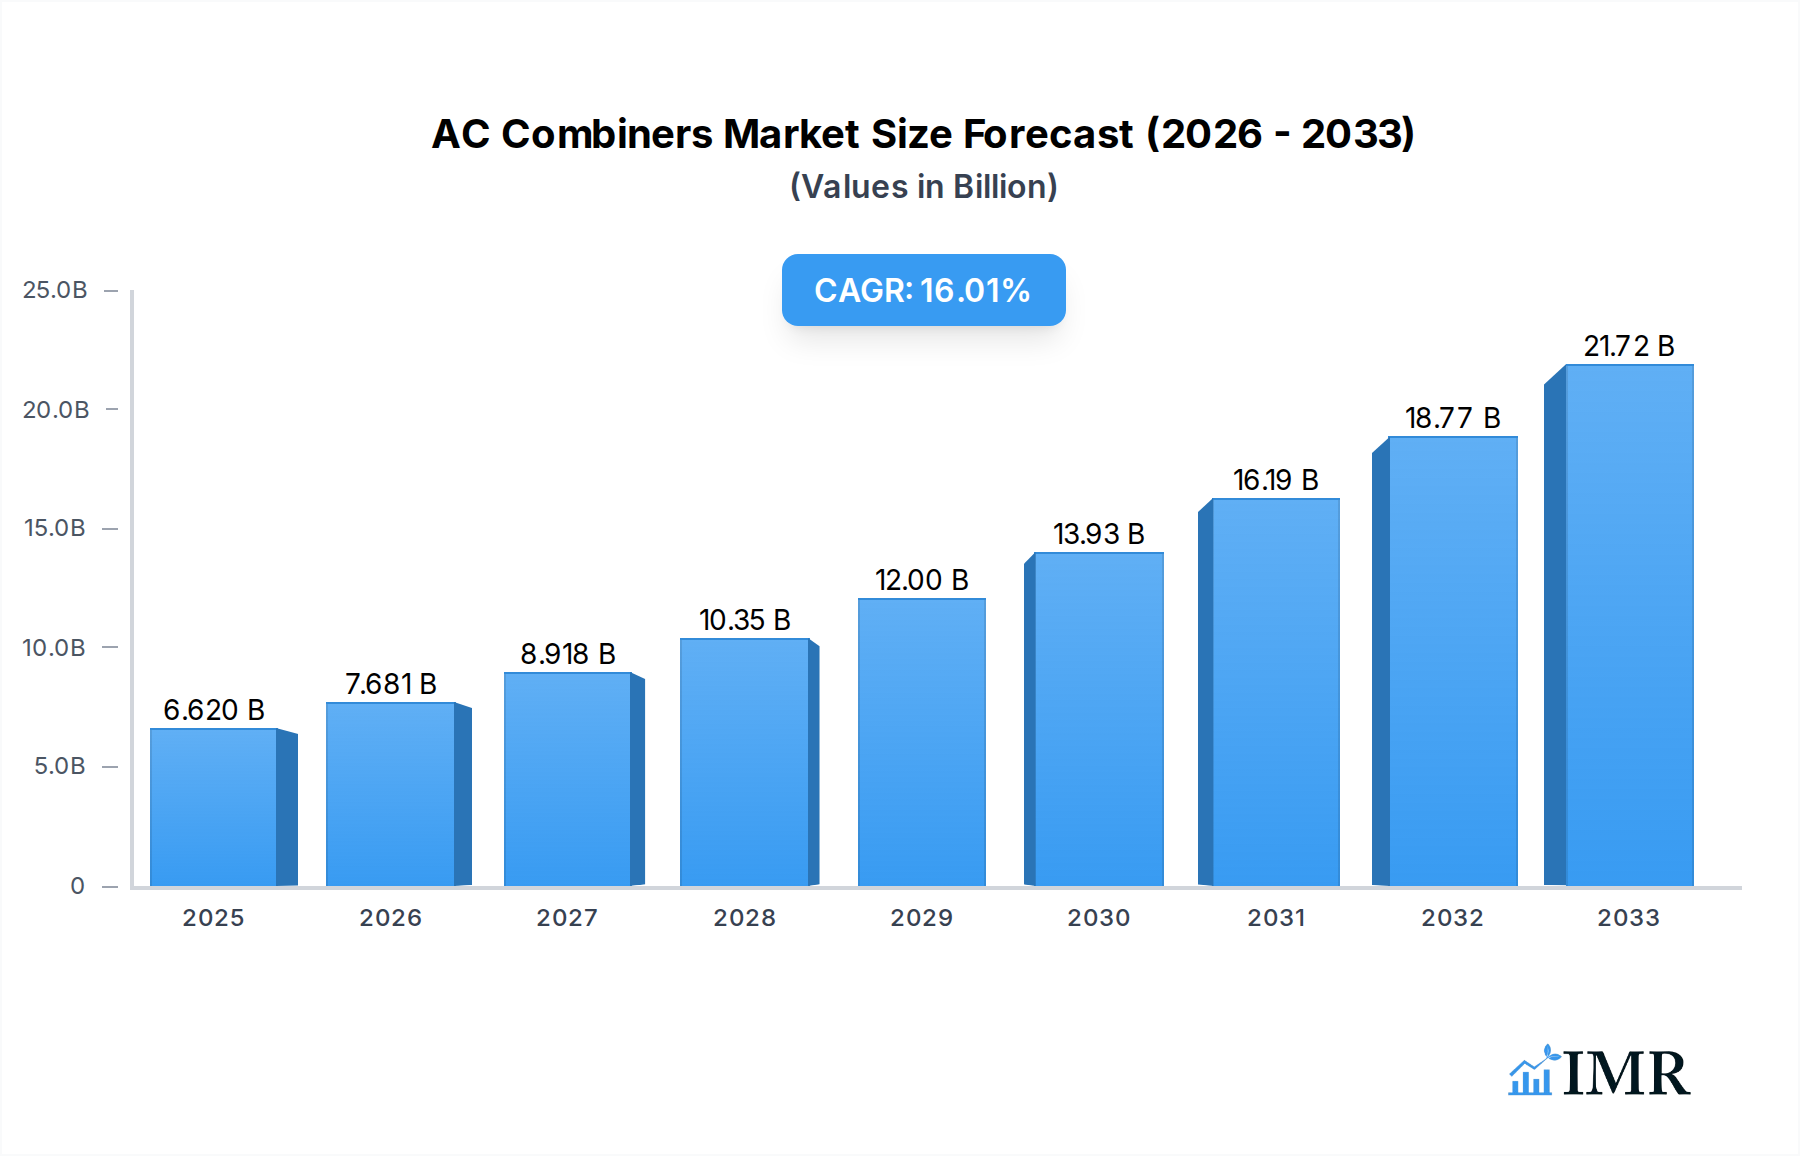
The AC Combiner market is poised for significant expansion, with a projected market size of $6.62 billion in 2025 and a robust CAGR of 15.99% expected throughout the forecast period. This impressive growth is primarily fueled by the accelerating adoption of renewable energy sources, particularly solar power, which necessitates sophisticated solutions for aggregating and managing AC power from multiple inverter strings. The increasing demand for reliable and efficient power supply in civil and commercial applications, driven by evolving energy regulations and the pursuit of grid stability, forms a core pillar of this market's upward trajectory. Advancements in AC combiner technology, focusing on enhanced safety features, smart monitoring capabilities, and modular designs that facilitate scalability and ease of installation, are further propelling market penetration. The shift towards higher voltage AC combiners, such as 800V and 1000V, to optimize energy transfer and reduce system losses in large-scale solar installations, is a key trend shaping product development and market dynamics.

AC Combiners Market Size (In Billion)
The AC Combiner market is witnessing dynamic shifts and presents substantial opportunities for stakeholders. While the surge in renewable energy integration is a primary driver, advancements in grid modernization initiatives and the increasing complexity of distributed energy resources are also contributing to market growth. The emphasis on robust safety standards and compliance with evolving electrical codes is paramount, influencing product design and manufacturer strategies. Key restraints, such as the initial high cost of sophisticated AC combiner systems and the need for specialized technical expertise for installation and maintenance, are being addressed through ongoing innovation and the development of more user-friendly solutions. Geographically, North America and Europe are leading the adoption due to strong governmental support for renewables and established infrastructure, while the Asia Pacific region is emerging as a high-growth market driven by rapid industrialization and significant investments in solar projects. The competitive landscape features established players and emerging innovators, all striving to capture market share through product differentiation, strategic partnerships, and a focus on providing comprehensive solutions for the evolving energy ecosystem.
AC Combiners Company Market Share
This in-depth AC combiners market report provides a critical analysis of the AC combiner box market, examining its dynamics, growth trends, and future outlook. Covering the study period of 2019–2033, with a base year of 2025, this report delves into the intricate landscape of solar AC combiners, electrical combiners, and PV combiners. We offer unparalleled insights into the global AC combiners market size, driven by solar energy applications, commercial power supply, and civil power supply needs. This report is essential for industry professionals seeking to understand market concentration, technological innovation, regulatory frameworks, competitive landscape, and emerging opportunities in the AC combiners industry. With a focus on the AC combiners parent market and its child market segments, this analysis is tailored for strategic decision-making in the rapidly evolving renewable energy sector.
AC Combiners Market Dynamics & Structure
The global AC combiners market is characterized by a moderate level of concentration, with a few key players dominating the landscape. Technological innovation acts as a primary driver, fueled by the increasing demand for more efficient and reliable solar energy systems and grid integration solutions. Stringent regulatory frameworks promoting renewable energy adoption globally are further bolstering market growth. Competitive product substitutes, though present in some nascent stages, are yet to significantly challenge the specialized nature of AC combiners. End-user demographics are increasingly leaning towards environmentally conscious businesses and utilities seeking robust power management solutions. Mergers and acquisitions (M&A) are an emerging trend, as larger players seek to expand their product portfolios and geographical reach.
- Market Concentration: Moderate, with a few dominant players in the AC combiner box market.
- Technological Innovation Drivers: Demand for enhanced solar energy efficiency, grid stability, and smart grid integration.
- Regulatory Frameworks: Favorable government policies and incentives for renewable energy deployment globally.
- Competitive Product Substitutes: Limited, primarily in less sophisticated junction box solutions for basic electrical distribution.
- End-User Demographics: Utilities, commercial solar developers, industrial facilities, and residential solar installers.
- M&A Trends: Increasing consolidation to gain market share and technological expertise in the solar AC combiners space.
AC Combiners Growth Trends & Insights
The AC combiners market is poised for substantial expansion over the forecast period, driven by the escalating global commitment to renewable energy. The AC combiners market size is projected to witness a significant uplift, with an estimated $15.5 billion in 2025, and is anticipated to reach approximately $35.2 billion by 2033, exhibiting a Compound Annual Growth Rate (CAGR) of 10.8%. This robust growth is attributed to the increasing adoption of solar photovoltaic (PV) systems for both commercial and utility-scale applications, necessitating advanced AC combining solutions for efficient power management and grid connectivity. The rise of distributed generation and the imperative for grid modernization further accelerate the demand for sophisticated electrical combiners.
Technological disruptions, such as advancements in materials science leading to more durable and cost-effective combiner boxes, alongside the integration of smart monitoring and control features, are key factors influencing market penetration. Consumer behavior is shifting towards sustainable energy solutions, with businesses and governments prioritizing investments in renewable infrastructure. This evolving preference, coupled with favorable economic policies and declining solar energy costs, is creating a fertile ground for the widespread adoption of AC combiners. The PV combiners segment, in particular, is experiencing rapid growth as solar installations become more prevalent worldwide. This trend is also being supported by government initiatives and subsidies aimed at promoting clean energy technologies.
Dominant Regions, Countries, or Segments in AC Combiners
The AC combiners market is currently witnessing significant growth acceleration driven by the Commercial Power Supply segment, which is anticipated to hold a substantial market share throughout the forecast period. This dominance is rooted in the burgeoning adoption of solar PV installations for commercial and industrial (C&I) facilities seeking to reduce operational costs and enhance energy independence. Regions like North America and Europe are at the forefront of this trend, propelled by supportive government policies, stringent carbon emission regulations, and a strong emphasis on renewable energy integration.
The 1000V type AC combiners are emerging as a dominant sub-segment within the "Types" category. This is primarily due to the increasing capacity of modern solar inverters and the growing trend towards larger-scale solar power plants that require higher voltage handling capabilities for efficient power transmission and reduced electrical losses. The ability of 1000V AC combiners to accommodate higher power outputs makes them indispensable for utility-scale solar farms and large commercial projects.
- Dominant Application Segment: Commercial Power Supply, driven by C&I solar installations and energy independence initiatives.
- Leading Regions: North America and Europe, due to robust renewable energy policies and carbon reduction targets.
- Dominant Type: 1000V AC combiners, catering to the needs of high-capacity solar power plants and advanced inverters.
- Key Drivers in Dominant Regions:
- Economic Policies: Investment tax credits, feed-in tariffs, and net metering policies.
- Infrastructure Development: Grid modernization initiatives and expansion of renewable energy infrastructure.
- Environmental Regulations: Mandates for reducing carbon emissions and increasing renewable energy adoption.
- Technological Advancements: Availability of efficient solar panels and inverters that necessitate high-voltage AC combiners.
- Growth Potential in Dominant Segments: Continued expansion of C&I solar, increasing utility-scale solar farm development, and the adoption of higher voltage DC systems leading to increased demand for 1000V AC combiners.
AC Combiners Product Landscape
The AC combiners product landscape is characterized by continuous innovation focused on enhanced safety, reliability, and smart functionality. Manufacturers are developing robust combiner boxes designed for extreme environmental conditions, offering superior protection against dust, moisture, and UV radiation. Key innovations include integrated surge protection devices (SPDs), rapid shutdown capabilities for enhanced safety during maintenance, and advanced monitoring systems that provide real-time performance data. These advancements allow for proactive fault detection and optimized energy generation. Unique selling propositions often revolve around modular design for easy installation and scalability, high IP ratings for durability, and compliance with international safety standards. For instance, AC combiners designed for 400V systems in residential and smaller commercial applications prioritize cost-effectiveness and ease of integration.
Key Drivers, Barriers & Challenges in AC Combiners
The AC combiners market is propelled by several key drivers. The escalating global demand for renewable energy, particularly solar power, is the foremost catalyst. Government incentives and favorable policies promoting solar installations, coupled with a growing awareness of environmental sustainability, are significantly boosting adoption rates. Technological advancements leading to more efficient and reliable AC combiners, along with the increasing need for robust grid integration solutions for intermittent renewable sources, further fuel market growth.
However, the market faces several barriers and challenges. Fluctuations in raw material prices, such as copper and aluminum, can impact manufacturing costs and product pricing. Stringent and evolving regulatory requirements across different regions can create compliance complexities for manufacturers. Supply chain disruptions, as witnessed in recent global events, can lead to extended lead times and increased logistical costs. Intense competition from established players and emerging manufacturers can exert pressure on profit margins. Furthermore, a lack of skilled labor for installation and maintenance in some developing regions can hinder widespread adoption.
Emerging Opportunities in AC Combiners
Emerging opportunities in the AC combiners sector lie in the burgeoning markets of energy storage integration and the development of smart grid-ready solutions. As battery storage systems become more prevalent alongside solar PV, there is a growing need for AC combiners that can seamlessly manage bidirectional power flow and integrate with energy management systems. Untapped markets in developing economies with rapidly expanding renewable energy portfolios present significant growth potential. Furthermore, the evolution towards distributed energy resources (DERs) and microgrids creates demand for highly customizable and intelligent AC combiner solutions that can enhance grid resilience and flexibility. Innovations in miniaturization and cost reduction for residential applications could also unlock new market segments.
Growth Accelerators in the AC Combiners Industry
Several factors are acting as growth accelerators for the AC combiners industry. The continuous decline in the cost of solar PV panels and inverters makes solar energy more economically attractive, thereby driving demand for accompanying AC combining equipment. Strategic partnerships between AC combiner manufacturers and inverter companies, as well as solar project developers, are fostering ecosystem growth and facilitating market penetration. Market expansion strategies targeting emerging economies with significant renewable energy potential, coupled with tailored product offerings for specific regional needs, are also key growth accelerators. Furthermore, the increasing integration of advanced digital technologies, such as IoT sensors and predictive analytics within AC combiners, is enhancing their value proposition and driving adoption.
Key Players Shaping the AC Combiners Market
- SolarBOS
- HIS RENEWABLES GMBH
- Innovative Solar
- MidNite Solar
- ABB
- ConnectPV
- EPEC Solutions
- enwitec
- HPL Electric & Power Limited
- Schneider
- Weidmüller
Notable Milestones in AC Combiners Sector
- 2021: Launch of advanced surge protection modules by Schneider Electric, enhancing safety and reliability in AC combiner boxes.
- 2022: ABB introduces intelligent AC combiner solutions with integrated monitoring capabilities for utility-scale solar projects.
- 2022: SolarBOS expands its product line with specialized AC combiners for 1500V DC systems, catering to the evolving needs of large-scale solar farms.
- 2023: MidNite Solar introduces a new series of robust AC combiner boxes designed for extreme weather conditions, improving durability in harsh environments.
- 2023: Weidmüller showcases innovative connection technologies for improved efficiency and safety in AC combiner box manufacturing.
- 2024: HIS RENEWABLES GMBH announces strategic partnerships to expand its AC combiner market reach in the Asia-Pacific region.
- 2024: Enwitec develops compact AC combiner solutions for residential solar installations, focusing on ease of installation and cost-effectiveness.
In-Depth AC Combiners Market Outlook
The AC combiners market outlook is exceptionally positive, driven by sustained global investment in renewable energy infrastructure and the relentless pursuit of cleaner energy solutions. Growth accelerators such as technological advancements in smart grid integration, the increasing adoption of higher voltage systems, and strategic collaborations will continue to fuel market expansion. The global AC combiners market is expected to witness significant opportunities arising from the integration of AC combiners with energy storage solutions and the development of resilient microgrids. As the world transitions towards a low-carbon economy, the demand for efficient, reliable, and intelligent AC combiner solutions will remain a critical enabler of this transition, promising substantial long-term growth and strategic opportunities for market players.
AC Combiners Segmentation
-
1. Application
- 1.1. Civil Power Supply
- 1.2. Commercial Power Supply
- 1.3. Others
-
2. Types
- 2.1. 400V
- 2.2. 800V
- 2.3. 1000V
- 2.4. Others
AC Combiners Segmentation By Geography
-
1. North America
- 1.1. United States
- 1.2. Canada
- 1.3. Mexico
-
2. South America
- 2.1. Brazil
- 2.2. Argentina
- 2.3. Rest of South America
-
3. Europe
- 3.1. United Kingdom
- 3.2. Germany
- 3.3. France
- 3.4. Italy
- 3.5. Spain
- 3.6. Russia
- 3.7. Benelux
- 3.8. Nordics
- 3.9. Rest of Europe
-
4. Middle East & Africa
- 4.1. Turkey
- 4.2. Israel
- 4.3. GCC
- 4.4. North Africa
- 4.5. South Africa
- 4.6. Rest of Middle East & Africa
-
5. Asia Pacific
- 5.1. China
- 5.2. India
- 5.3. Japan
- 5.4. South Korea
- 5.5. ASEAN
- 5.6. Oceania
- 5.7. Rest of Asia Pacific
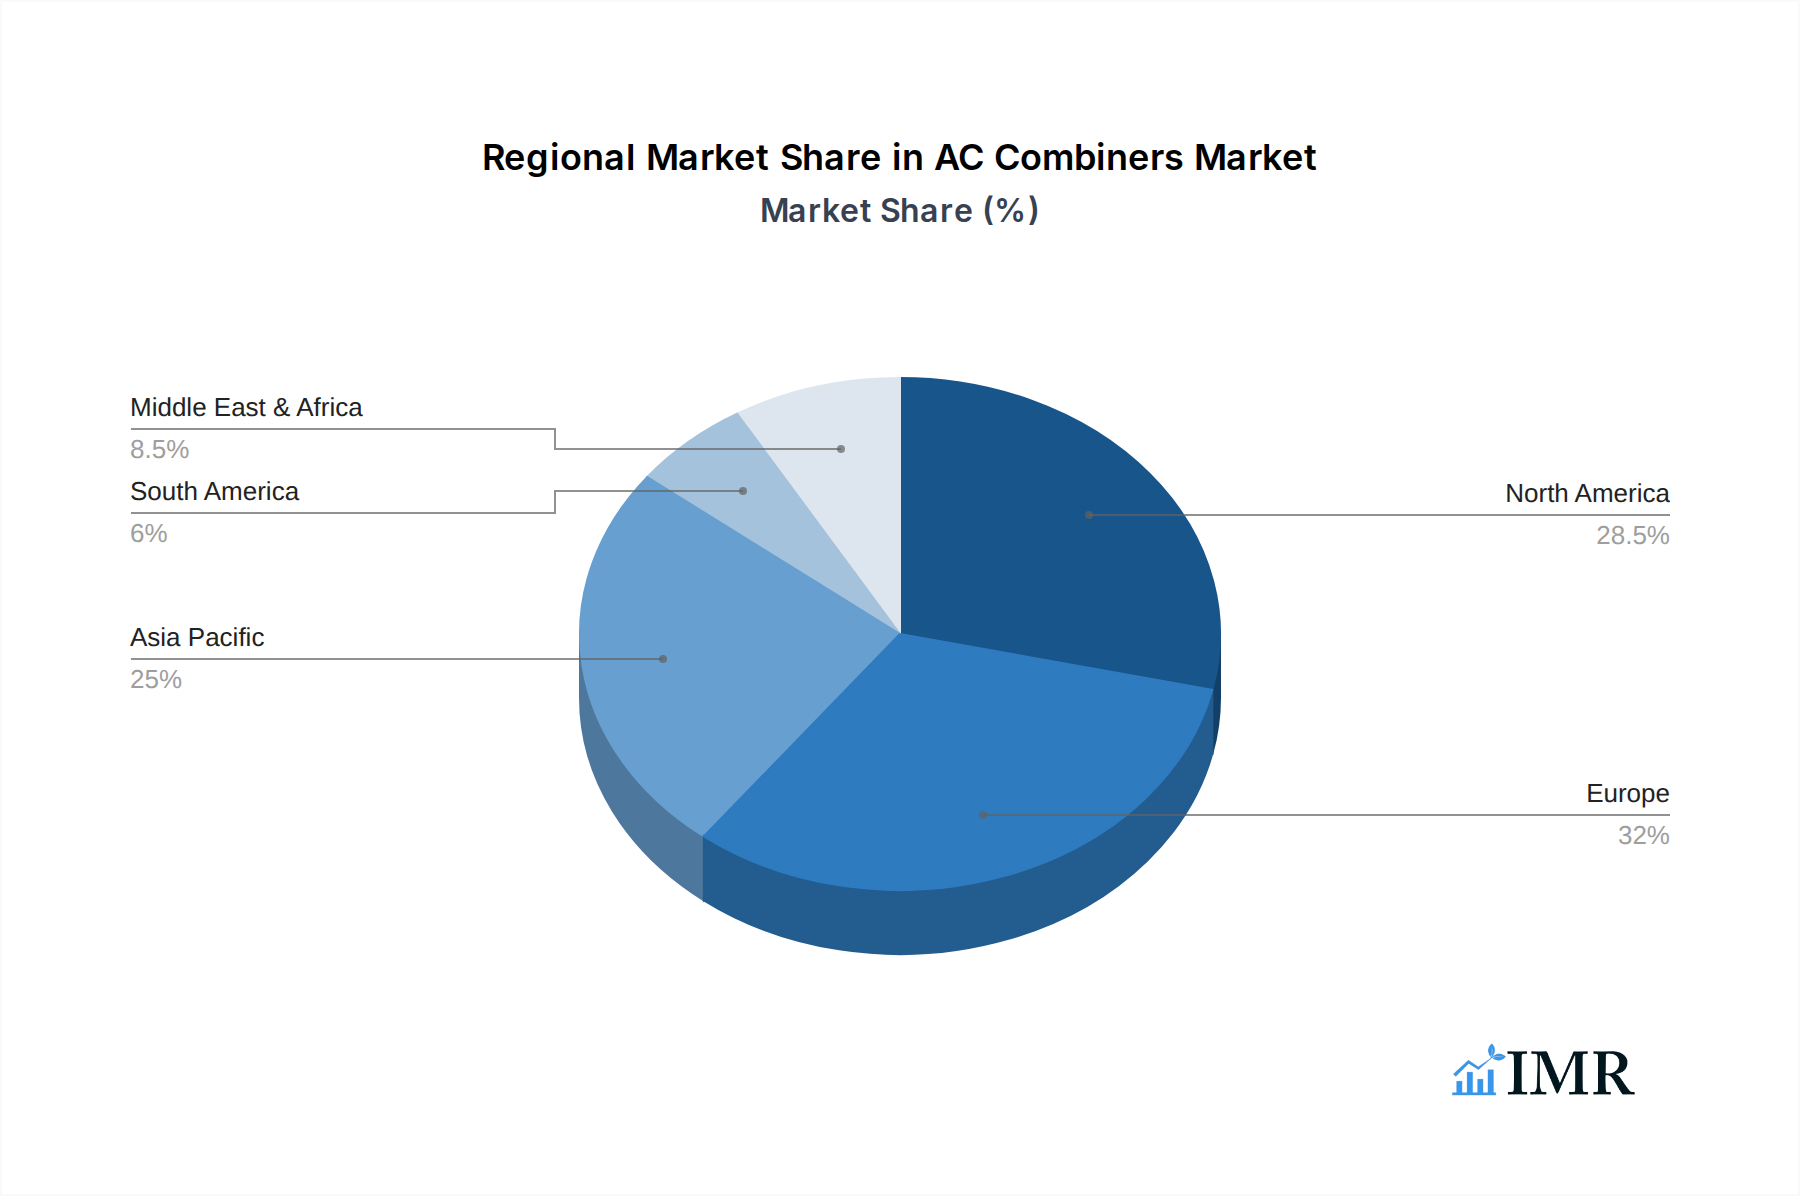
AC Combiners Regional Market Share
Geographic Coverage of AC Combiners
AC Combiners REPORT HIGHLIGHTS
| Aspects | Details |
|---|---|
| Study Period | 2020-2034 |
| Base Year | 2025 |
| Estimated Year | 2026 |
| Forecast Period | 2026-2034 |
| Historical Period | 2020-2025 |
| Growth Rate | CAGR of 15.99% from 2020-2034 |
| Segmentation |
|
Table of Contents
- 1. Introduction
- 1.1. Research Scope
- 1.2. Market Segmentation
- 1.3. Research Objective
- 1.4. Definitions and Assumptions
- 2. Executive Summary
- 2.1. Market Snapshot
- 3. Market Dynamics
- 3.1. Market Drivers
- 3.2. Market Restrains
- 3.3. Market Trends
- 3.4. Market Opportunities
- 4. Market Factor Analysis
- 4.1. Porters Five Forces
- 4.1.1. Bargaining Power of Suppliers
- 4.1.2. Bargaining Power of Buyers
- 4.1.3. Threat of New Entrants
- 4.1.4. Threat of Substitutes
- 4.1.5. Competitive Rivalry
- 4.2. PESTEL analysis
- 4.3. BCG Analysis
- 4.3.1. Stars (High Growth, High Market Share)
- 4.3.2. Cash Cows (Low Growth, High Market Share)
- 4.3.3. Question Mark (High Growth, Low Market Share)
- 4.3.4. Dogs (Low Growth, Low Market Share)
- 4.4. Ansoff Matrix Analysis
- 4.5. Supply Chain Analysis
- 4.6. Regulatory Landscape
- 4.7. Current Market Potential and Opportunity Assessment (TAM–SAM–SOM Framework)
- 4.8. IMR Analyst Note
- 4.1. Porters Five Forces
- 5. Market Analysis, Insights and Forecast 2021-2033
- 5.1. Market Analysis, Insights and Forecast - by Application
- 5.1.1. Civil Power Supply
- 5.1.2. Commercial Power Supply
- 5.1.3. Others
- 5.2. Market Analysis, Insights and Forecast - by Types
- 5.2.1. 400V
- 5.2.2. 800V
- 5.2.3. 1000V
- 5.2.4. Others
- 5.3. Market Analysis, Insights and Forecast - by Region
- 5.3.1. North America
- 5.3.2. South America
- 5.3.3. Europe
- 5.3.4. Middle East & Africa
- 5.3.5. Asia Pacific
- 5.1. Market Analysis, Insights and Forecast - by Application
- 6. Global AC Combiners Analysis, Insights and Forecast, 2021-2033
- 6.1. Market Analysis, Insights and Forecast - by Application
- 6.1.1. Civil Power Supply
- 6.1.2. Commercial Power Supply
- 6.1.3. Others
- 6.2. Market Analysis, Insights and Forecast - by Types
- 6.2.1. 400V
- 6.2.2. 800V
- 6.2.3. 1000V
- 6.2.4. Others
- 6.1. Market Analysis, Insights and Forecast - by Application
- 7. North America AC Combiners Analysis, Insights and Forecast, 2020-2032
- 7.1. Market Analysis, Insights and Forecast - by Application
- 7.1.1. Civil Power Supply
- 7.1.2. Commercial Power Supply
- 7.1.3. Others
- 7.2. Market Analysis, Insights and Forecast - by Types
- 7.2.1. 400V
- 7.2.2. 800V
- 7.2.3. 1000V
- 7.2.4. Others
- 7.1. Market Analysis, Insights and Forecast - by Application
- 8. South America AC Combiners Analysis, Insights and Forecast, 2020-2032
- 8.1. Market Analysis, Insights and Forecast - by Application
- 8.1.1. Civil Power Supply
- 8.1.2. Commercial Power Supply
- 8.1.3. Others
- 8.2. Market Analysis, Insights and Forecast - by Types
- 8.2.1. 400V
- 8.2.2. 800V
- 8.2.3. 1000V
- 8.2.4. Others
- 8.1. Market Analysis, Insights and Forecast - by Application
- 9. Europe AC Combiners Analysis, Insights and Forecast, 2020-2032
- 9.1. Market Analysis, Insights and Forecast - by Application
- 9.1.1. Civil Power Supply
- 9.1.2. Commercial Power Supply
- 9.1.3. Others
- 9.2. Market Analysis, Insights and Forecast - by Types
- 9.2.1. 400V
- 9.2.2. 800V
- 9.2.3. 1000V
- 9.2.4. Others
- 9.1. Market Analysis, Insights and Forecast - by Application
- 10. Middle East & Africa AC Combiners Analysis, Insights and Forecast, 2020-2032
- 10.1. Market Analysis, Insights and Forecast - by Application
- 10.1.1. Civil Power Supply
- 10.1.2. Commercial Power Supply
- 10.1.3. Others
- 10.2. Market Analysis, Insights and Forecast - by Types
- 10.2.1. 400V
- 10.2.2. 800V
- 10.2.3. 1000V
- 10.2.4. Others
- 10.1. Market Analysis, Insights and Forecast - by Application
- 11. Asia Pacific AC Combiners Analysis, Insights and Forecast, 2020-2032
- 11.1. Market Analysis, Insights and Forecast - by Application
- 11.1.1. Civil Power Supply
- 11.1.2. Commercial Power Supply
- 11.1.3. Others
- 11.2. Market Analysis, Insights and Forecast - by Types
- 11.2.1. 400V
- 11.2.2. 800V
- 11.2.3. 1000V
- 11.2.4. Others
- 11.1. Market Analysis, Insights and Forecast - by Application
- 12. Competitive Analysis
- 12.1. Company Profiles
- 12.1.1 SolarBOS
- 12.1.1.1. Company Overview
- 12.1.1.2. Products
- 12.1.1.3. Company Financials
- 12.1.1.4. SWOT Analysis
- 12.1.2 HIS RENEWABLES GMBH
- 12.1.2.1. Company Overview
- 12.1.2.2. Products
- 12.1.2.3. Company Financials
- 12.1.2.4. SWOT Analysis
- 12.1.3 Innovative Solar
- 12.1.3.1. Company Overview
- 12.1.3.2. Products
- 12.1.3.3. Company Financials
- 12.1.3.4. SWOT Analysis
- 12.1.4 MidNite Solar
- 12.1.4.1. Company Overview
- 12.1.4.2. Products
- 12.1.4.3. Company Financials
- 12.1.4.4. SWOT Analysis
- 12.1.5 ABB
- 12.1.5.1. Company Overview
- 12.1.5.2. Products
- 12.1.5.3. Company Financials
- 12.1.5.4. SWOT Analysis
- 12.1.6 ConnectPV
- 12.1.6.1. Company Overview
- 12.1.6.2. Products
- 12.1.6.3. Company Financials
- 12.1.6.4. SWOT Analysis
- 12.1.7 EPEC Solutions
- 12.1.7.1. Company Overview
- 12.1.7.2. Products
- 12.1.7.3. Company Financials
- 12.1.7.4. SWOT Analysis
- 12.1.8 enwitec
- 12.1.8.1. Company Overview
- 12.1.8.2. Products
- 12.1.8.3. Company Financials
- 12.1.8.4. SWOT Analysis
- 12.1.9 HPL Electric & Power Limited
- 12.1.9.1. Company Overview
- 12.1.9.2. Products
- 12.1.9.3. Company Financials
- 12.1.9.4. SWOT Analysis
- 12.1.10 Schneider
- 12.1.10.1. Company Overview
- 12.1.10.2. Products
- 12.1.10.3. Company Financials
- 12.1.10.4. SWOT Analysis
- 12.1.11 Weidmüller
- 12.1.11.1. Company Overview
- 12.1.11.2. Products
- 12.1.11.3. Company Financials
- 12.1.11.4. SWOT Analysis
- 12.1.1 SolarBOS
- 12.2. Market Entropy
- 12.2.1 Company's Key Areas Served
- 12.2.2 Recent Developments
- 12.3. Company Market Share Analysis 2025
- 12.3.1 Top 5 Companies Market Share Analysis
- 12.3.2 Top 3 Companies Market Share Analysis
- 12.4. List of Potential Customers
- 13. Research Methodology
List of Figures
- Figure 1: Global AC Combiners Revenue Breakdown (undefined, %) by Region 2025 & 2033
- Figure 2: Global AC Combiners Volume Breakdown (K, %) by Region 2025 & 2033
- Figure 3: North America AC Combiners Revenue (undefined), by Application 2025 & 2033
- Figure 4: North America AC Combiners Volume (K), by Application 2025 & 2033
- Figure 5: North America AC Combiners Revenue Share (%), by Application 2025 & 2033
- Figure 6: North America AC Combiners Volume Share (%), by Application 2025 & 2033
- Figure 7: North America AC Combiners Revenue (undefined), by Types 2025 & 2033
- Figure 8: North America AC Combiners Volume (K), by Types 2025 & 2033
- Figure 9: North America AC Combiners Revenue Share (%), by Types 2025 & 2033
- Figure 10: North America AC Combiners Volume Share (%), by Types 2025 & 2033
- Figure 11: North America AC Combiners Revenue (undefined), by Country 2025 & 2033
- Figure 12: North America AC Combiners Volume (K), by Country 2025 & 2033
- Figure 13: North America AC Combiners Revenue Share (%), by Country 2025 & 2033
- Figure 14: North America AC Combiners Volume Share (%), by Country 2025 & 2033
- Figure 15: South America AC Combiners Revenue (undefined), by Application 2025 & 2033
- Figure 16: South America AC Combiners Volume (K), by Application 2025 & 2033
- Figure 17: South America AC Combiners Revenue Share (%), by Application 2025 & 2033
- Figure 18: South America AC Combiners Volume Share (%), by Application 2025 & 2033
- Figure 19: South America AC Combiners Revenue (undefined), by Types 2025 & 2033
- Figure 20: South America AC Combiners Volume (K), by Types 2025 & 2033
- Figure 21: South America AC Combiners Revenue Share (%), by Types 2025 & 2033
- Figure 22: South America AC Combiners Volume Share (%), by Types 2025 & 2033
- Figure 23: South America AC Combiners Revenue (undefined), by Country 2025 & 2033
- Figure 24: South America AC Combiners Volume (K), by Country 2025 & 2033
- Figure 25: South America AC Combiners Revenue Share (%), by Country 2025 & 2033
- Figure 26: South America AC Combiners Volume Share (%), by Country 2025 & 2033
- Figure 27: Europe AC Combiners Revenue (undefined), by Application 2025 & 2033
- Figure 28: Europe AC Combiners Volume (K), by Application 2025 & 2033
- Figure 29: Europe AC Combiners Revenue Share (%), by Application 2025 & 2033
- Figure 30: Europe AC Combiners Volume Share (%), by Application 2025 & 2033
- Figure 31: Europe AC Combiners Revenue (undefined), by Types 2025 & 2033
- Figure 32: Europe AC Combiners Volume (K), by Types 2025 & 2033
- Figure 33: Europe AC Combiners Revenue Share (%), by Types 2025 & 2033
- Figure 34: Europe AC Combiners Volume Share (%), by Types 2025 & 2033
- Figure 35: Europe AC Combiners Revenue (undefined), by Country 2025 & 2033
- Figure 36: Europe AC Combiners Volume (K), by Country 2025 & 2033
- Figure 37: Europe AC Combiners Revenue Share (%), by Country 2025 & 2033
- Figure 38: Europe AC Combiners Volume Share (%), by Country 2025 & 2033
- Figure 39: Middle East & Africa AC Combiners Revenue (undefined), by Application 2025 & 2033
- Figure 40: Middle East & Africa AC Combiners Volume (K), by Application 2025 & 2033
- Figure 41: Middle East & Africa AC Combiners Revenue Share (%), by Application 2025 & 2033
- Figure 42: Middle East & Africa AC Combiners Volume Share (%), by Application 2025 & 2033
- Figure 43: Middle East & Africa AC Combiners Revenue (undefined), by Types 2025 & 2033
- Figure 44: Middle East & Africa AC Combiners Volume (K), by Types 2025 & 2033
- Figure 45: Middle East & Africa AC Combiners Revenue Share (%), by Types 2025 & 2033
- Figure 46: Middle East & Africa AC Combiners Volume Share (%), by Types 2025 & 2033
- Figure 47: Middle East & Africa AC Combiners Revenue (undefined), by Country 2025 & 2033
- Figure 48: Middle East & Africa AC Combiners Volume (K), by Country 2025 & 2033
- Figure 49: Middle East & Africa AC Combiners Revenue Share (%), by Country 2025 & 2033
- Figure 50: Middle East & Africa AC Combiners Volume Share (%), by Country 2025 & 2033
- Figure 51: Asia Pacific AC Combiners Revenue (undefined), by Application 2025 & 2033
- Figure 52: Asia Pacific AC Combiners Volume (K), by Application 2025 & 2033
- Figure 53: Asia Pacific AC Combiners Revenue Share (%), by Application 2025 & 2033
- Figure 54: Asia Pacific AC Combiners Volume Share (%), by Application 2025 & 2033
- Figure 55: Asia Pacific AC Combiners Revenue (undefined), by Types 2025 & 2033
- Figure 56: Asia Pacific AC Combiners Volume (K), by Types 2025 & 2033
- Figure 57: Asia Pacific AC Combiners Revenue Share (%), by Types 2025 & 2033
- Figure 58: Asia Pacific AC Combiners Volume Share (%), by Types 2025 & 2033
- Figure 59: Asia Pacific AC Combiners Revenue (undefined), by Country 2025 & 2033
- Figure 60: Asia Pacific AC Combiners Volume (K), by Country 2025 & 2033
- Figure 61: Asia Pacific AC Combiners Revenue Share (%), by Country 2025 & 2033
- Figure 62: Asia Pacific AC Combiners Volume Share (%), by Country 2025 & 2033
List of Tables
- Table 1: Global AC Combiners Revenue undefined Forecast, by Application 2020 & 2033
- Table 2: Global AC Combiners Volume K Forecast, by Application 2020 & 2033
- Table 3: Global AC Combiners Revenue undefined Forecast, by Types 2020 & 2033
- Table 4: Global AC Combiners Volume K Forecast, by Types 2020 & 2033
- Table 5: Global AC Combiners Revenue undefined Forecast, by Region 2020 & 2033
- Table 6: Global AC Combiners Volume K Forecast, by Region 2020 & 2033
- Table 7: Global AC Combiners Revenue undefined Forecast, by Application 2020 & 2033
- Table 8: Global AC Combiners Volume K Forecast, by Application 2020 & 2033
- Table 9: Global AC Combiners Revenue undefined Forecast, by Types 2020 & 2033
- Table 10: Global AC Combiners Volume K Forecast, by Types 2020 & 2033
- Table 11: Global AC Combiners Revenue undefined Forecast, by Country 2020 & 2033
- Table 12: Global AC Combiners Volume K Forecast, by Country 2020 & 2033
- Table 13: United States AC Combiners Revenue (undefined) Forecast, by Application 2020 & 2033
- Table 14: United States AC Combiners Volume (K) Forecast, by Application 2020 & 2033
- Table 15: Canada AC Combiners Revenue (undefined) Forecast, by Application 2020 & 2033
- Table 16: Canada AC Combiners Volume (K) Forecast, by Application 2020 & 2033
- Table 17: Mexico AC Combiners Revenue (undefined) Forecast, by Application 2020 & 2033
- Table 18: Mexico AC Combiners Volume (K) Forecast, by Application 2020 & 2033
- Table 19: Global AC Combiners Revenue undefined Forecast, by Application 2020 & 2033
- Table 20: Global AC Combiners Volume K Forecast, by Application 2020 & 2033
- Table 21: Global AC Combiners Revenue undefined Forecast, by Types 2020 & 2033
- Table 22: Global AC Combiners Volume K Forecast, by Types 2020 & 2033
- Table 23: Global AC Combiners Revenue undefined Forecast, by Country 2020 & 2033
- Table 24: Global AC Combiners Volume K Forecast, by Country 2020 & 2033
- Table 25: Brazil AC Combiners Revenue (undefined) Forecast, by Application 2020 & 2033
- Table 26: Brazil AC Combiners Volume (K) Forecast, by Application 2020 & 2033
- Table 27: Argentina AC Combiners Revenue (undefined) Forecast, by Application 2020 & 2033
- Table 28: Argentina AC Combiners Volume (K) Forecast, by Application 2020 & 2033
- Table 29: Rest of South America AC Combiners Revenue (undefined) Forecast, by Application 2020 & 2033
- Table 30: Rest of South America AC Combiners Volume (K) Forecast, by Application 2020 & 2033
- Table 31: Global AC Combiners Revenue undefined Forecast, by Application 2020 & 2033
- Table 32: Global AC Combiners Volume K Forecast, by Application 2020 & 2033
- Table 33: Global AC Combiners Revenue undefined Forecast, by Types 2020 & 2033
- Table 34: Global AC Combiners Volume K Forecast, by Types 2020 & 2033
- Table 35: Global AC Combiners Revenue undefined Forecast, by Country 2020 & 2033
- Table 36: Global AC Combiners Volume K Forecast, by Country 2020 & 2033
- Table 37: United Kingdom AC Combiners Revenue (undefined) Forecast, by Application 2020 & 2033
- Table 38: United Kingdom AC Combiners Volume (K) Forecast, by Application 2020 & 2033
- Table 39: Germany AC Combiners Revenue (undefined) Forecast, by Application 2020 & 2033
- Table 40: Germany AC Combiners Volume (K) Forecast, by Application 2020 & 2033
- Table 41: France AC Combiners Revenue (undefined) Forecast, by Application 2020 & 2033
- Table 42: France AC Combiners Volume (K) Forecast, by Application 2020 & 2033
- Table 43: Italy AC Combiners Revenue (undefined) Forecast, by Application 2020 & 2033
- Table 44: Italy AC Combiners Volume (K) Forecast, by Application 2020 & 2033
- Table 45: Spain AC Combiners Revenue (undefined) Forecast, by Application 2020 & 2033
- Table 46: Spain AC Combiners Volume (K) Forecast, by Application 2020 & 2033
- Table 47: Russia AC Combiners Revenue (undefined) Forecast, by Application 2020 & 2033
- Table 48: Russia AC Combiners Volume (K) Forecast, by Application 2020 & 2033
- Table 49: Benelux AC Combiners Revenue (undefined) Forecast, by Application 2020 & 2033
- Table 50: Benelux AC Combiners Volume (K) Forecast, by Application 2020 & 2033
- Table 51: Nordics AC Combiners Revenue (undefined) Forecast, by Application 2020 & 2033
- Table 52: Nordics AC Combiners Volume (K) Forecast, by Application 2020 & 2033
- Table 53: Rest of Europe AC Combiners Revenue (undefined) Forecast, by Application 2020 & 2033
- Table 54: Rest of Europe AC Combiners Volume (K) Forecast, by Application 2020 & 2033
- Table 55: Global AC Combiners Revenue undefined Forecast, by Application 2020 & 2033
- Table 56: Global AC Combiners Volume K Forecast, by Application 2020 & 2033
- Table 57: Global AC Combiners Revenue undefined Forecast, by Types 2020 & 2033
- Table 58: Global AC Combiners Volume K Forecast, by Types 2020 & 2033
- Table 59: Global AC Combiners Revenue undefined Forecast, by Country 2020 & 2033
- Table 60: Global AC Combiners Volume K Forecast, by Country 2020 & 2033
- Table 61: Turkey AC Combiners Revenue (undefined) Forecast, by Application 2020 & 2033
- Table 62: Turkey AC Combiners Volume (K) Forecast, by Application 2020 & 2033
- Table 63: Israel AC Combiners Revenue (undefined) Forecast, by Application 2020 & 2033
- Table 64: Israel AC Combiners Volume (K) Forecast, by Application 2020 & 2033
- Table 65: GCC AC Combiners Revenue (undefined) Forecast, by Application 2020 & 2033
- Table 66: GCC AC Combiners Volume (K) Forecast, by Application 2020 & 2033
- Table 67: North Africa AC Combiners Revenue (undefined) Forecast, by Application 2020 & 2033
- Table 68: North Africa AC Combiners Volume (K) Forecast, by Application 2020 & 2033
- Table 69: South Africa AC Combiners Revenue (undefined) Forecast, by Application 2020 & 2033
- Table 70: South Africa AC Combiners Volume (K) Forecast, by Application 2020 & 2033
- Table 71: Rest of Middle East & Africa AC Combiners Revenue (undefined) Forecast, by Application 2020 & 2033
- Table 72: Rest of Middle East & Africa AC Combiners Volume (K) Forecast, by Application 2020 & 2033
- Table 73: Global AC Combiners Revenue undefined Forecast, by Application 2020 & 2033
- Table 74: Global AC Combiners Volume K Forecast, by Application 2020 & 2033
- Table 75: Global AC Combiners Revenue undefined Forecast, by Types 2020 & 2033
- Table 76: Global AC Combiners Volume K Forecast, by Types 2020 & 2033
- Table 77: Global AC Combiners Revenue undefined Forecast, by Country 2020 & 2033
- Table 78: Global AC Combiners Volume K Forecast, by Country 2020 & 2033
- Table 79: China AC Combiners Revenue (undefined) Forecast, by Application 2020 & 2033
- Table 80: China AC Combiners Volume (K) Forecast, by Application 2020 & 2033
- Table 81: India AC Combiners Revenue (undefined) Forecast, by Application 2020 & 2033
- Table 82: India AC Combiners Volume (K) Forecast, by Application 2020 & 2033
- Table 83: Japan AC Combiners Revenue (undefined) Forecast, by Application 2020 & 2033
- Table 84: Japan AC Combiners Volume (K) Forecast, by Application 2020 & 2033
- Table 85: South Korea AC Combiners Revenue (undefined) Forecast, by Application 2020 & 2033
- Table 86: South Korea AC Combiners Volume (K) Forecast, by Application 2020 & 2033
- Table 87: ASEAN AC Combiners Revenue (undefined) Forecast, by Application 2020 & 2033
- Table 88: ASEAN AC Combiners Volume (K) Forecast, by Application 2020 & 2033
- Table 89: Oceania AC Combiners Revenue (undefined) Forecast, by Application 2020 & 2033
- Table 90: Oceania AC Combiners Volume (K) Forecast, by Application 2020 & 2033
- Table 91: Rest of Asia Pacific AC Combiners Revenue (undefined) Forecast, by Application 2020 & 2033
- Table 92: Rest of Asia Pacific AC Combiners Volume (K) Forecast, by Application 2020 & 2033
Frequently Asked Questions
1. What is the projected Compound Annual Growth Rate (CAGR) of the AC Combiners?
The projected CAGR is approximately 15.99%.
2. Which companies are prominent players in the AC Combiners?
Key companies in the market include SolarBOS, HIS RENEWABLES GMBH, Innovative Solar, MidNite Solar, ABB, ConnectPV, EPEC Solutions, enwitec, HPL Electric & Power Limited, Schneider, Weidmüller.
3. What are the main segments of the AC Combiners?
The market segments include Application, Types.
4. Can you provide details about the market size?
The market size is estimated to be USD XXX N/A as of 2022.
5. What are some drivers contributing to market growth?
N/A
6. What are the notable trends driving market growth?
N/A
7. Are there any restraints impacting market growth?
N/A
8. Can you provide examples of recent developments in the market?
N/A
9. What pricing options are available for accessing the report?
Pricing options include single-user, multi-user, and enterprise licenses priced at USD 3950.00, USD 5925.00, and USD 7900.00 respectively.
10. Is the market size provided in terms of value or volume?
The market size is provided in terms of value, measured in N/A and volume, measured in K.
11. Are there any specific market keywords associated with the report?
Yes, the market keyword associated with the report is "AC Combiners," which aids in identifying and referencing the specific market segment covered.
12. How do I determine which pricing option suits my needs best?
The pricing options vary based on user requirements and access needs. Individual users may opt for single-user licenses, while businesses requiring broader access may choose multi-user or enterprise licenses for cost-effective access to the report.
13. Are there any additional resources or data provided in the AC Combiners report?
While the report offers comprehensive insights, it's advisable to review the specific contents or supplementary materials provided to ascertain if additional resources or data are available.
14. How can I stay updated on further developments or reports in the AC Combiners?
To stay informed about further developments, trends, and reports in the AC Combiners, consider subscribing to industry newsletters, following relevant companies and organizations, or regularly checking reputable industry news sources and publications.
Methodology
Step 1 - Identification of Relevant Samples Size from Population Database


Step 2 - Approaches for Defining Global Market Size (Value, Volume* & Price*)

Note*: In applicable scenarios
Step 3 - Data Sources
Primary Research
- Web Analytics
- Survey Reports
- Research Institute
- Latest Research Reports
- Opinion Leaders
Secondary Research
- Annual Reports
- White Paper
- Latest Press Release
- Industry Association
- Paid Database
- Investor Presentations

Step 4 - Data Triangulation
Involves using different sources of information in order to increase the validity of a study
These sources are likely to be stakeholders in a program - participants, other researchers, program staff, other community members, and so on.
Then we put all data in single framework & apply various statistical tools to find out the dynamic on the market.
During the analysis stage, feedback from the stakeholder groups would be compared to determine areas of agreement as well as areas of divergence